
- About Us
- Information
-

The Author ensures that the research has been conducted responsibly and ethically with adherence to all relevant regulations. read more..
- For Authors
- For Reviewer
- Manuscript Guidelines
- Membership
- Publication Ethics
-
- Journals
- Reprints
- e-Books
- Videos
- Policies
- Contact Us
 COVID-19
- Submissions


Full Text
Significances of Bioengineering & Biosciences
Imagecarb: An Intelligent Application for Carbohydrate Estimation in Type 1 Diabetes Management
Cristina MR Caridade1,2,3* and Dinis Pimentel1
1Polytechnic Institute of Coimbra, Coimbra Institute of Engineering, Portugal
2Research Centre for Natural Resources Environment and Society (CERNAS), Polytechnic Institute of Coimbra, Portugal
3Research Center for Sustainability, Polytechnic Institute of Coimbra, Portugal
*Corresponding author:Cristina MR Caridade, Polytechnic Institute of Coimbra, Coimbra Institute of Engineering, Coimbra, Portugal
Submission: September 22, 2025; Published: November 04, 2025

ISSN 2637-8078Volume7 Issue 5
Abstract
Type 1 Diabetes Mellitus (T1DM) requires strict carbohydrate counting to adjust insulin doses and maintain glycemic control. Manual carbohydrate estimation is time-consuming and prone to human error, creating a need for automated tools. This study presents the development of ImageCarb, an intelligent application implemented in MATLAB that automatically segments food items from digital images and estimates carbohydrate content. Images were standardized with a white round plate, single food type per plate and light background to ensure reliability. Two segmentation approaches were implemented: A manual Region of Interest (ROI) method and a fully automated segmentation method using colour space conversion (RGB to HSV and LAB), adaptive thresholding and morphological operations. Nutritional data were integrated from standardized databases photographic manual for food quantification [1]. Tests were performed with representative Portuguese foods, including carrots, courgettes, red cabbage, peas, beans, ham and cold cuts. Results demonstrated that the automated method achieved a discrepancy of only 2-3% compared with the manual method, validating its accuracy and robustness. Carbohydrate estimates were consistent with reference nutritional tables and the system successfully provided macronutrient breakdown (carbohydrates, proteins, lipids). The ImageCarb application thus offers a user-friendly tool to support carbohydrate counting in T1DM patients, with potential to improve glycemia management and quality of life. Future directions include expanding the system to complex mixed meals, integrating real-time continuous glucose monitoring and implementing a mobile application interface.
Keywords: Type 1 diabetes; Carbohydrate counting; Digital image processing; Food recognition
Abbreviations: ADA: American Diabetes Association; CHO: Carbohydrates; GUI: Graphical User Interface; HSV: Hue Saturation Value; LAB: Lightness, A (greenness-redness) and B (blueness-yellowness); T1DM: Type 1 Diabetes Mellitus; RGB: R (Red), G (Green) and B (Blue), ROI: Region of Interest
Introduction
Type 1 Diabetes Mellitus (T1DM) is a chronic autoimmune condition in which pancreatic β-cells are destroyed, resulting in little or no endogenous insulin production [2]. Without this hormone, the body cannot effectively transport glucose into cells for energy, leading to hyperglycemia and if uncontrolled, serious complications such as cardiovascular disease, neuropathy, retinopathy and nephropathy [3]. To prevent these outcomes, people with T1DM must administer exogenous insulin and closely monitor their blood glucose levels daily [4,5]. Carbohydrate (CHO) intake is the primary dietary factor influencing postprandial glycemia.
Accurate CHO counting allows patients to match insulin doses to the amount of CHO consumed, supporting better glycemia control and reducing the risk of both acute and long-term complications [3]. However, manual CHO estimation can be cognitively demanding, tiring and error-prone, particularly when assessing portion sizes and complex meals. For this reason, reliable methods and digital tools that simplify CHO estimation have become a priority in diabetes management and patient education. The present study makes use of the photographic manual for food quantification [1] as the reference nutritional database to ensure accurate and standardized macronutrient calculations.
Several digital solutions support nutritional monitoring, including applications such as MyFitnessPal, Carb Manager and SnapCalorie, which rely on databases and image recognition [6- 8]. However, these tools are not specifically designed for T1DM and often lack insulin dose calculation support. More specialized apps, such as CHO, integrate insulin calculators but remain limited in database flexibility and integration with continuous glucose monitoring [9]. In addition, although some mobile applications and digital interventions have been developed to encourage adherence to the Mediterranean diet or to include Mediterraneanstyle recipes [10-13], they are not specifically designed for CHO counting, nor do they integrate insulin management functionalities. Importantly, no tools have been identified that combine automatic image-based CHO estimation with adaptation to Portuguese and Mediterranean dietary habits. In this context, the ImageCarb project addresses a clear unmet need by providing a culturally adapted, automatic, image-based CHO counting tool specifically targeted to support T1DM patients. This article describes the methodology, implementation and evaluation of ImageCarb, highlighting its clinical relevance for T1DM management. Ultimately, the aim of this work is to ease the daily life of individuals living with T1DM by providing an intuitive and user-friendly tool that enables precise CHO counting through the digital image processing of foods.
Background: Type 1 Diabetes and Carbohydrate Counting
ImageCarb represents an added value for people with T1DM, offering a fast and simple approach to CHO counting based only on images of meals. By reducing the effort and uncertainty involved in manual CHO estimation, the application supports patients in achieving more precise insulin control. An additional advantage is the fact that this tool was developed in Portugal, being culturally adapted to Portuguese dietary habits and Mediterranean cuisine, which enhances its relevance for local users. T1DM is a medical condition in which the body produces little or no insulin. Insulin is the hormone responsible for transporting glucose from the bloodstream into the body’s cells, where it can be used as energy. When glucose is not properly absorbed, it accumulates in the blood, causing hyperglycemia. Persistent hyperglycemia is associated with damage to blood vessels, nerves, eyes, kidneys and other organs [3]. For people with T1DM, this means that continuous monitoring of glucose levels and strict control of insulin administration are part of their daily routine. CHO are the main dietary component influencing postprandial blood glucose levels. Following ingestion, CHO are metabolized to glucose, which becomes the primary source of immediate energy.
Simple CHO, such as sugar and fruit juice, are rapidly absorbed and cause sharp increases in glycemia, whereas complex CHO, such as whole grains and legumes, are digested more slowly, releasing glucose gradually and helping to stabilize glycemic levels [9]. Fiber also plays an important role in slowing glucose absorption, supporting improved metabolic control [3]. Table 1 (adapted from American Diabetes Association (ADA), 2023) illustrates the reference values for blood glucose levels in different conditions, showing the ranges for individuals without diabetes, with T1DM, as well as thresholds for hypoglycemia and hyperglycemia in fasting and postprandial states. These benchmarks highlight the importance of accurately matching CHO intake with insulin dosing to prevent both hypo-and hyperglycemic events. Nutritional education is therefore a cornerstone of T1DM management. Patients must learn to count CHO, understand the glycemic index and glycemic loads of foods and adjust insulin doses accordingly. In Portugal, where Mediterranean diet patterns dominate, integrating these concepts with local food habits is particularly important. By automating CHO counting and adapting the system to Portuguese foods, ImageCarb contributes not only to metabolic control but also to patient empowerment, education and quality of life.
Table 1: Reference values for blood glucose levels based on ADA, 2023.

Materials and Methods
Image dataset
Images were standardized to minimize variability: A white, round plate placed on a light background, containing only one type of food per image. This standardization reduced segmentation errors and improved reproducibility. Nutritional information and reference values for the foods analyzed were obtained from the photographic manual for food quantification [1]. One of the key reasons for selecting this database is that ImageCarb was developed specifically for the Portuguese context, where dietary habits are strongly influenced by the Mediterranean diet. Using a nutritional database rooted in Mediterranean food culture ensures that the system is adapted to local eating patterns and includes representative foods frequently consumed in Portugal, increasing both the relevance and accuracy of the application in clinical practice.
Image processing
In this study, the methodology is based on the application of
digital image processing techniques to automatically estimate the
amount of CHO present in foods from digital images. The process
begins with the acquisition of the image in RGB (Red, Green and
Blue) format, which is then converted to grayscale and enhanced
using a luminance method to highlight essential contrasts required
for accurate segmentation [14]. The steps of the processing pipeline
are:
A. Application of filters for lighting correction, histogram
equalization and background subtraction as pre-processing.
B. Conversion the image into RGB and HSV (Hue, Saturation
and Value) colour spaces to highlight contrast and facilitate
segmentation (Figure 1).
Figure 1: Example of viewing the original image (first line) in RGB (second line), HSV (third line) and LAB (fourth line).

C. Adaptive thresholding and morphological operations
(opening and closing) to reduce noise and enhance object
boundaries [15].
D. Conversion to Lab (lightness, greenness-redness and
blueness-yellowness) space for automatic plate detection using
channel L and segmentation of food using channels A and B
(Figure 1).
Manual vs automatic methods
Figure 2:Manual plate segmentation: Original image (A), manual ROI selection (B), generated mask (C) and identification of food on the plate (D).

Manual method: The manual procedure is intended for cases in which automatic segmentation is unreliable (e.g. unusual lighting, atypical plate geometry or complex background). After the input image is loaded (Figure 2A), the user is prompted to draw a circular Region of Interest (ROI) around the plate (Figure 2B); execution is suspended until the selection is completed. A binary mask is generated (Figure 2C). The mask is applied to the original image to isolate the plate area and remove irrelevant surrounding pixels. All subsequent segmentation steps are performed only inside this user-defined ROI to improve robustness: The image portion inside the ROI is enhanced with illumination-correction filters converted to an appropriate colour space and then segmented using adaptive thresholding (Otsu or local thresholding when needed). Morphological operations (opening and closing) are applied to remove small noise and to fill holes in segmented regions; small, connected components below a predefined pixel area are removed. The segmented result is presented to the user for visual confirmation (see Figure 2D). Although more time-consuming than the automatic route, the manual method provides a reliable fallback and allows accurate segmentation when automated detection fails.
Automatic method: The automated pipeline performs plate detection and food segmentation without user interaction. The original RGB image (Figure 3A) is converted to the LAB colour space to decouple luminance from chromaticity and improve robustness to variable lighting. Plate detection is performed in the L (luminance) channel, identifying the brightest and near-white regions (empirically, with thresholds of L>90 on a scale of 0 to 100). The regions found are analysed and circular/elliptical ones are candidates for locating the plate. Once the plate mask is obtained, the analysis is restricted to this area to exclude background and edge reflections. Food segmentation is then obtained by analysing the A and B chromaticity channels (Figure 1, which capture colour opposition), after applying adaptive thresholding, illumination correction, histogram equalization and background subtraction. Finally, morphological operators (opening, closing) are applied to remove noise and small isolated components (regions smaller than 100 pixels) obtaining the segmentation of the food. Final outputs are visualized by overlaying the binary food mask onto the original image with transparency (food highlighted in red, Figure 3D).
Figure 3:Automatic plate segmentation: Original image (A) and identification of food on the plate (D).

Implementation notes & fallback strategy: Both methods share the same segmentation and post-processing routines (illumination correction, thresholding, morphology, small-object removal and area-to-weight calibration), differing only in how the plate ROI is obtained (user-defined circle vs automatic detection in LAB). In practice, the software implements a confidence check after automatic detection: If plate geometry or segmentation quality metrics fall below thresholds, the interface offers the manual ROI option to the user. Figure 4 illustrate typical examples of the automatic (A2 for red cabbage and B2 for peas) and manual (A3, A4 for red cabbage and B3, B4 for peas) workflows.
Figure 4:Examples of manual (A1-A2 and B1-B2) and automatic (A3-A4 and B3-B4) segmentation of red cabbage and pea respectively.

Nutritional database and calculations
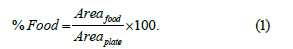
After food segmentation, the number of pixels corresponding to food (Areafood) and the number of pixels corresponding to plate (Areaplate) are then counted, providing the digital area occupied by the segmented item. The percentage of plate area occupied by food is computed by Equation (1).
To translate the food area into an estimate of the actual food weight, calibration factors were previously determined by correlating pixel areas with measured weights of real food samples placed under the same imaging conditions. The relationship is given by Equation (2):
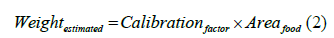
This conversion step ensures that digital measurements from the image can be consistently mapped to physical food quantities, reducing the variability and uncertainty associated with purely visual estimation.
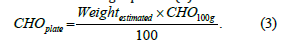
Once the estimated weight of food is obtained, the nutritional composition is derived using standardized references. In this work, the photographic manual for food quantification [1] was selected as the primary nutritional database, given its suitability for Portuguese and Mediterranean dietary patterns. For each food, the macronutrient content per 100g is extracted from the manual, and the actual nutrient values in the segmented portion are calculated. CHO content is obtained using Equation (3).
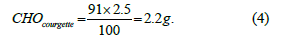
Similar formulas were applied for proteins and lipids, replacing CHO100g with the respective nutrient content per 100g. For example, in the analysis of a courgette in the plate, suppose the estimated weight is 91g. Given that 100g of courgette contain approximately 2.5g of CHO, the amount of CHO in the plate is calculated as represented in Equation (4)
This automated approach minimizes human error typically associated with manual or visual carbohydrate counting, thereby supporting more effective self-management of T1DM. Both manual and automatic image processing methods feed into this same nutritional estimation workflow, differing only in how the food area is obtained. Similar formulas were applied for proteins and lipids.
Validation
To evaluate the performance of the proposed methodology, a validation study was conducted using a representative set of foods commonly consumed in Portugal, such as carrots, zucchini, red cabbage, peas, beans, ham and meat. The selection included both plant-based foods (vegetables and legumes) and animal-based foods, ensuring that the system could handle different colours, textures and shapes. For each food type, multiple images were acquired under standardized conditions and processed using manual and automatic segmentation methods. Figure 5 shows several different images of the same food. The percentage of the plate area occupied by the food was calculated in both cases, and the estimated CHO content was calculated according to the nutritional database described in Section 3.1. The accuracy of the automatic approach was assessed by comparing its results to the manual method, which was treated as the reference or “gold standard.” The mean relative error across all tested samples was approximately 2-3%, indicating that the automatic segmentation provides estimates very close to those obtained with manual intervention. For example, the estimated CHO content for carrots was 1.9g using the automatic method compared with 1.8g using manual segmentation, and for courgettes 2.2g vs. 2.1g, respectively. These small discrepancies fall within acceptable tolerance levels for dietary management and clinical practice.
Figure 5:Images of a plate with different amounts of olives.

In addition to numerical comparisons, visual inspection of the segmentation overlays confirmed that the automated method successfully isolated food regions with minimal background interference. The method’s robustness was particularly evident for foods with strong colour contrasts relative to the plate (e.g., red cabbage and carrots), while some challenges were observed with foods with lighter hues, irregular contours (e.g., peas and ham) or with shadows, light reflections and image distortions. Figure 6 shows that the presence of irregular contours (top row) and light reflections (bottom row) can influence the effectiveness of automated food segmentation. However, noise removal and morphological filtering reduced misclassification in these cases and overall accuracy remained high. This validation confirmed that ImageCarb can provide reliable macronutrient estimates with minimal error, reinforcing its potential as a practical tool for CHO counting in the treatment of T1DM.
Figure 6:Examples of images with irregular contours (top row) and light reflections (bottom row) that can influence the effectiveness of automatic food segmentation.

Application development
The ImageCarb application was developed using MATLAB [16], incorporating a Graphical User Interface (GUI) to enhance usability and streamline user interaction. The core objective of ImageCarb is to enable users to upload a digital image of a food plate and through either automatic segmentation or manual plate selection, estimate the occupied area and calculate the approximate nutritional values of CHO, proteins and lipids. Given the clinical context, particular emphasis was placed on CHO, as they are the most critical macronutrient for glycemic control in T1DM.
Graphical interface structure: The GUI was designed with four
main panels to provide an intuitive workflow (see Figure 7):
a) Original image (top-left corner), where the loaded image
is displayed prior to any processing.
b) Food segmentation (top-right corner), showing the
processed food segmentation after analysis.
c) Results table, a structured output panel where each
analysed food is listed with its: Food name, Food area (%),
weight (g), CHO (g), lipids (g) and proteins (g).
d) Status message (text box below the table), informing the
user of the current process stage (e.g., “Ready to use” at startup
or “Analysis complete” after segmentation).
Buttons and functionalities: Several interactive buttons were implemented to enhance user control (see Figure 7):
Figure 7:Application development in Matlab [16].

Figure 8:Example of different thicknesses of the same food (chocolate mousse).

A. Image upload-select and load an image into the interface.
Pre-processing corrections (e.g., illumination) may be applied
automatically.
B. Plate selection (Automatic)-detects and masks the plate
automatically, isolating only food pixels.
C. Plate selection (Manual)-allows the user to manually
draw a circular Region of Interest (ROI), particularly useful in
cases where automatic detection fails.
D. Clear table-deletes all entries in the results table, with
confirmation messages to prevent accidental data loss.
E. Export to excel-saves nutritional results to an Excel file,
enabling users to maintain a structured dietary history and
share data with nutritionists or healthcare professionals.
F. Menus were also included to:
G. Select food-link each food to stored nutritional values.
H. Select Thickness-approximate average food thickness
(3mm, 5mm or 10mm) for 3D volume and weight estimation
(Figure 8).
Calculation workflow: The application combines segmentation
results with nutritional database values to compute nutrient
content. The following sequence is applied:
a) Food area (pixels) is determined relative to total plate
area.
b) Volume estimation (cm³) is calculated using the area and
user-selected food thickness.
c) Weight estimation (g) is derived by applying food density
values.
d) Macronutrient calculation (CHO, proteins, lipids) is
performed using food composition per 100g.
For example, cooked beans occupying ~6000 pixels with 10mm thickness and a density of 1.05g/cm³ resulted in a mass of ~4.4g. Based on nutritional tables (16.5g CHO, 8.9g proteins, 0.5g lipids per 100g), the estimated values were ~0.73g CHO, 0.39g proteins and 0.02g lipids. This structured approach, supported by standardization of images (white circular plate, single food per image), enabled consistent and reproducible testing conditions.
Results and Discussion
Initial tests
Importantly, no tools have been identified that combine automatic image-based CHO estimation with adaptation to Portuguese and Mediterranean dietary habits; therefore, the ImageCarb project was designed to fill this gap by providing a culturally adapted, image-based carbohydrate counting tool specifically targeted to support T1DM patients. The aim was to verify whether the segmentation methods and nutritional estimations provided coherent and realistic results across foods with distinct textures, colours and shapes. The foods selected for these tests included sliced carrots, courgettes, red cabbage, peas, cooked beans, ham, cold cuts, etc. Each item was analysed using both the manual and automatic segmentation approaches and the resulting food areas were compared. Some results of these tests are summarized in Table 2, which presents, for each food, the measured quantity in grams, the percentage of plate area detected by the automatic and manual methods and the corresponding macronutrient content (CHO, proteins and lipids). The Table 2 shows that, overall, discrepancies between manual and automatic methods were small, averaging only 2-3%. Although the manual method consistently produced slightly lower plate area values than the automatic one, both approaches led to comparable macronutrient estimates.
Table 2: Foods and their characteristics according to ImageCarb analysis.

Figure 9:Graphical representation of three macronutrients (CHO, Proteins, Lipids).

This is a strong indication of the reliability of the automatic segmentation. In addition, the results confirmed that the application provides not only carbohydrate estimates but also protein and lipid values, offering patients a broader nutritional overview. For example, in the case of red cabbage, the system estimated 5.6g of HCO, 1.6g of proteins, and 5.7g of lipids, closely matching reference values from nutritional tables. Figure 9 presents a graphical representation of the three macronutrients (CHO, proteins and lipids) estimated for each tested food, allowing users to quickly compare the nutritional composition of different items. Such visualizations are particularly helpful for diabetic patients in daily decision-making regarding meal planning and insulin adjustment.
Accuracy of automatic vs manual methods
Across all tested samples, discrepancies between methods averaged 2-3%, confirming the robustness of the automatic segmentation procedure. Table 2 (first 3 columns) illustrates the close agreement between the automatic and manual methods, showing only minor differences in the percentage of plate area attributed to each food. The close agreement between the automatic and manual methods demonstrates that the system can provide reliable results without user intervention. Visual inspection of segmentation overlays further confirmed that the automatic method correctly identified food areas, even in cases where colour similarity with the plate could have posed difficulties. While high-contrast foods such as carrots and red cabbage were segmented with nearperfect precision, lighter foods such as ham or peas presented more subtle challenges. Nevertheless, the implementation of background subtraction, histogram equalization and morphological filtering minimized misclassification, yielding stable results across food types. It is important to note that these segmentation outcomes form the foundation for the nutritional estimations presented in the previous section. By ensuring strong agreement between manual and automatic measurements, the reliability of the macronutrient values derived from these segmentations is reinforced, further validating the use of the automatic method in daily practice.
Nutrient estimation
The application successfully estimated macronutrients (CHO, proteins, lipids) based on the segmented areas and calibration factors described in Section 2.4. All values were consistent with those reported in the nutritional database (Photographic Manual for Food Quantification, Torres D et al. [1]). For example, in the courgette case study, an estimated portion of 91g corresponded to 2.2g of HCO, closely matching theoretical values. This agreement reinforces the validity of combining digital image analysis with standardized nutritional references. Segmented image outputs provided visual confirmation of correct food isolation, supporting both transparency and user trust in the system.
Clinical implications
Automating HCO counting addresses a significant challenge for individuals with T1DM, who must repeatedly estimate carbohydrate intake throughout the day. By reducing the cognitive burden and minimizing human error, ImageCarb directly supports more accurate insulin dosing. This can contribute to improved glycemic control, reduce the frequency of hypo-and hyperglycemic events and enhance patient autonomy. Moreover, unlike generic nutrition applications, ImageCarb integrates foods typical of Portuguese cuisine, thereby offering a culturally adapted and clinically relevant tool. Moreover, the role of ImageCarb may extend beyond glycemic management, potentially influencing metabolic pathways related to diabetic gene expression. In particular, it has been proposed that improved carbohydrate counting and dietary regulation may enhance the activation of Sirtuin 1, a gene associated with cellular protection and the prevention of Type 1 Diabetes Mellitus (T1DM) [17].
Limitations and future work
While the results demonstrate the robustness and accuracy
of the ImageCarb application, some practical considerations and
areas for further development remain to be addressed.
A. The current system requires standardized images
of single-food portions; extension to mixed meals is still a
challenge.
B. A mobile version is under development to increase
accessibility and facilitate real-time use in daily life.
C. Integration with continuous glucose monitoring and
insulin dosing calculators would further enhance clinical utility.
D. Additional validation with larger and more diverse
datasets, including mixed dishes and different lighting
conditions, is needed to generalize the system’s applicability.
Conclusion
The development of the ImageCarb application demonstrated the feasibility of using digital image processing techniques to support nutritional management in people with T1DM. By implementing both a manual method, based on user-defined ROI, and an automatic method, based on colour segmentation and contour detection, the system was able to estimate CHO content from food images with encouraging accuracy. Validation tests with different food types confirmed that discrepancies between the two approaches were generally small (2-3%), and both methods provided consistent nutritional estimations. The automatic method proved to be faster and more consistent in cases of regular-shaped, high-contrast foods, while the manual method was more precise in complex scenarios but dependent on the user’s experience. Analysis of different portion sizes of the same food also showed that the application responded proportionally to changes in quantity, ensuring coherence in weight and macronutrient estimates. Some variations were observed in larger portions, which may be attributed to the simplified two-dimensional model used and the lack of a real calibration system with physical reference objects.
Despite these limitations, the results validate the concept of ImageCarb as a practical and promising digital health tool for daily CHO counting in T1DM, contributing to improved glycemic control and better quality of life for patients. The main limitations identified include the influence of lighting and shadows on automatic segmentation, difficulties in detecting overlapping foods, the absence of precise thickness measurement of food items and variability introduced by different users when performing manual selection. Addressing these issues is essential to enhance the robustness and clinical applicability of the system. Future Work building upon these findings, several directions for future development are proposed. The automatic segmentation system can be enhanced through the integration of Artificial Intelligence (AI) and Convolutional Neural Networks (CNNs) for automatic food recognition and more precise contour detection. Introducing physical calibration methods, such as reference objects with known dimensions placed on the plate, could significantly improve volume estimation and therefore the accuracy of mass and macronutrient calculations. The use of 3D reconstruction techniques may further refine estimations for larger or irregular food portions. Expanding the dataset to include a wider variety of foods, including mixed meals and culturally specific dishes, will improve the generalizability of the application.
Additionally, implementing a mobile-friendly version of ImageCarb and integrating it with continuous glucose monitoring systems and insulin dose calculators would strengthen its utility in everyday diabetes management. In conclusion, the ImageCarb project successfully achieved its objectives by demonstrating that automated CHO estimation from food images is both feasible and clinically relevant. With continued improvements and validation, ImageCarb has the potential to evolve into a robust reference tool for nutritional management in T1DM, combining technological innovation with practical applicability in real-world settings.
Acknowledgements
The authors would like to acknowledge the Coimbra Institute of Engineering for its support throughout the development of this project, as well as express gratitude for the permission to use images from the photographic manual for food quantification [1], which served as a valuable reference for the image database.
Conflict of Interest
The authors declare no conflict of interest.
References
- Torres D, Nuno F, Nataline S, Sérgio T, Rita S, et al. (2017) Photographic manual of food quantification. (2nd edn), Faculty of Nutrition and Food Sciences, University of Porto, Porto, Portugal.
- Gardete CL (2010) Diabetes mellitus in Portugal: Epidemiology and public health impact. Rev Port Public Health 28(1): 7-16.
- Nuha AE, Grazia A, Vanita RA, Raveendhara RB, Florence MB, et al. (2023) Introduction and methodology: Standards of care in diabetes-2023. Diabetes Care 46(Suppl 1): S1-S4.
- Nuha AE, Grazia A, Vanita RA, Raveendhara RB, Florence MB, et al. (2023) Facilitating behavior change and well-being to improve health outcomes: Standards of medical care in diabetes-2023. Diabetes Care 46(Supplement_1): S68-S96.
- Ramos FP, Santos LA, Reis AB (2013) Food and nutrition education in school: A literature review. Cadernos de Saúde Pública 29(11): 2147-2161.
- Carb Manager.
- Carvalho R (2024) Cho application for carbohydrate counting and insulin calculation. Nutr Clin Metab 38(2): 55-62.
- Martínez PB, Palacios NA, López M, Isla P, Cruz J (2022) Quality and presence of behaviour change techniques in mobile apps for the mediterranean diet: A content analysis of android google play and apple app store apps. Nutrients 14(6): 1290.
- Marventano S, Grosso G, Mistretta A, Calabrese G, Caimi G, et al. (2021) Technology-based nutrition interventions using the mediterranean diet: A systematic review. Nutrients 13(10): 3461.
- Mezgec S, Furlan R, Perš J, Marolt M (2023) An automated image-based dietary assessment system for mediterranean foods: The MedGRFood dataset. Nutrients 15(9): 2070.
- Sánchez A, Ortega RM, Redondo MR, López AM (2022) SAlBi educa, a tailored nutrition app for improving dietary habits: Initial evaluation of usability. Front Nutr 9: 782430.
- Caridade CM, Morais AR (2023) Medical imaging fusion: A teaching-learning simulation environment. Open Science Index 18: 207.
- Gonzalez R (2018) Digital Image Processing. (4th edn), Pearson, London, UK.
- (2022) MATLAB version: 9.13.0 (R2022b). The MathWorks Inc, Natick, Massachusetts, USA.
- Marzouki AA (2018) Sirtuin 1, a diagnostic protein marker and its relevance to chronic disease and therapeutic drug interventions. EC Pharmacology and Toxicology 6(4): 209-215.
© 2025 Cristina MR Caridade, This is an open access article distributed under the terms of the Creative Commons Attribution License , which permits unrestricted use, distribution, and build upon your work non-commercially.
Editor In Chief


.jpg)


Signup for Newsletter

Quick Links
 Editorial Board Registrations
 Submit your Article
 Refer a Friend
 Advertise With Us
Our Recent Edition

.jpg)


Top Editors


.jpg)


.bmp)
.jpg)
.png)
.jpg)


.jpg)


.png)

.png)


.png)


Financial Support

Sponsors

Latest e-Books

Latest Video

 a Creative Commons Attribution 4.0 International License. Based on a work at www.crimsonpublishers.com.
Best viewed in
a Creative Commons Attribution 4.0 International License. Based on a work at www.crimsonpublishers.com.
Best viewed in