- Submissions

Full Text
Research in Medical & Engineering Sciences
Possibilities of the Akabane Test for Thermopuncture Control of Blood Cholesterol in Diabetes Mellitus
Valery Muzhikov1*, Elena Vershinina2, Kirill Nikitin3 and Ruslan Muzhikov4
1Med Byte Ltd, 195220, St. Petersburg, Gzhatskaya str. 5/3-139, Russia
2Laboratory of Information Technologies and Mathematical Simulation, Pavlov Institute of Physiology, 195213, St. Petersburg, Granitnaya str., 46/2-79, Russia
34Software Engineering, Department of Computer Systems & Software Engineering, Peter the Great Polytechnic University, St. Petersburg, Russia
4Software Engineering, Med Byte Ltd, Russia, 195220, St. Petersburg, Gzhatskaya str. 5/3-139
*Corresponding author:Valery Muzhikov, M.D, PhD, Med Byte Ltd, 195220, Gzhatskaya str. 5/3-139, St. Petersburg, Russia
Submission: July 14, 2025;Published: September 11, 2025

ISSN: 2576-8816Volume12 Issue1
Abstract
Background: The problem of dyslipidemia in diabetes is very relevant, since most of these patients die from atherosclerotic lesions and arterial thrombosis due to lipid metabolism disorders. At the same time, there is currently only invasive assessment of blood lipids, which makes their real monitoring very problematic. The hypothesis of the study was to identify the relationships between the level of cholesterol, as one of the most atherogenic LDL, and the of thermal pain sensitivity (TPS) according to the Akabane test at standard diagnostic points of the acupuncture channels (AC). The presence of such relationships provides a basis for assessing LDL by calculation method using TPS.
Methods/Design: To identify the relationships between the TPS of acupuncture channels and the concentration of cholesterol in the blood, a total of 105 patients with type 1 diabetes (11 men and 94 women) and 158 patients with type 2 diabetes (70 men and 88 women) were examined. The norm is 57 people, these are men from 26 to 35 years old and a group of 57 women without diabetes, aged 40 to 60 years. All patients underwent blood lipid biochemistry and the Akabane test with TPS assessment, which allowed for the analysis of relationships.
Result: Various methods of statistical analysis revealed reliable relationships between the TPS of certain AC and the level of cholesterol in the blood both in normal conditions and in type 1 and 2 diabetes in men and women. Moreover, these relationships mainly concerned the same AC, which reflect the work of various organs and systems usually involved in lipid metabolism, with the exception of some gender characteristics in diabetes. At the same time, the assessment of the degree of pathological disorders of cholesterol by TPS may be based on the principle of their symmetry violation, which allows for the gradation of lipid metabolism disorders by severity on new principles, by calculation based on individual or group “Training measurements”
Conclusion: Thus, based on the results of the TPS assessment at certain diagnostic points of the TCM, the proposed concept and the results obtained in this study, it becomes possible to non-invasively assess various types of lipid metabolism by calculating non-invasively using neural networks and AI on large clustered samples, which will improve the accuracy of the assessment. Further development of this technology will allow the creation of a new generation of autonomous diagnostic devices for monitoring lipid metabolism on new principles.
Keywords:Cholesterol; Diabetes mellitus type 1-2; Akabane test; Metabolic disorders; Acupuncture channels
Abbreviation: AC: Acupuncture Channels; TCM: Traditional Chinese Medicine; TPS: Thresholds of Thermal Pain Sensitivity; T1D: Diabetes Mellitus Type 1; T2D: Diabetes Mellitus Type 2; BAР: Biological Active Points
Introduction
According to statistics, up to 97% of patients with insulin resistance have abnormal fat metabolism [1-3]. One of the main factors increasing the cardiovascular risk associated with diabetes is dyslipidemia, which includes abnormalities in all fractions of lipoproteins, including low-density lipoproteins (LDL), which include cholesterol and B-lipoproteins [4-8].
They are also called “bad cholesterol”, since they often remain on the vascular walls, which leads to the appearance of unstable cholesterol “killer plaques” on the vessels [9]. Beta lipoproteins are the main transport form of cholesterol. Normally, 80% of them are formed in the liver and 20% come with food, forming a shell of drop-shaped formations - chylomicrons, inside which there is cholesterol, which is thus transported in the blood. Cholesterol itself is not soluble in water. Therefore, pure cholesterol cannot travel independently through blood plasma. For transportation, synthesized sterol binds to very low- or low-density lipoproteins (LDL). Results from the United Kingdom Prospective Diabetes Study (UKPDS) showed that intensive glycemic control significantly reduces the risk of microvascular complications of diabetes, but does not have a significant effect on macrovascular complications and overall mortality [10].
The UKPDS study data also demonstrate the existence of a relationship between the risk of coronary heart disease and LDL cholesterol concentration in patients with type 2 diabetes: an increase in LDL cholesterol concentration by 1 mmol/l is accompanied by a 1.57-fold increase in the risk of developing coronary heart disease [11]. Each of these dyslipidemia features is associated with an increased risk of cardiovascular diseases [12,13]. Therefore, in diabetes, it is extremely important to monitor LDL lipid metabolism, which is now carried out using complex invasive biochemical blood tests. Therefore, we began to look for alternative options for non-invasive assessment of dyslipidemia on new principles, using the acupuncture channel system and their TPS indicators at diagnostic points as a sensor. Earlier, for example, we received clear data that in diabetes, these indicators reflect the blood glucose level [14-17], which, by analogy, gives hope for their reaction to blood lipids. In this study, we did not set the task of a detailed study of all the nuances of lipid metabolism in diabetes. We wanted to get an answer - whether the TPS channel parameters reflect changes in lipid metabolism or not. If such connections can be traced, then the possibility of easy control of levels cholesterol by calculation method according to the Akabane thermopuncture test appears. For a preliminary assessment of the results, we present data on the connections with acupuncture channels mainly only for cholesterol in the blood, as the most dangerous in diabetes.
Material and Methods
The studies were conducted in a specialized endocrinology department in the morning on an empty stomach, by taking blood from a vein with subsequent Akabane test. A total of 105 patients with type 1 diabetes (11 men and 94 women) and 158 patients with type 2 diabetes (70 men and 88 women) were examined. The norm is 57 people, these are men from 26 to 35 years old and a group of 57 women without diabetes, aged 40 to 60 years.
To quantitatively evaluate a channel’s activity level in TCM, the so-called “sacrificial stick” test was used in ancient times in China. This test involved a burning sandal stick that was brought in proximity to points at the tips of every finger and toe until the first sensation of pain. At each point, the pulse rate before pain was first felt, was measured. If the number of pulse beats was lower than the average one for all the channels, it proved the hyperactivity of an acupuncture channel and its corresponding organ. Conversely, when the rate was higher, it represented the inactivity of a channel and its corresponding organ. This test was described by the Japanese doctor Koben Akabane in 1956. Since then, the test has carried his name [18].
According to classical Oriental literature as well as according to
our study results [17,19-21], the following channels have different
regulatory functions:
a) LU- lungs channel, connected with the function of lungs and
tissue breathing.
b) Li- large intestine channel, connected with the large intestine
function and its microbe flora, it participates in the regulation
of arterial pressure, biochemical blood indices.
c) PC - pericardium channel, connected with the cardiac muscle
trophicity and its structure. In addition, it is connected to
muscular activity, arterial blood pressure levels and emotions.
d) TE- triple heater channel, connected to the central and
peripheral hemodynamic, and with body energy consumption.
In addition, it regulates the hormones in the body, thyroid and
hypophysis.
e) HT - heart channel, regulates the cardiac rhythm, body’s
physical strength
f) Si - small intestine channel, connected to the electrolytic
balance and food digestion.
g) SP- spleen-pancreas channel is connected to the pancreas and
immunity.
h) LR- liver channel is connected to liver function and central
nervous system, stress levels
i) St- stomach channel is connected to the digestion function.
j) GB- channel of the gallbladder is connected to the digestion
function and peripheral nervous system.
k) Ki- kidney channel is connected to the kidney function and the
adrenal glands, controls the total supply of energy in the body
and its redistribution.
l) BL- urinary bladder channel is connected to the urogenital
system, its functions and its related hormones, it reflects the
state of vertebrae column as well.
m) СV -channel, reflects the general accumulation of energy in the
body and anabolic processes
n) GV- channel, reflects the general energy expenditure and
catabolic processes.
Each channel consists of the left (l) and the right (r) branch between which normal symmetrical activity balance is maintained. TРS is our bodies’ basic reactive system; it is as significant as important indicators such as body temperature, as it gives a very clear representation of functional and psycho-physiological profiles. Their topography is shown in Figure 1.
Figure 1:Topography of acupuncture points, used for evaluation of the AC in Akabane test.
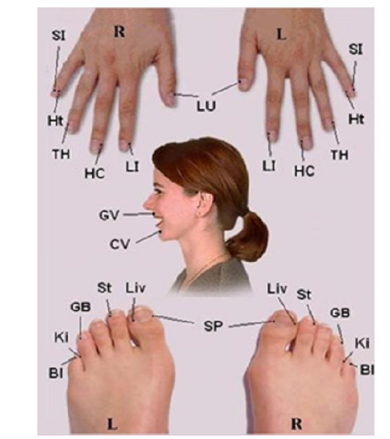
This test measures the pain thresholds in temperature sensitivity (TРS) when heat is applied to the “entrance-exit” points of each channel (LU11, LII1, PC9, TE1, HT9, SI1, SP1, LR1, ST45, GB44, KI1, and BL67) by applying an impulse light-emitting diode (LED) non-coherent infrared radiation (IR)-light onto the skin (f=1 Hz, λ=920nM), recording the total energy expenditure in joules [17,19,22]. Each impulse radiates 0.07 joules of thermal energy. These measurements were carried out using a certified device - “ChiMaster”, invented by the author of this paper.
The analysis of the relationship between biometrical indicators and AC was carried out using correlations (Pearson and Spearman coefficients), multifactorial ANOVA analysis, T-test, Mann-Whitney test and factor analysis using Extraction Method. Statistical decisions were made at the 5% (р≤0.05). significant level (р≤0.05). We used the SPSS software package version 15.
Result
Cholesterol in Norm
In our practice, to assess metabolic disorders, we usually use direct comparisons, such as cholesterol levels with the ТРS 12 or 24 AC, taking into account their left and right branches, as well as their ratio coefficients, as the most informative indicator. This is due to the fact that the right branch of the AC, as we have previously established, reflects anabolic processes, and the left branch - catabolic [15-17,23], therefore, a shift of this indicator greater or less than 1.0 shows which processes dominate at the level of a particular organ or system at the time of the test. Next, the relationships of cholesterol in the norm depending on gender were considered.
Men
In the case of correlation assessments in men in the norm, reliable direct relationships of the ТPS channels with the level of cholesterol in the blood were not revealed. There are only significant correlations with the atherogenicity index (r = .266; p = .046), which were revealed by the ratio of the ТPS of the right and left branches of the pericardial canal (PC). This channel also had connections with high-density cholesterol level (r = .267; p = .045) according to the sum of the right and left ТPS indicators. The pericardium channel reflects muscle activity and myocardial trophism. Therefore, such connections are quite logical, since cholesterol expenditure increases during physical exertion.
Women
For a more visual assessment of the dependence of ТPS on
cholesterol level, graphs were constructed with a more informative
and sensitive indicator for assessing metabolism, which was
calculated using the formula:
K = ТPS of the right branches of the AC / ТPS of the sum of the
right and left branches of the AC
In this case, if K is less than 50%, this shows the dominance of the TPS of the left branches of the AC, reflecting the growth of energy expenditure and the excess of catabolic processes in a particular system over anabolic ones. And vice versa, when K is more than 50%, this reflects the proportional growth of anabolic processes and the accumulation of energy reserves in the system.
The Figure 2 shows the profile of TPS values for 12 channels in terms of R / L ratios in normal women, depending on cholesterol fluctuations in three ranges. In this case, the cholesterol level is taken in arbitrary units, where the level from 208 to 248 corresponds to the norm. In general, there is no linear relationship between cholesterol values and AC indicators. Low values of the K index (K<50%) are noteworthy, due to high values TPS of the left branch in the KI and BL channels with the highest cholesterol values, which indicates a violation of symmetry and harmony in these systems. In fertile women, the TPS values by AC-BL normally reflect the level of sex hormones: in the middle of the cycle, the TPS values of the right branch exceed the left ones, but at the onset of menstruation, the TPS values of the left branches prevail. Constantly high values on the left reflect the phenomena of dyshormonosis in this area [17,23]. This condition can be considered as a breakdown of the compensatory mechanisms of the hormonal system, which leads to high cholesterol values in the blood. A similar situation for the AC of the kidneys reflects the predominance of energy expenditure in this system and a decrease in fat reserves in the paranephria, where the operational energy reserve in the body is located in the form of fat deposits [17,19,23,24]. It is also interesting to note the situation in the pericardial canal, when normal cholesterol values are associated with a pronounced increase in the TPS indicator of its left branch, reflecting high muscle activity, including the myocardium. To a lesser extent, a similar picture is observed in the heart canal (HT), associated with its increased activity. Therefore, high activity of the cardiovascular system, for example, during physical exercise, leads to normalization of cholesterol levels in women, which corresponds to accepted scientific views.
Figure 2:TPS profiles of 12 chanels in R / L ratios at norm women on 3 ranges of cholesterol.
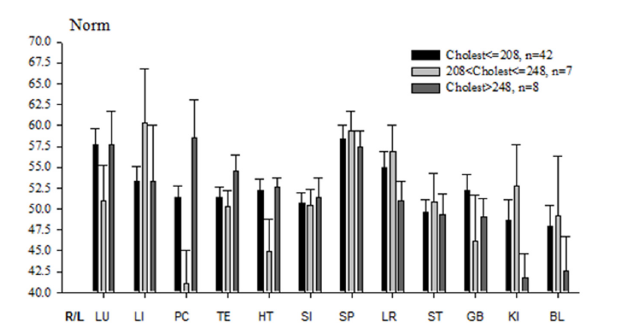
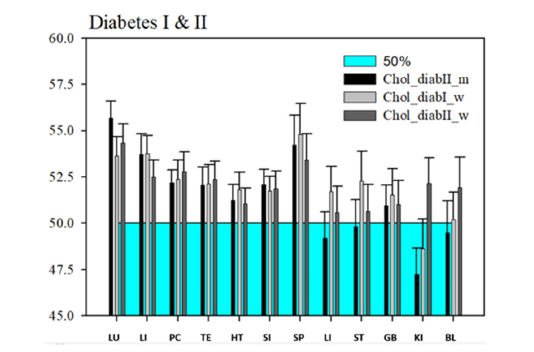
Figure 3 shows the average values of the TPS for 12 AC in the Right/Left relations in patients with T1-2 diabetes depending on gender. However, there were no men with T1D in the study due to their small number (5 people). In women with both types of diabetes, an excess of the TPS values of the right branch over the left is noted for all ACs, with the exception of AC -KI, which generally indicates the predominance of anabolic processes in these systems. A similar situation is noted in men with T2D, with the exception of AC-KI, Bl and LR, where there is a predominance of energy expenditure.
Figure 3:Average values of the TPS for 12 AC in the Right/Left relations in patients with T1-2 diabetes depending on gender.
To visually assess the effect of cholesterol level on TC channels, 4 ranges of its values in mmol/l were analyzed in type 1 and type 2 diabetes in men and women. Division into groups is shown in Table 1.
Table 1:Grouping of data on cholesterol in mmol/l and comparison of groups.

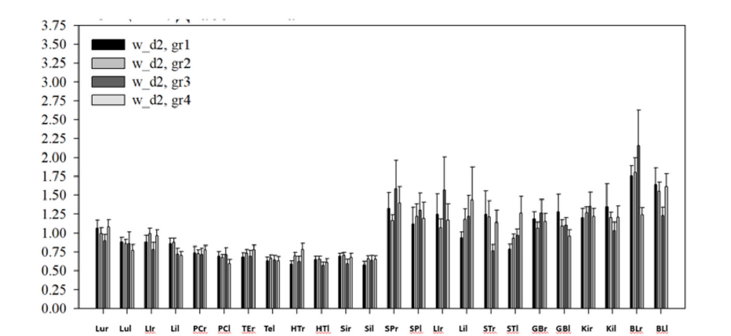
Figure 4 shows the dependencies of the scaled average values of the TPS indices for 24 channels in women with T1D with cholesterol levels in four ranges of changes.
Figure 4:Relationships of the scaled average values of the TPS indices for 24 channels in women with T1D with cholesterol levels in four ranges of changes.
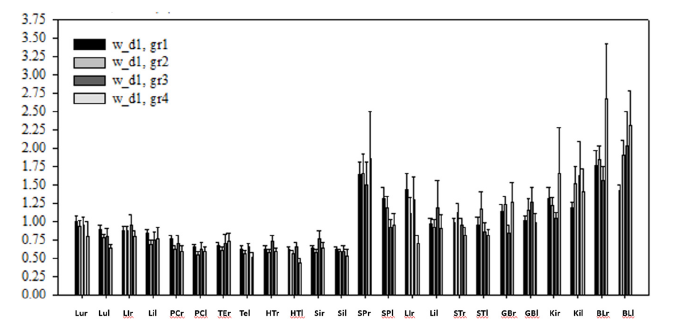
In general, visual dependencies are noted for AC - Lul, SPl and LIr, when the cholesterol level decreases with an increase in TPS. The opposite dependence is noted for AC - BLL, when the increase in TPS of the left branch of this AC most clearly reflects the increase in the cholesterol level in the blood.
The following graphs (Figure 5), show the r / l ratios at the 12 channel level, since this asymmetry coefficient (K), is most sensitive to metabolic disturbances.
Figure 5:12 AC values for the R / L ratio depending on 4 ranges of cholesterol values in women with type 1 diabetes.
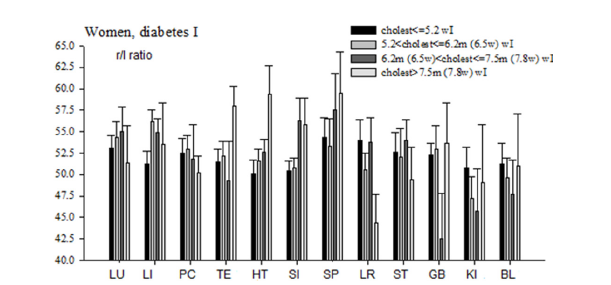
It is noteworthy that in women with type 1 diabetes, for a number of AC, there are close to linear dependencies between the cholesterol level and the TPS of a number of AC. These are the PC, HT, SP channels. At the same time, at maximum cholesterol levels, the values of the asymmetry coefficient generally increase due to the growth of the right branch of these AC, which indicates the predominance of assimilation processes over energy expenditure. At the same time, the spread (deviation) of the TPS values increases, especially for the HT, TE, SP, GB channels. This means that these TPS change synchronously with changes in the cholesterol level. Thus, here we can see the possibility of determining the cholesterol level non-invasively by calculation based on the assessment of the TPS using individual or group regression models or neural networks after their “training”. In women with T2D, the most pronounced visual linear relationships between cholesterol and TPS indices at the level of 24 AC (Figure 6) were noted only in the LR1 and ST1 channels.
Figure 6:Relationships of TPS indices scaled to the average values in 24 channels in women with T2D with cholesterol levels in four ranges of changes.
In women with T2D (Figure 7), a slightly different type of dependence is traced by the r/l ratios than in T1D. In this case, linear dependences are less common and are possible only for the LI, GB and HT channels. The test profile is more homogeneous in contrast to T1D, although for each channel, depending on the cholesterol level, the coefficient values vary greatly. Figure 8 shows a graph of the dependence of the TPS indicators scaled by the average values for 24 channels in men with T2D with cholesterol levels in four ranges of changes.
Figure 7:Indicators of 12 ACs for R / L ratios depending on 4 ranges of cholesterol values in women with type 2 diabetes.
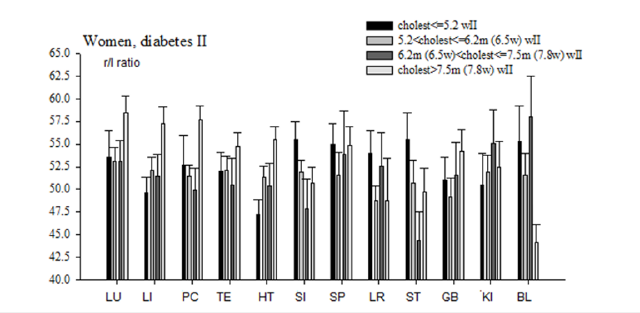
Figure 8:Dependencies of the TPS indicators scaled by the average values for 24 channels in men with T2D with cholesterol levels in four ranges of changes.
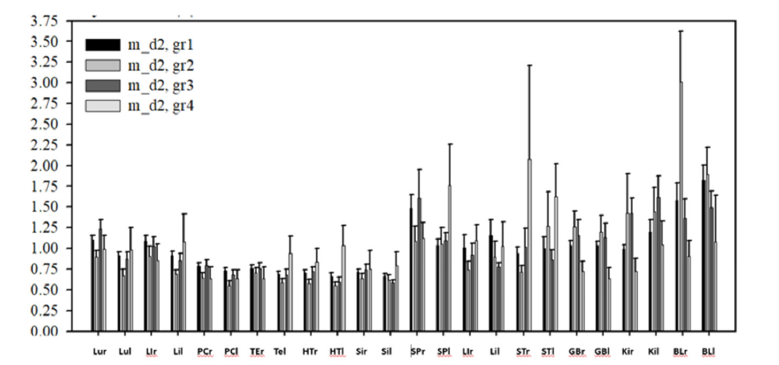
In general, linear dependencies are observed for AK-SPl and STr, when the growth of their TPS reflects the growth of cholesterol. Another dependency is observed for AK BLr and BLl, when the growth of their TPS reflects the decrease in cholesterol.
In men, at the level of the ratio coefficient (K) of the right branch of the AC to the left in type 2 diabetes (Figure 9), there is a virtually linear relationship with the indicators of the TPS channels of the liver and gallbladder, when with an increase in the indicators of the right branch, the level of cholesterol also increases, which is quite logical, since these systems are directly related to its metabolism and synthesis. In general, the reaction of the channels is more diverse, especially to different gradations of cholesterol, for example, according to SP, BL, where high cholesterol values lead to large jumps in the K coefficients. All this indicates that the TPS of these channels, especially, very clearly react to changes in cholesterol in the blood. These conclusions based on the dependency diagrams are confirmed by the data of the correlation analysis with the r / l ratios for 12 channels, presented in Table 2. Thus, in women with type 1 diabetes, there are significant connections with the HT and SI channels, and in type 2 diabetes, there are additional connections with AC- LI and BL. In men with type 2 diabetes, there are no such reliable dependencies at the level of r/l ratios.
Figure 9:12 AC values for R / L ratios depending on 4 ranges of cholesterol values in men with type 2 diabetes.
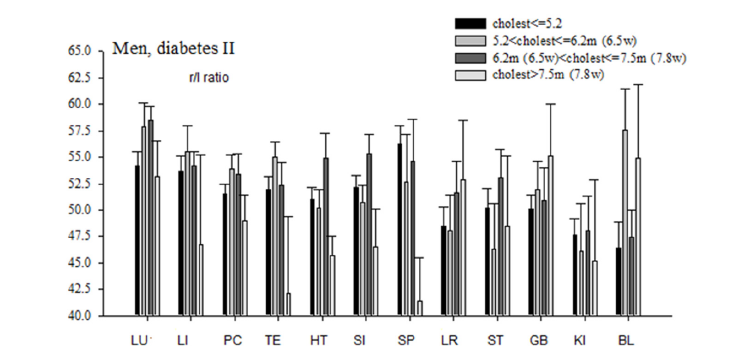
Table 2:Correlations of cholesterol with r / l ratios of 12 channels in type 1 and type 2 diabetes.
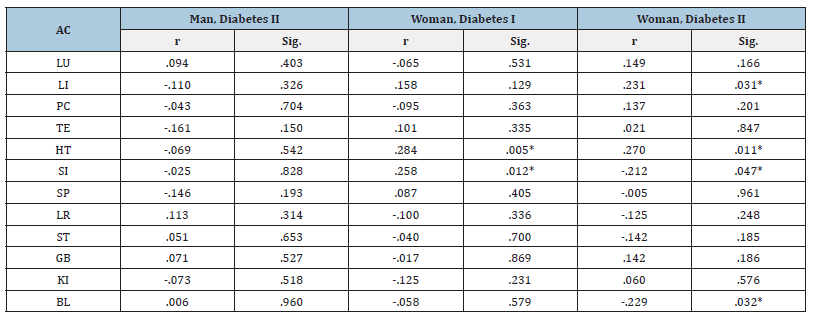
Table 3 presents only significant Pearson correlations and their trends in the links between TPS and cholesterol levels already at the level of 24 branches (right and left separately), with T1-2D in men and women. The greatest links are traced through the LI, PC and ST channels, which generally reflect the dependence of cholesterol on nutrition, physical activity and the body’s microbiota.
Table 3:Significant Correlation and Trends in Cholesterol and 24 Channel Relationships in T1-2D in Men and Women
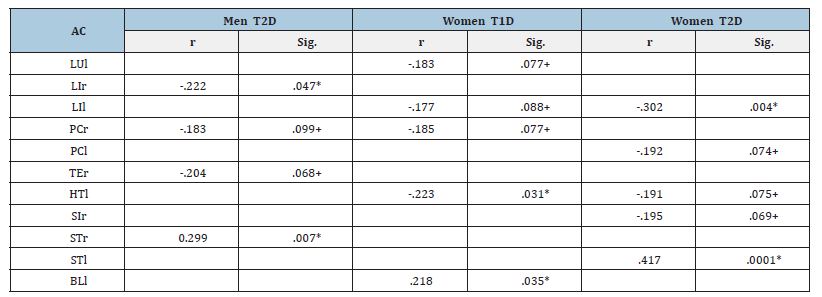
Table 4 presents the results of the ANOVA (T-test, M-W-test) - comparisons between four groups by cholesterol concentration in the blood and paired comparisons between the extreme groups with TPS at the level of 26 and 14 channels: Norm - high cholesterol level.
Table 4:Results of the ANOVA - comparisons between groups and paired comparisons between the extreme groups: Norm - high cholesterol level at the level of 26 and 14 AK with their TPS.
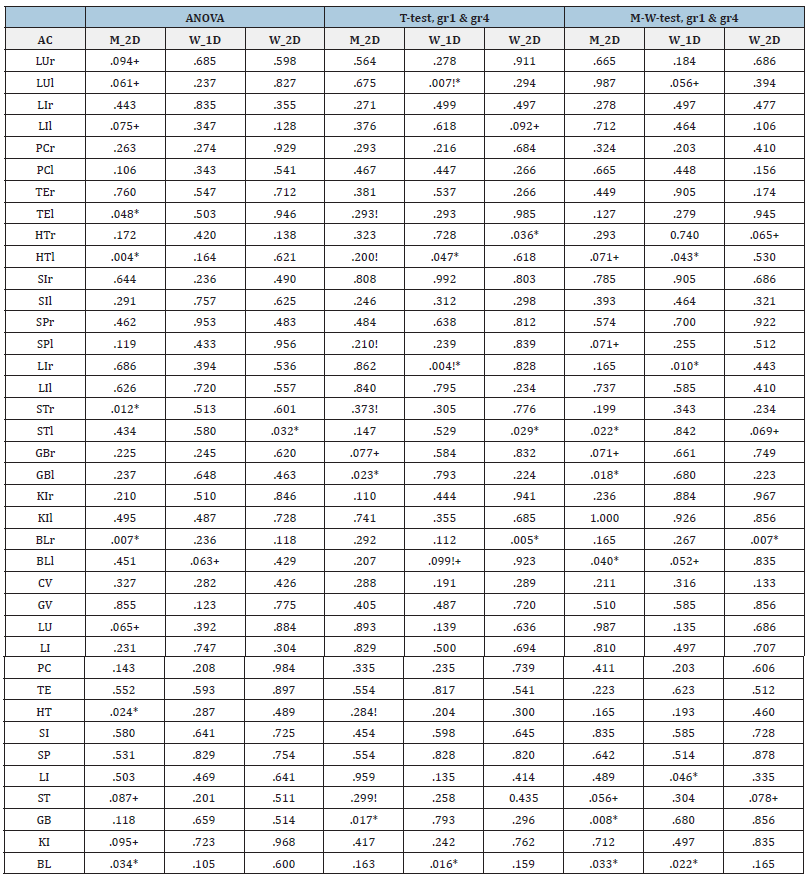
Note: The exclamation mark in this table marks the cases when probabilities related to unequal variances were selected, and the criterion for equal variances gave significance and vice versa.
The significances in the first three columns mostly coincide with the correlations of the TPS and cholesterol levels.
According to the factor analysis using the Extraction Method: Principal Component Analysis, the TPS channels and cholesterol levels in men with T2D, the explained variance was 68.6% and connections were found only with the right branches of the LIr, PCr and TEr channels, reflecting the dependencies on the anabolic processes in these systems. In women with T1D, the factor analysis of dependencies with the TPS channels did not reveal any, and with T2D, connections were found only with the left branch of the gastric channel with an explained variance of 73.3%.
Discussion
The results of the UKPDS (the United Kingdom Prospective Diabetes Study) showed that intensive glycemic control significantly reduces the risk of microvascular complications of diabetes, but does not have a significant effect on macrovascular complications and overall mortality [11,25]. Patients with type 2 diabetes are significantly more likely to develop acute myocardial infarction than individuals without diabetes, and the infarction size is usually larger, complications such as congestive heart failure and cardiogenic shock develop more often, and the long-term prognosis after surgical coronary revascularization is worse. After myocardial infarction, 40-50% of patients with diabetes die within the next five years. Therefore, in diabetes, it becomes extremely important to control lipid metabolism through complex biochemical studies.
However, in practice, such control is quite complicated and requires frequent and very expensive invasive studies, which is a huge obstacle to effective monitoring of these patients.
In this study, possible links of blood cholesterol with certain channels were tested using different types of mathematical tools. In general, there is a repetition of basic dependencies that repeat the current scientific worldview on cholesterol metabolism, taking into account its specific features of regulation in different types of diabetes and in the norm.
Thus, the question posed at the beginning of the study about the relationship of channel activity indicators with blood lipid levels can be answered in the affirmative - such links exist and they can even be linear! This means that by assessing the thresholds of the TPS of a number of ACs, it is possible to control the level of certain lipids in the blood non-invasively, by a calculation method, and thus carry out their easy non-invasive monitoring on new principles. Thus, the system of acupuncture channels is a real information system with which you can obtain information about the functional activity of various organs and systems of the body, as well as about the most important biochemical processes in it (moikn!!). At the same time, this method can track the entire chain of cholesterol metabolism at the level of certain organs and systems, starting from its synthesis and ending with its destruction with a quantitative assessment of the contribution of each organ. This in turn allows creating a balanced equation, for example, by the method of regression of its metabolism both at the group level (norm, T1-2D) and at the individual level, after a series of “training measurements” on special non-invasive equipment.
In this regard, we attempted to solve this problem using other principles described in this article and received the first positive result. As the results of this study show, the AC system in the thresholds of their temperature sensitivity really reflects the level of Cholesterol in the blood and is able to identify those organs and systems that are really involved in fat metabolism, which gives grounds for its active use in monitoring patients with diabetes, as well as for targeted correction of these disorders.
The basis for our solution was the ancient Akabane test with the assessment of TPS in certain diagnostic BAPs, which were determined in practice hundreds of years ago and have shown their informativeness in modern medicine for assessing the activity of various organs and systems through AC [25-27]. In fact, there are many normally symmetrical cluster structures on the human body at the AC level that determine the activity of various organs and systems with vertices in the form of BAPs, the TPS of which reflects the functional activity of various organs and systems [17,28]. In this case, the left and right BAPs at the AC level of each organ reflect the functional activity of the opposite regulatory subsystems. For example, at the AC оf the pancreas, the TPS of the right point reflects the activity of B-cells that produce insulin and reduce the level of glycemia, and the left one reflects the activity of A-cells that produce counter-insular hormone that increases the level of glycemia, which is important for glycemia control in diabetes mellitus [17,29]. In this case, the violation of the symmetry of the TPS at these points from different sides reflects a violation of glucose regulation in the form of hypo or hyperglycemia. All this makes the AC system a unique source of obtaining medical information and lays down new principles of non-invasive control of glycemia, as well as dyslipidemia, as its consequence. This principle is very similar to the principle of assessing a person’s personality based on biometric systems, where 7 main reference points on the face are used - the distance between the pupils, nose, corners of the mouth and their relationships (Figure 10). Then, these indicators are compared with databases using neural networks and AI to identify analogues and establish a person’s identity.
Figure 10:Biometric principle of personal recognition.
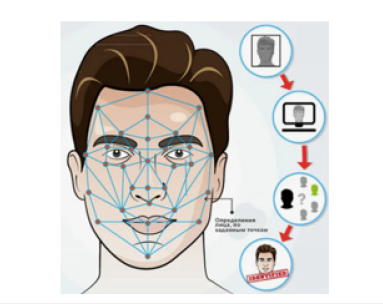
This system provides an accuracy of assessment on neural networks of 97-98%. In our assessment, 26 reference points are used (Figure 1), with the TPS, which, unlike the points on the face, can change, which reflects the different activity of the organs associated with them, but these changes are synchronized with the changes in all other TPS, which are part of this ensemble of clusters from certain AC. Thus, for example, after the “training sample” it is possible to assess various biochemical indicators with an acceptable accuracy [30], suitable, for example, for non-invasive home monitoring. At the same time, the AC system acts as a translator of information from the human body, since through it is possible for the first time and effectively to assess the violation of symmetry in the body by the imbalance of the right and left TPS in the diagnostic BAPs of certain AK, as a fundamental factor in the development of pathology [23,24]. This is the innovative essence of this approach, since the violation of symmetry at the level of individual organs and systems, except at the level of paired acupuncture channels, cannot be assessed.
However, in practice, the use of this system is quite laborintensive and requires additional knowledge in interpreting the results. Therefore, we are currently developing a pulse diagnostics system, where all information about the AC and their TPS is extracted from the pulse wave in the dynamics of observation [31]. This innovative approach to creating a new source of medical information from the pulse wave gives hope for creating a whole class of devices operating on a new principle of obtaining a wide variety of medical information from the pulse wave, including fat metabolism, in a simple and convenient non-invasive way for millions of users in real time. Such a monitoring system, for example at the Smartphone level, can be extremely relevant, due to the high social significance of this problem, since the lives of millions of patients suffering from diabetes depend on monitoring cholesterol levels.
Conclusion
The AC system at the TPS level of certain channels actually reflects changes in the concentration of сholesterol in the blood, which allows it to be used as a new non-invasive source of obtaining information on fat metabolism, including diabetes.
Disclosure Statement
The authors declare that they have no conflicts of interest and no financial interests related to the material of this manuscript.
References
- Krauss RM (2004) Lipids and lipoproteins in patients with type 2 diabetes. Diabetes Care 27(6): 1496-1504.
- Brunzell JD, Davidson M, Furberg CD, Goldberg RB, Howard BV, et al. (2008) Lipoprotein management in patients with cardiometabolic risk: Consensus statement from the American Diabetes Association and the American College of Cardiology Foundation. Diabetes Care 31(4): 811-822.
- Lavrenova EA, Drapkina OM (2020) Insulin resistance in obesity: Pathogenesis and effects. Obesity and Metabolism 17(1): 48-55.
- Vergès B (2015) Pathophysiology of diabetic dyslipidaemia: where are we? Diabetologia 58(5): 886-899.
- Albers JJ, Marcovina SM, Imperatore G, Snively BM, Stafford J, et al. (2008) Prevalence and determinants of elevated apolipoprotein B and dense low-density lipoprotein in youths with type 1 and type 2 diabetes. J Clin Endocrinol Metab 93(3): 735-742.
- St-Pierre AC, Cantin B, Dagenais GR, Mauriege P, Bernard PM, et al. (2005) Low-density lipoprotein subfractions and the long-term risk of ischemic heart disease in men: 13-year follow-up data from the Québec Cardiovascular Study. Arterioscler Thromb Vasc Biol 25(3): 553-559.
- Contois JH, McConnell JP, Sethi AA, Csako G, Devaraj S, et al. (2009) Apolipoprotein B and cardiovascular disease risk: position statement from the AACC Lipoproteins and Vascular Diseases Division Working Group on Best Practices. Clin Chem 55(3): 407-419.
- Liu J, Sempos CT, Donahue RP, Dorn J, Trevisan M, et al. (2006) Non-high-density lipoprotein and very-low-density lipoprotein cholesterol and their risk predictive values in coronary heart disease. Am J Cardiol 98(10): 1363-1368.
- Hwang YC, Ahn HY, Park SW, Park CY (2014) Association of HDL-C and apolipoprotein A-I with the risk of type 2 diabetes in subjects with impaired fasting glucose. Eur J Endocrinol 171(1):137-142.
- Stevens RJ, Kothari V, Adler AI, Stratton IM (2001) The UKPDS risk engine: A model for the risk of coronary heart disease in type II diabetes (UKPDS 56). Clin Sci (Lond)101(6): 671-679.
- Berliner JA, Navab M, Fogelman AM, Frank JS, Demer LL, et al. (1995) Atherosclerosis: Basic mechanisms, oxidation, inflammations and genetics. Circulation 91(9): 2488-2496.
- Austin MA, King MC, Vranizan KM, Krauss RM (1990) Atherogenic lipoprotein phenotype: A proposed genetic marker for coronary heart disease risk. Circulation 82(2): 495-506.
- Austin MA, Breslow JL, Hennekens CH, Buring JE, Willet WC, et al. (1988) Low-density lipoprotein subclass patterns and risk of myocardial infarction. JAMA 260(13): 1917-1921.
- Muzhikov V, Vershinina E, Belenky V, Muzhikov R (2016) Significant heat sensitivity increase detected in various types of diabetes mellitus patients by Akabane test for use of management of diabetic patients. Acupunct Electrother Res 41(1): 1-19.
- Muzhikov V, Vershinina E, Muzhikov R (2017) System of thermopuncture diagnostics and monitoring of patients with Type 1 diabetes. J Altern Complement Integr Med 3: 2-7.
- Muzhikov V, Vershinina E, Muzhikov R (2018) Opportunities of the akabane test for diagnosis and monitoring of patients with type 2 diabetes. Journal of Diabetes and Metabolism 9: 2.
- Muzhikov VG (2022) Akabane test, theory and practice of thermopuncture diagnostics and correction. BP International, p. 395.
- (1956) Akabane K. Method Oi Hinaishin. Tokyo, Japan.
- Muzhikov VG (2000) Theory and practice of the thermal acupuncture channel diagnostics and treatment. St. Petersburg: “Petrovsky Fund”.
- Muzhikov V (2003) Introduction to the energoskopia of man. Gopher Publishers, p.412.
- Muzhikov VG, Nozdrachev AD, Bogdanov NN (2005) Discrete Thermopuncture Test. Report 1. Reflexology 4(15): 23-28.
- Muzhikov V, Muzhikov R, Nikitin K (2024) Akabane test-its capabilities and real application in traditional and modern medicine. Journal of Experimental and Clinical Application of Chinese Medicine 5(3): 52-70.
- Muzhikov V, Vershinina E, Muzhikov R (2021) Possibilities of the akabane test to monitor excess body mass index and control its transformation into type 2 diabetes. Biomedical Journal of Scientific & Technical Research 33(3).
- Muzhikov V, Vershinina E, Belenky V, Muzhikov R (2018) Assessing the links between anthropometrics data and Akabane test results. Journal of Acupuncture and Meridian Studies 11(1): 31-38.
- Maahs D, West NA, Lawrence JM, Mayer-Davis EJ (2010) Epidemiology of type 1 diabetes. Endocrinology and Metabolism Clinics of North America 39(3): 481-497.
- Muzhikov V (2020) Patent RU N 2198600 " The way of estimation and forecasting organism condition".
- Muzhikov V (2002) German Patent 199 83 992 “Method for Determining Blood Indexes and Device for it Embodying” European Patent and Trademark Attorneys, N12.
- Muzhikov V, Vershinina E, Muzhikov R, Nikitin K (2019) The method of individual assessment of the action of insulin and its adequate dose in diabetes mellitus. World Journal of Pharmaceutical Research 8(7): 176-205.
- Muzhikov V, Vershinina E, Muzhikov R (2021) Principles of Individual Quantitative Assessment of the Effect of Drugs in Diabetes According to the Akabane Test. Int J Pharmacogn &Chinese Med 5(1): 000213.
- Muzhikov V, Vershinina E, Muzhikov R (2020) Possibilities of the akabane test and cosinor analysis to predict the level of glycemia and the individual selection of drugs and their doses in the treatment of diabetes. Biomedical Journal of Scientific& Technical Research 29(3): 502-509.
- Muzhikov V (2020) Patent RU N 2746036, Application filing date 08/11/2020 “A method for quantifying the activity of acupuncture channels, system and module for its implementation”.
© 2025 Valery Muzhikov. This is an open access article distributed under the terms of the Creative Commons Attribution License , which permits unrestricted use, distribution, and build upon your work non-commercially.
 a Creative Commons Attribution 4.0 International License. Based on a work at www.crimsonpublishers.com.
Best viewed in


.jpg)


 Editorial Board Registrations
 Submit your Article
 Refer a Friend
 Advertise With Us
.jpg)


.jpg)


.bmp)
.jpg)
.png)
.jpg)


.jpg)


.png)

.png)


.png)


