

- About Us
- Information
-

The Author ensures that the research has been conducted responsibly and ethically with adherence to all relevant regulations. read more..
- For Authors
- For Reviewer
- Manuscript Guidelines
- Membership
- Publication Ethics
-
- Journals
- Reprints
- e-Books
- Videos
- Policies
- Contact Us
 COVID-19
- Submissions



Full Text
Research & Development in Material Science
An Experimental Investigation on the Cracking and Ultimate Behaviour of Reinforced Concrete Beam with Cutout
Kumar NS
1 Principal, Ghousia College of Engineering, Ramanagaram, India
2 Assistant Manager, Civil D&E, Jakson & Green Limited, Bangalore, India
3 Assistant Professor, Department of Civil Engineering, Dr Ambedkar college of engineering, India
4 Research Scholar, Department of Civil Engineering, B.M.S College of engineering, India
5 Assistant Professor, Department of Civil Engineering, Ghousia College of Engineering, Ramanagaram, India
*Corresponding author:Chethan Kumar S, Assistant Manager, Civil D&E, Jakson & Green Limited, Bangalore, Karnataka, India Sandesh NU, Research Scholar, Department of Civil Engineering, B.M.S College of engineering, Bangalore-19, Affiliated to VTU, Belagavi, Karnataka, India
Submission: July 06, 2026;Published: July 16, 2026

ISSN: 2576-8840 Volume 23 Issue 1
Abstract
The performance of precision equipment on rectangular beam elements is crucial, especially in the presence of cutouts. The IS-456 standard lacks coefficients for bending moments and shear forces; therefore, experimental investigations are necessary to understand the behavior of structural elements under different edge conditions, both with and without cutouts. This study experimentally investigates the performance of rectangular beam components under various boundary conditions and presents its findings. In this research, two rigid beams were examined, along with a rectangular beam that was tested at a distance of L/3 from its support. The beam under analysis measured 230 millimeters by 100 millimeters. The results revealed that the mid-span deflection for the beam with a cutout was 39.25% greater than that of the beam without a cutout. Additionally, the induced strain was 6.98% higher in the beam with a cutout compared to the one without. The compression values of the web face strain were 0.00021mm, while the tension values were 0.00070mm in the section with the cutout, under a load of 50.3KN. Furthermore, the solid beam with a cutout exhibited a 40% increase in crack width propagation compared to the solid beam without a cutout. FEM results were compared with experimental values.
Keywords: Beam; Structural element; Cutout; Deflection; Strain; Compression; Tension; Crack; FEM
Introduction
Transverse openings in reinforced concrete beams allow utility lines to pass through the structure, reducing structure height and cost [1,2]. However, sudden changes in beam dimensions can cause stress concentration, cracks, and reduced stiffness, leading to deformation and excessive deflection under load [3,4]. Current codes do not include provisions for beam design with openings [5,6]. Utility pipes and ducts are essential for building services like air-conditioning, power supply, telephone lines, computer networks, fire fighting, water supply, and wastewater pipes [5,6]. To reduce headroom and provide a compact design, they are often passed through floor beam openings, with circular openings used for electricity cables and rectangular openings for air-conditioning services [7,8]. Openings in reinforced concrete beams cause issues like reduced stiffness, excessive cracking, deflection, and capacity, leading to high stress concentration at opening corners and complex beam behavior [9,10]. Services and structural engineers collaborate to ensure proper decisions are made to prevent damage to concrete beams by openings for service lines [11,12]. M.A. Mansur et al. discuss the analysis and design of reinforced concrete beams with transverse openings and combined bending and shear [13,14]. It differentiates between circular and large rectangular openings, discusses drilling situations, and considers beams with multiple openings [15-17]. The paper also highlights the simplified design method for large rectangular openings [18,19]. Park, et al. conducted tests on composite beams with web openings, examining the impact of slab width and moment-shear ratio on failure mode and strength [20,21]. They developed a strength model based on test results, estimating maximum shear capacity and calculating the shear contribution of the concrete slab [22-24].
The model was found to be easy to use and satisfactory [25,26]. Vancouver, B.C. et al. A study in Vancouver examined the impact of small circular openings on the shear, flexural, and ultimate strength of beams made from normal and high-strength concrete [27]. The study found that when the opening diameter exceeded 1.3, ultimate strength decreased, and cracking patterns and failure modes changed [28]. Diagonal shear reinforcement was recommended to control cracks and restrain width [29]. The results were compared with codes to understand the effects of concrete strength on these parameters [30]. Zhang et al. experimental study on crack closure and its impact on beam vibration reveal a significant influence on frequency and damping changes and explore non-linearity [31]. The findings could aid in detecting crack damage and modeling crack closure mechanisms [32]. Richard G et al. The ultimate strength of a composite beam with ribbed slab and steel section is determined, considering shearing force and partial shear connection. The theory agrees with tests and other theories, but caution is advised for cases with differing parameters [32].
Material Properties
Cement
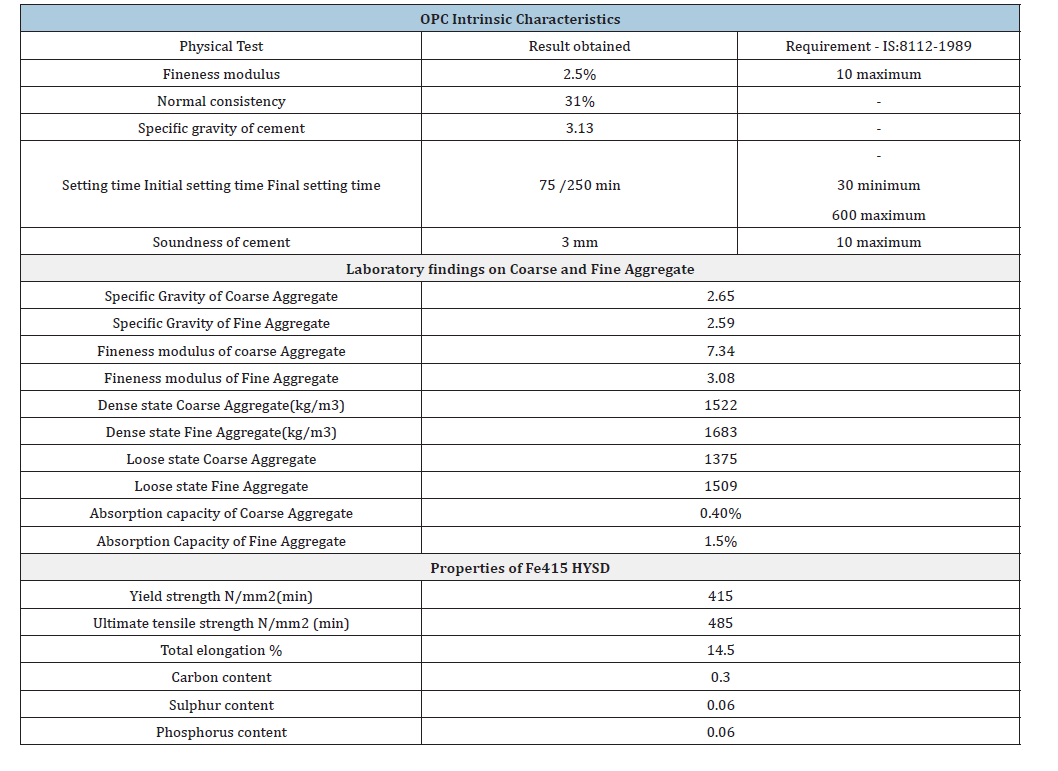
OPC 43 grades are commonly used in construction works, meeting Indian standard Specification IS: 8112-1989 and IS: 4031- 1991 requirements, with physical properties outlined in Table 1.
Aggregates
The properties of the coarse aggregate are tested as per IS 2386-part III. The results obtained are shown in the Table 1. The properties of fine aggregates are determined by conducting tests as per IS: 2386-Part I. Laboratory findings obtained are as shown in Table 1.
Table 1:OPC Intrinsic Characteristics, Laboratory findings on Coarse, Fine Aggregate and Properties of Fe415 HYSD
Water
Potable water, free from harmful salts, is crucial for the chemical reaction in cement, as it is required for mixing and curing the concrete mass.
Steel
The project utilized Fe415HYSD Steel bar conforming to IS 1786 for its entire construction. The chemical composition and mechanical properties are summarized in the Table 1.
Strain gauge
A strain gauge is a device invented by Simmons and Rugein in 1938. It measures strain on an object by attaching a flexible backing to a metallic foil pattern. The gauge’s resistance change, measured using a Wheatstone bridge, is related to the strain by the gauge factor.
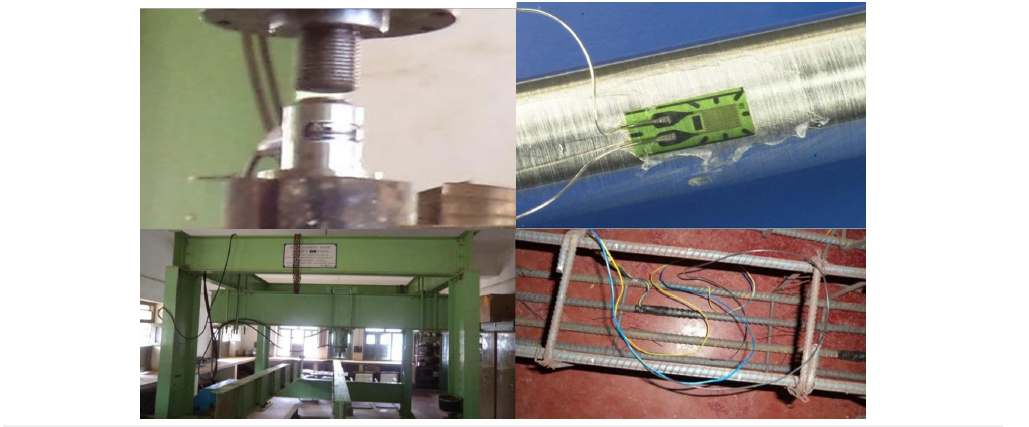
The gauge uses electrical conductance and its dependence on the conductor’s geometry to determine applied stress. A typical strain gauge uses a zigzag pattern of parallel lines, resulting in a larger strain measurement as shown in Figure 1.
Figure 1:Experimental setup.
Load cell
A load cell transducer converts force into an electrical signal through a mechanical arrangement. The force sensed deforms a strain gauge, which measures the deformation as an electrical signal. Load cells can have one strain gauge (Quarter Bridge) or two strain gauges (half bridge). The electrical signal output is typically a few milli volts and requires simplification by an instrumentation amplifier. Strain gauge load cells are common in industry due to their stiffness, good resonance values, and long life cycles as shown in Figure 1.
Methodology
Techniques used
The loading jack was calibrated using load cells with digital display units, and materials were tested according to codes and mix proportions. Reinforcement and digital strain gauges were installed, and a rectangular beam element was cast for 7 days to avoid shrinkage and creep effects.
The loaded structure with their configurations
A loading frame is a steel structure designed for testing structural elements like beams, columns, slabs, and portal frames. It has a loading range of 10, 20, 50, and 100 tons and is self-straining, transferring no load to the ground except the frame’s weight. The frame can handle vertical and horizontal loads, allowing for testing major structural elements and stimulating wind loads as shown in Figure 1. The frame is made from standard rolled sections for strength and self-straining skeletons. It can withstand vertical and horizontal loads, suitable for testing structural elements like beams and columns. The frame consists of top rectangular frame, bottom longitudinal girder, columns, upper and lower cross beams, and require loading arrangement, hydraulic jack, load cells, digital load indicators, and displacement transducers.
The strain gauge’s connection to the electronic strain measure
Functioning of a quarter bridging: The active strain gauge is connected to A, B, and Cash, while the dummy gauge is connected to B and D using a three-lead wire method as shown in Figure 1.
Gauge factor configurations: The strain gauge’s gauge factor is set by the manufacturer and controlled by GF control, ensuring accurate readings on the main dial and Vernier.
Testing methods
This study tested two beams, one solid and one with a rectangular opening. Deformations were measured at a load interval of 10KN using a load cell and dial gauges. The strain readings were recorded using a digital indicator connected to a steel reinforcement gauge. The strain at the center of the beam was measured using a Demec gauge, and crack widths were measured using a Brinell’s microscope. This study tested two solid beams and a rectangular beam with a 230mm×100mm opening, both casted and tested at a distance of L/3 from the support.
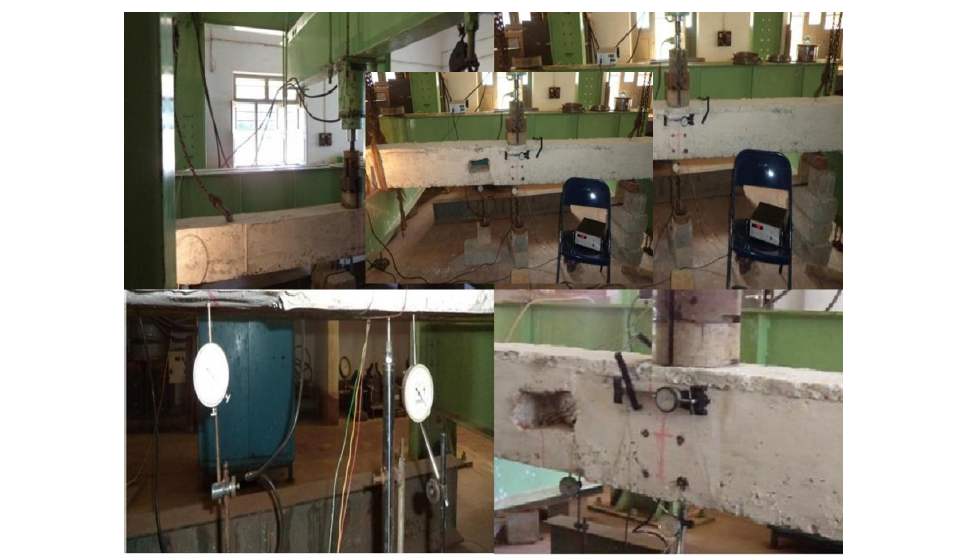
Beams’ evaluating approach: The testing of two beams was conducted after a 7-day curing period and 28th days testing period. Both beams were manually moved over rollers and tested for failure using a loading frame jack and load cell system. Both beams were instrumented to measure applied loads, deflections, crack widths, and steel strain as shown in Figure 2.
Figure 2:Clockwise: beam, with cutout, dial gauge and sensor and Demec gauge arrangements.
Results and Discussions
Deflection measurements
Figure 3:Without cutout (left) & with cutout (right).
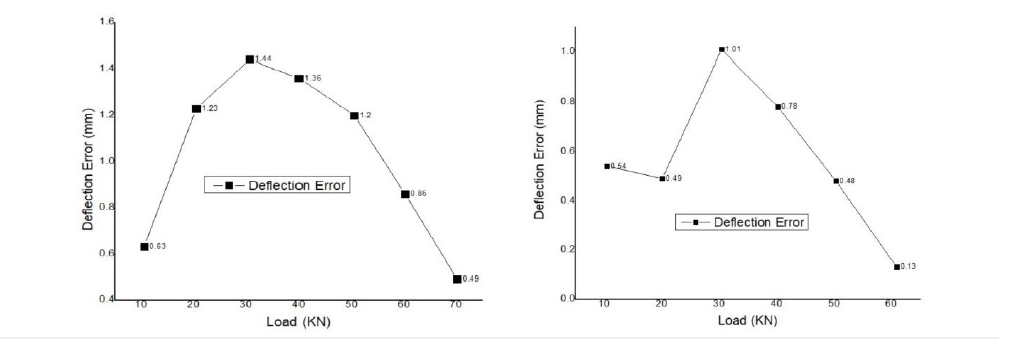
The deviations of deflection error of solid beam without cutout were shown on Figure 3 (left) and observed that the relationship between the load and deflection error is nonlinear in nature. The highest deflection error is noticed against the load of 30.7KN as 1.44mm. Whereas the lowest deflection error is noticed against the load of 70.2KN as 0.49mm. The other deflection error values against the loads of 10.5KN, 20.5KN, 40KN, 50.5KN 60.2KN are 0.63mm, 1.23mm, 1.36mm, 1.2mm and 0.86mm respectively. The deviation of deflections error of solid beam with cutout has shown on Figure 3 (right) and observed that the relationship between the load and deflection error is nonlinear in nature. The highest deflection error is noticed against the load of 30.4KN as 1.01mm. Whereas the lowest deflection error is noticed against the load of 60.9KN as 0.13mm. whereas the lowest deflection is noticed against the load of 70.2KN as 0.49mm. The other deflection errors against the loads of 10.5KN, 20.1KN, 40.2KN, and 50.3KN are 0.54mm, 0.49mm, 0.78mm and 0.48mm respectively.
Deflection measurements (L/3) span
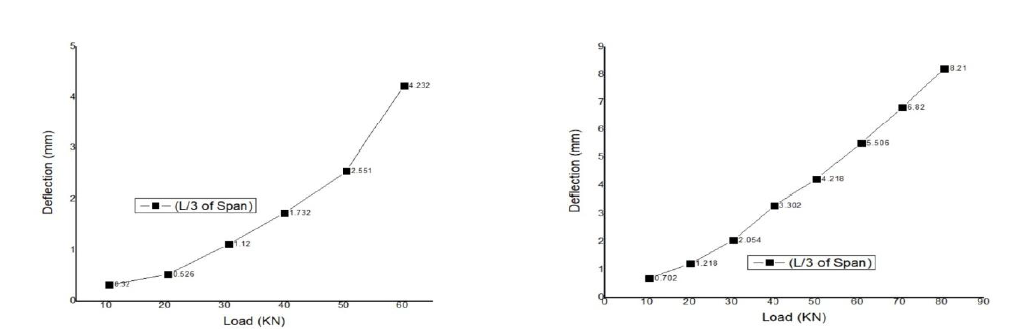
The deviations of deflection error of solid beam without cutout at a span of (L/3) mm have shown on Figure 4 (left) and observed that the relationship between the load and deflection error is linear in nature. The highest deflection error is noticed against the load of 60.2KN as 4.23mm. Whereas the lowest deflection error is noticed against the load of 10.5KN as 0.32mm. The other deflection error values against the loads of 20.5KN, 30.7KN, 40KN, and 50.5KN are 0.52mm, 1.12mm, 1.732mm and 2.551mm respectively. The deviations of deflection error of solid beam with cutout at a span of (L/3) mm have shown on Figure 4 (right) and observed that the relationship between the load and deflection error is linear in nature. The highest deflection error is noticed against the load of 80.6KN as 8.21mm. Whereas the lowest deflection error is noticed against the load of 60.9KN as 0.13mm. whereas the lowest deflection is noticed against the load of 10.5KN as 0.702mm. The other deflection error values against the loads of 10.5KN, 20.1KN, 30.4KN, 40.2KN, 50.3KN, 60.9KN and 70.6KN are 1.218mm, 2.054mm, 3.302mm, 4.218mm, 5.506 and 6.82mm respectively.
Figure 4:Without cutout (L/3) of span (left) without cutout (L/3) of span (right).
Strain measurement with strain gauge
Figure 5:(a) Without cutout. (b) With cutout.
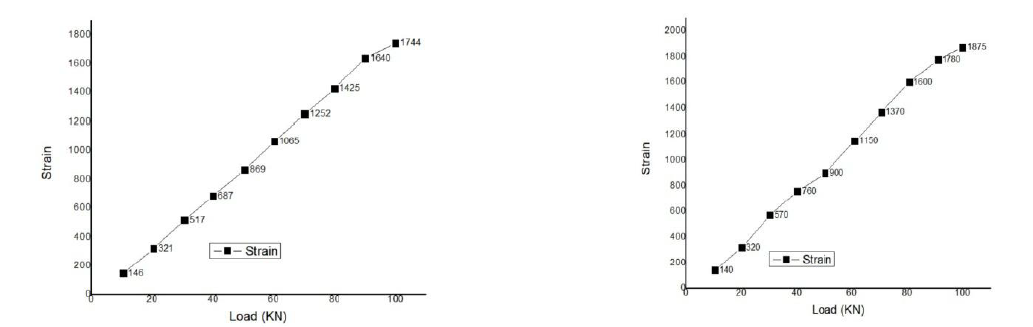
The deviations of strain measured with strain gauge of solid beam without cutout have shown on Figure 5(a) and observed that the relationship between the load and strain is linear in nature. The highest strain is noticed against the load of 100KN as 1744. Whereas the lowest strain is noticed against the load of 10.5KN as 146. The other strain values against the loads of 20.5KN, 30.7KN, 40KN, and 50.5KN, 60.2KN, 70.2KN, 80KN, 90KN are 321, 517, 687, 869, 1150, 1370, 1600 and1780 respectively. The deviations of strain measured with strain gauge of solid beam with cutout have shown on Figure 5(b) and observed that the relationship between the load and strain is linear in nature. The highest strain is noticed against the load of 100KN as 1875. Whereas the lowest strain is noticed against the load of 10.5KN as 140. The other strain values against the loads of 20.1KN, 30.4KN, 40.2KN, and 50.3KN, 60.9KN, 70.6KN, 80.6KN, 90.9KN are 320, 570, 760, 900, 1150, 1370, 1600 and 1780 respectively.
Web face strain
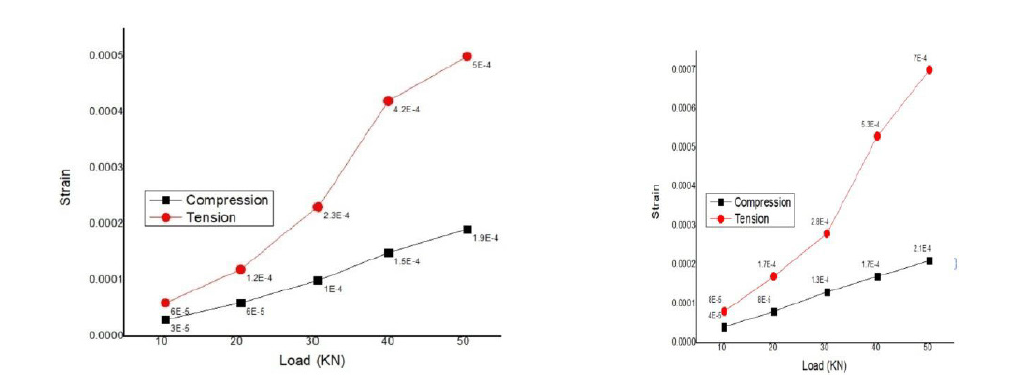
The deviations of web face strain measured with Demec gauge of solid beam without cutout have shown on Figure 6 (a). From Figure 6(a) it is observed that the relationship between the load and web face strain is linear in nature under tension and compression. The highest web face strain value under compression zone against highest load of 50.5KN is 0.00019, whereas the lowest web face strain value under compression zone against highest load of 10.5KN is 0.00003. From Figure 6(a) the highest web face strain value under tension zone against highest load of 50.5KN is 0.00050, whereas the lowest web face strain value under compression zone against highest load of 10.5KN is 0.00060. The deviations of web face strain measured with Demec gauge of solid beam with cutout have shown on Figure 6(b). From Figure 6(b) it is observed that the relationship between the load and web face strain is linear in nature under tension and compression. The highest web face strain value under compression zone against highest load of 50.3KN is 0.00021, whereas the lowest web face strain value under compression zone against highest load of 10.5KN is 0.00004. From Figure 6(b) the highest web face strain value under tension zone against highest load of 50.5KN is 0.00070, whereas the lowest web face strain value under compression zone against highest load of 10.5KN is 0.00080.
Figure 6:(a) Without cutout. (b) With cutout.
Investigation of cracks
Figure 7:(a) Without cutout. (b) With cutout.
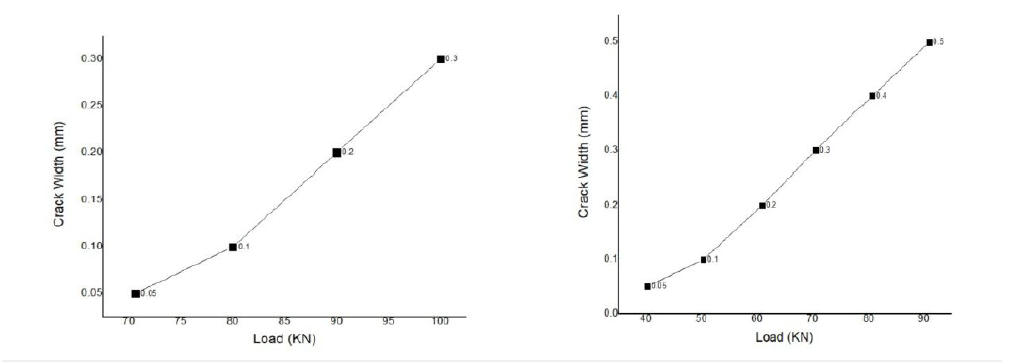
The deviations of crack width of solid beam without cutout have shown on Figure 7(a). From Figure 7(a) it is observed that the relationship between the load and crack width of solid beam is linear in nature. The highest crack width value against highest load of 100KN is 0.3mm. whereas the lowest crack width value against lowest load of 70.6KN is 0.05. The deviations of crack width of solid beam with cutout have shown on Figure 7(b). From Figure 7(b) it is observed that the relationship between the load and crack width of solid beam is linear in nature. The highest crack width value against highest load of 90.9KN is 0.3mm. whereas the lowest crack width value against lowest load of 40.2KN is 0.05.
FEM approach
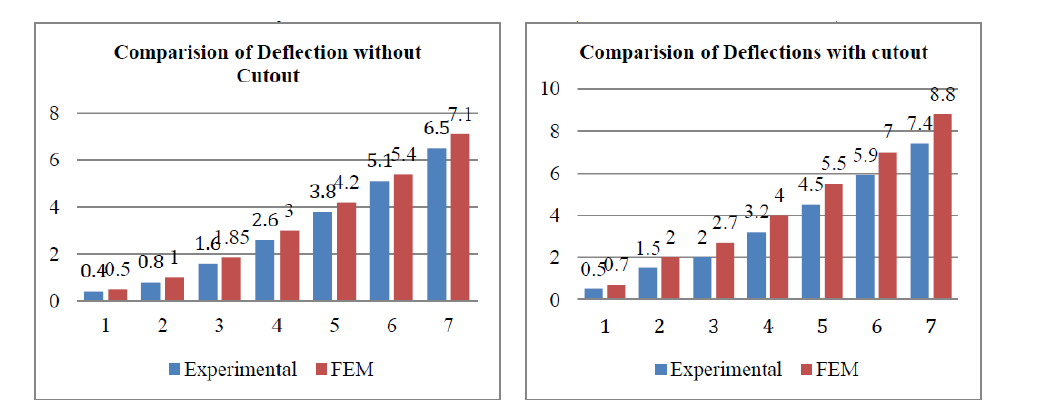
The RCC beam is a complex structural component influenced by concrete and steel’s mechanical and geometrical characteristics, along with the heterogeneous properties between them. Experimental results are crucial for characterization, but laboratory tests are challenging. Computer tools and numerical models have reduced characterization difficulties and costs, but their accuracy depends on experimental information. These tools can simulate and extrapolate results with less time and expense. Refereeing to Figures 8(a) & (b) has shown that deflection values were more than the experimental values in both the cases (without cutout and with cutout).
Figure 8:(a) Without cutout. (b) With cutout.
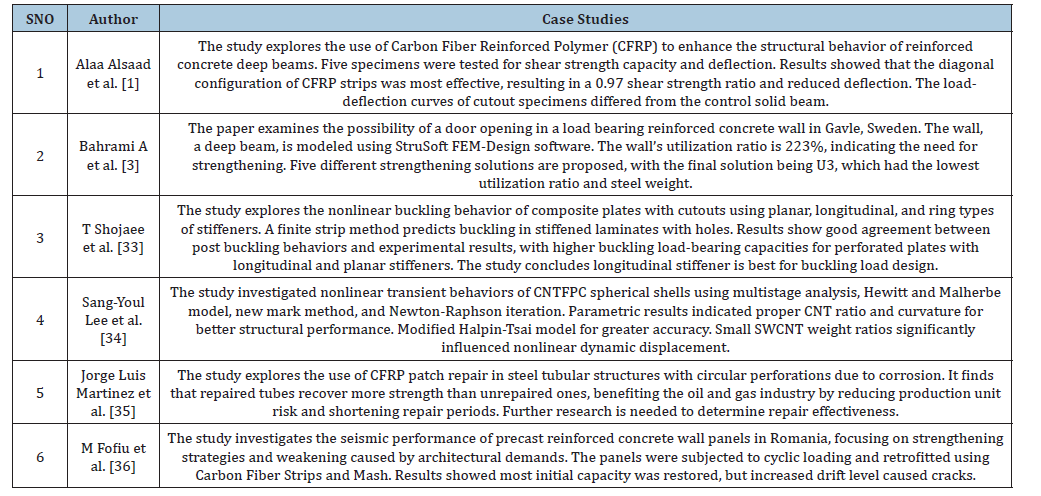
Case Studies
Conclusion
The study found that un-strengthened beams with large openings at flexure locations resulted in excessive flexural cracks and failure modes in flexure. The inclusion of large openings in RC beams decreased beam strength and stiffness, but increased deflection by 30%. Drilling openings near existing beam support regions could seriously impair structure safety and serviceability. The strain contour fluctuates with openings, with strain in the bottom chord being more than the top chord. Preplanned service systems and proper opening sizes and locations can ensure adequate strength and serviceability. Early cracking in existing beams reduces load carrying capacity, highlighting the importance of careful design and safety measures. The load under which the first flexural crack is induced doesn’t depend on the presence or absence of an opening. Shear cracks around the opening are sooner in reinforced bars than in solid beams. The strain inside reinforced bars are similar at lower loadings. However, if the opening depth exceeds 1/3 of the beam, the strength increases before and after cracks. The results of the FEM study closely align with experimental values, indicating the impact of opening the beam through the web face.
Conflict of Interest
The authors declare that they have no conflict of interest.
References
- Alaa Alsaad, Sulaiman A, Mohammed JA (2016) Using CFRP for enhancing of circular cutout in high strength RC deep beam. GSTF Journal of Engineering Technology 3(3).
- Alsaad A, Sulaiman A, Mohammed JA (2015) Enhancement of circular cutout in high strength RC deep beam using CFRP. 3rd Annual International Conference on Architecture and Civil Engineering (ACE 2015).
- Bahrami A, Ågren F, Kollberg K (2021) Strengthening solutions for deep reinforced concrete beam with cutout opening. Buildings 11(8): 370.
- Campione G, Minafò G (2012) Behaviour of concrete deep beams with openings and low shear span-to-depth ratio. Engineering Structures 41: 294-306.
- Cristian Sabau, Popescu C, Bagge N, Sas G, Blanksvärd T, et al. (2019) Local and global behavior of walls with cut-out openings in multi-story reinforced concrete buildings. Engineering Structures 187: 57-72.
- Cristian S, Popescu C, Sas G, Blanksvärd T, Björn T (2018) Axially loaded RC walls with cutout openings strengthened with FRCM composites. Journal of Composites for Construction 22(6).
- Doh JH, Fragomeni S (2005) Evaluation of experimental work on concrete walls in one and two-way action. Australian Journal of Structural Engineering 6(1): 37-52.
- Doh JH, Fragomeni S (2006) Ultimate load formula for reinforced concrete wall panels with openings. Advances in Structural Engineering 9(1): 103-115.
- Floruţ SC, Sas G, Popescu C, Stoian V (2014) Tests on reinforced concrete slabs with cut-out openings strengthened with fibre-reinforced polymers. Composites Part B: Engineering 66: 484-493.
- Guan H, Cooper C, Lee DJ (2010) Ultimate strength analysis of normal and high strength concrete wall panels with varying opening configurations. Engineering Structures 32(5): 1341-1355.
- Jasim WA, Tahnat YBA, Halahla AM (2020) Behavior of reinforced concrete deep beam with web openings strengthened with (CFRP) sheet. Structures 26: 785-800.
- Khalaf MR, Al-Ahmed AHA (2020) Shear strength of reinforced concrete deep beams with large openings strengthened by external prestressed strands. Structures 28: 1060-1076.
- Kong FK, Sharp GR (1977) Structural idealization for deep beams with web openings. Magazine of Concrete Research 29(99): 81-91.
- Kumari A, Nayak AN (2020) An experimental approach for strengthening of RC deep beams with web openings using GFRP fabrics and gas actuated fasteners. Journal of Building Engineering 35: 102027-102027.
- Luo P, Zhang Q, Bao Y, Bu Y (2019) Fatigue performance of welded joint between thickened-edge U-rib and deck in orthotropic steel deck. Engineering Structures 181: 699-710.
- Martinez JL, Cyrino JCR, Vaz MA, Hernández ID, Torres VD, et al. (2023) CFRP repair effectiveness on compressed steel tubular members with circular cutout. Latin American Journal of Solids and Structures 20(2).
- Massone LM, MuñozG, Rojas F (2019) Experimental and numerical cyclic response of RC walls with openings. Engineering Structures 178: 318-330.
- Mohamed A, Shoukry MS, Saeed JM (2014) Prediction of the behavior of reinforced concrete deep beams with web openings using the finite element method. Alexandria Engineering Journal 53(2): 329-339.
- Mohammed BS, Ean LW, Malek MA (2013) One way RC wall panels with openings strengthened with CFRP. Construction and Building Materials 40: 575-583.
- Ou YC, Hoang L, Roh H (2019) Cyclic behavior of squat reinforced concrete walls with openings typical of exterior walls of row houses in Taiwan. Engineering Structures 195: 231-242.
- Pfeil MS, Battista RC, Mergulhão AJR (2005) Stress concentration in steel bridge orthotropic decks. Journal of Constructional Steel Research 61(8): 1172-1184.
- Popescu C, Sas G, Blanksvärd T, Täljsten B (2015) Concrete walls weakened by openings as compression members: A review. Engineering Structures 89: 172-190.
- Popescu C, Sas G, Blanksvärd T, Täljsten B (2017) Concrete walls with cutout openings strengthened by FRP confinement. Journal of Composites for Construction 21(3).
- Popescu C, Sas G, Cristian S, Blanksvärd T (2016) Effect of cut-out openings on the axial strength of concrete walls. Journal of Structural Engineering 142(11).
- Popescu C, Schmidt JW, Goltermann P, Sas G (2017) Assessment of RC walls with cut-out openings strengthened by FRP composites using a rigid-plastic approach. Engineering Structures 150: 585-598.
- Shamass R, Cashell KA (2017) Behavior of composite beams made using high strength steel. Structures 12: 88-101.
- Shojaee T, Mohammadi B, Madoliat R (2019a) Experimental and numerical investigation of stiffener effects on buckling strength of composite laminates with circular cutout. Journal of Composite Materials 54(9).
- Shojaee T, Mohammadi B, Madoliat R (2019b) Experimental and numerical investigation of stiffener effects on buckling strength of composite laminates with circular cutout. Journal of Composite Materials.
- Teixeira S, Henk K, Frans B (2012) Fatigue behavior of bonded and sandwich systems for strengthening orthotropic bridge decks. Composite Structures 97: 117-128.
- Yang KH, Eun HC, Chung HS (2006) The influence of web openings on the structural behavior of reinforced high-strength concrete deep beams. Engineering Structures 28(13): 1825-1834.
- Zhang J, Liu W, Gao W (2018) Failure behavior and strength of composite I-section beam with double cutouts and stiffener reinforcement. Applied Composite Materials 25(6): 1385-1400.
- Zhao Q, Guo Z, Shen X, Briseghella B (2016) Test study on residual stress distribution of hybrid steel u-rib stiffened plates. Journal of Constructional Steel Research 121: 261-267.
- Shojaee T, Mohammadi B, Madoliat R (2019) Experimental and numerical investigation of stiffener effects on buckling strength of composite laminates with circular cutout. Journal of Composite Materials.
- Lee SY, Hwang JG (2019) Finite element nonlinear transient modelling of carbon nanotubes reinforced fiber/polymer composite spherical shells with a cutout. Nanotechnology Reviews 8(1): 444-451.
- Martinez JL, Cyrino JCR, Vaz MA, Hernández ID, Torres VD, et al. (2023) CFRP repair effectiveness on compressed steel tubular members with circular cutout. Latin American Journal of Solids and Structures 20(2).
- Fofiu M, Bindean A, Stoian V (2015) Seismic performance of a precast reinforced concrete wall with cut-out opening retrofitted using carbon fiber strips. Journal of Applied Engineering Sciences 5(1): 15-22.
© 2026 © Chethan Kumar S And Sandesh NU. This is an open access article distributed under the terms of the Creative Commons Attribution License , which permits unrestricted use, distribution, and build upon your work non-commercially.
Editor In Chief







.jpg)































Signup for Newsletter

Quick Links
 Editorial Board Registrations
 Submit your Article
 Best Paper of the Volume
 Reprints
 Refer a Friend
 Advertise With Us
Our Recent Edition

.jpg)



Top Editors




.jpg)

















.bmp)
.jpg)
.png)
.jpg)













.jpg)






.png)

.png)




.png)




Financial Support

Sponsors

Latest e-Books

Latest Video

 a Creative Commons Attribution 4.0 International License. Based on a work at www.crimsonpublishers.com.
Best viewed in
a Creative Commons Attribution 4.0 International License. Based on a work at www.crimsonpublishers.com.
Best viewed in 
 | Above IE 9.0 version