

- About Us
- Information
-

The Author ensures that the research has been conducted responsibly and ethically with adherence to all relevant regulations. read more..
- For Authors
- For Reviewer
- Manuscript Guidelines
- Membership
- Publication Ethics
-
- Journals
- Reprints
- e-Books
- Videos
- Policies
- Contact Us
 COVID-19
- Submissions



Full Text
Evolutions in Mechanical Engineering
Mechanical Fatigue Yield and Lifetime in Engineering
Kalman Ziha*
Professor emeritus of the University of Zagreb, Croatia
*Corresponding author:Kalman Ziha, Professor emeritus of the University of Zagreb, Croatia
Submission: June 08, 2026;Published: June 24, 2026

ISSN 2640-9690 Volume6 Issue5
Introduction
This review presents the link between the fatigue crack growth measurements and the fatigue lifetime prediction. Fracture mechanics focuses on stress fields in materials under cyclic loads at the crack tip. The review tackles finite fatigue yield and lifetime prediction as dynamical finite causal processes that encompass finite cause and effect interactions. The review presents the links between direct fatigue crack growth and the fatigue endurance data in fracture mechanics. In conclusion, fatigue crack growth data are related to the parameters of lifetime S-N curves.
Mechanical Load Redistribution Model of FCG
This review at the beginning briefly recapitulates the elements of Dynamics of Finite Causal Processes (DFCP) and Finite-Cause-and-Effect Interaction (FCEI) [1-7] between the Fatigue Crack Growth (FCG) and the redistribution of cyclic loads among Nf intact micro-structural bonds of material particles. The initial cyclic stress σt=F/Nf induced by uniaxial constant tensile cyclic force F activates in each successive cycle N bonds failures. The load redistributes to the remaining (Nf -N) and causes overload of σN=F/Nf−N). The overstressing rate represents a FCEI process, as:
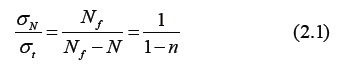
The cyclic ratio n =N/Nf is the dimensionless progression of the FCG.
FCEI Model of FCG
FCG is here a FCEI relation between number N of cyclic loads of stress range Δσ (the cause C) and increasing crack size a(N) (the effect E(C). The primary FCG starts to grow in proportion p to the cyclic ratio n, as:

Figure 1:Load redistribution model of FCG.
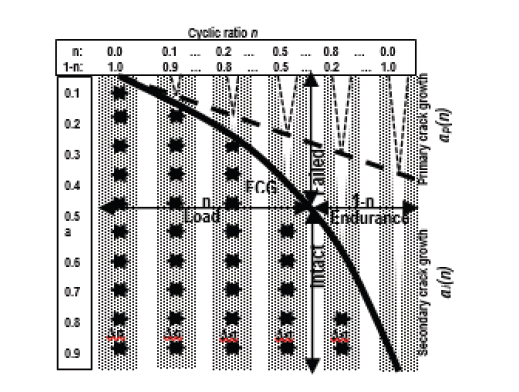
At the same time, the residual fatigue endurance declines due to load redistribution after n load cycles in some proportion r to the remaining number of load cycles (1-n) (Figure 1) as:

According to FCEI, the rate of change of FCG ai(n) of interaction of primary FCG (3.1) and drop of endurance (3.2) (Figure 2) due to overstressing and endurance decline in N cycles can be mathematically presented as follows:
Figure 2:FCEI between cyclic loads n and FCG a(n).
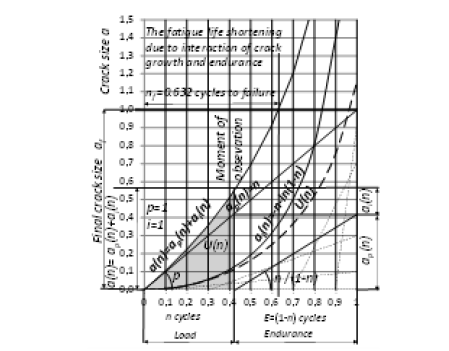

The overall increase of FCG a(n) consists of the initial growth ap (3.1) and of the integral of interaction rate (3.3) up to the cyclic ratio n (2.1), as follows:
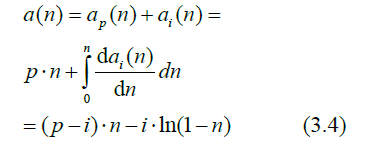
The overall increase of FCG a(n) consists of the initial growth ap (3.1) and of the integral of interaction rate (3.3) as:
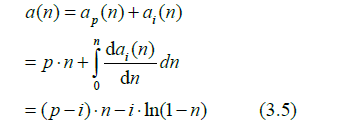
The fatigue crack size curve a(N,Δσ ) under applied cyclic load of stress range Δσ for critical number Nf of failures, also accounting for possible starting crack size a0(n=0) is then as shown:

Parameter p is the propensity to fatigue yielding at the beginning of cyclic loading. The parameter i=p/r is the interaction intensity of FCG and REF (Figure 2). The integration of (3.5) provides the specific energy absorption per cycle under cyclic stresses of constant range Δσ (for example in J/(N x cycles), as shown:
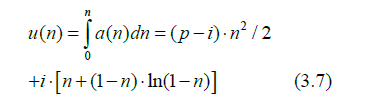
The total energy U(N,Δσ ) of resistance to fatigue cracking using (3.6) (for example in J x cycles /N is then as shown:

Links Between Interaction Model of FCG and Fracture Mechanics
FCG tests under cyclic load of selected stress range Δσt provide the crack size at(Nt) for the number of load cycles Nt. The Paris-Erdogan’s (PE) power rule [8-10] defines the crack growth rate of the steady FCG regime for at(Nt)>as (also denoted as ‘region two’ of FCG starting at crack size as), by two parameters m and C (the slope and the intercept of the stress intensity factor (SIF or K) range fitted to straight line in the logarithmic scale, as follows:

Irwin’s stress intensity factor (SIF or K) range [11] at the end of a crack in Linear Elastic Fracture Mechanics (LEFM) for the measured crack size at using the joint geometry function Y(at) as a correction for limited crack growth, is:

The record of fatigue test crack size curve is employed for determination of the propensity p and the intensity i of the FCEI model curve at(Nt, Δσt) (3.6) in region two of FCG according to (3.1-3.8) as shown:
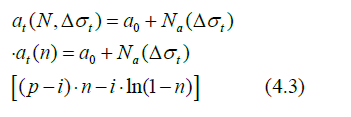
The experimentally defined FCG test curves a( N,Δσt ) for test stress range Δσt described (4.1-4.3) can be recalculated to other arbitrary stress ranges Δσ.
By substituting the FCG rate da/dN (3.3) for the FCG curve at (4.1) into the (PE) power rule equation (4.1) the parameters C and m became attainable from the following relation:

Links Between Fracture Mechanics and Fatigue Life
The stress-life analytic (S-N curves) procedure [12] for fatigue life prediction in engineering of materials for steady FCG regime and high cycle low-strain where the nominal strains are elastic is commonly based on Basquin’s type equation [13] derived from the Hooke’s law in a form of a power rule as follows:

In (5.1) S is the applied stress range Δσ or often the stress amplitude Δσ/2, N is the number of cycles to failure or to transition from steady state to unsteady FCG regime, n is the slope (Basquin constant) and A is the intercept of the S-N curve with the N axes in logarithmic scale.
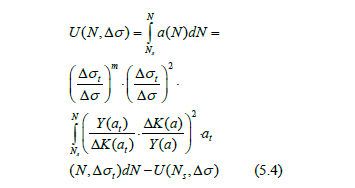
The hypothesis of the next study of fatigue life is that the specific energy absorption per load cycle ut (3.6) during of steady FCG under applied test stress range Δσt is constant and can be analytically related to energy absorption U(N, Δσ) (3.7) under calculational cyclic loads with other stress range Δσ. The energy absorption U(Nt, Δσt) of the FCEI model i.e. the energy of resistance to cracking (3.7) equals to the work done on crack growth W(Nt, Δσt) that can be calculated through numerical integration of experimentally derived FCG curves at(Nt) (Example, Figure 3) as shown:
Figure 3:FCG size a(N).
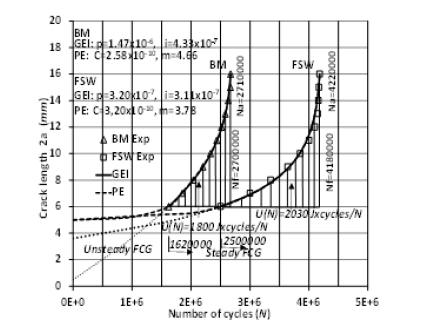

The specific absorbed energy ut(nt) in (5.2) (for example in J / (N x cycles) can be calculated according to (3.7) during steady FCG after ns=Ns/Na cycles at crack size as, as follows:
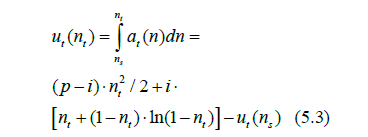
The article investigates in the sequel the possibility for determination and verification of S-N curve parameters n and A in (5.1) directly from the energy absorption ut (5.3) during testing a steady FCG regime under test stress Δσt (5.2).
The fatigue lifetime analysis requires several tests with different stress ranges Δσ to recriate the S-N curve shape of Basquin’s equation (5.1).
The energy U(N, Δσ) absorbed at any selected cyclic stress range Δσ can be recalculated to crack size a equal to the recorded crack size a=at with respect to the energy U(Nt, Δσt) equal to the work done W(Nt, Δσt) until Nt numbers of cycles to failure (3.9) under testing stress range Δσt following the principles of fracture mechanics (4.1-4.4) as shown:
Scaling factor fa(Δσ) representing the effects of crack size on crack growth for finite sheet according to laws of fracture mechanics with respect to energy absorption comes from (5.4) for each applied stress range as follows:
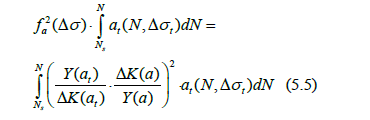
Following (5.5) the (5.4) then can be rewritten using (5.2) and the scaling factor fa as shown:
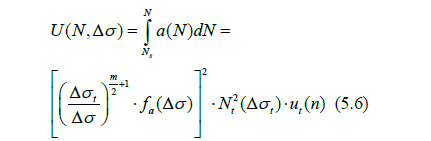
On the other hand, from the GEI model (3.1-3.7) by definition follows the energy of resistance to crack growth under stress range Δσ for appropriate number of cycles to failure N as shown:
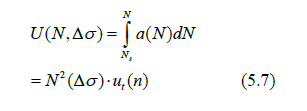
Figure 4:Energy absorption during FCG..
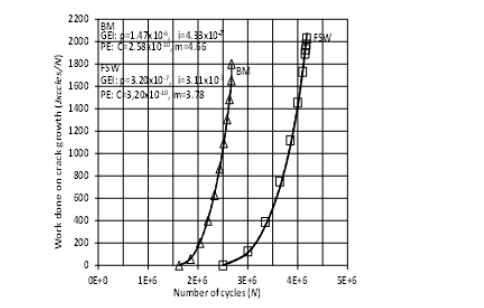
The two relations between energy absorption at optional loading Δσ (5.7) and at test loading Δσt (5.6) (Figure 4) provide the term in a form of corrected Basquin’s equation as shown:

For infinite sheet with constant geometry function Y(a) and for critical SIF Kcr is fa=1 and the above relation (5.8) can be rewritten in the form of standard S-N curve format using stress range values Δσ for S in (5.1) as follows:

The value of the S-N curve slope n (Basquin’s constant) in (5.9) for steady FCG regime is a simple linear function of the slope m of the SIF range curve in (4.2) as presented below:

The intercept A of the S-N curve with the N-axis in (3.5) follows from test data for Δσt and Nt and appropriate value of FCG rate (4.2) characteristic for the transition from steady to unsteady FCG.
For finite sheet w nonlinear geometry function Y(a) and for critical SIF Kcr in (5.8) the scaling factor fa(Δσ) depends on the effect of crack size on crack growth Y(at)/Y(a) for tested Δσt and applied Δσ stress ranges.
For variable joint geometry functions Y the relation (5.8) can be corrected by finding c from the following condition:

For variable scaling factor fa(Δσ) the slope n in (5.11) is modified for different stress ranges Δσ as follows:

The correction c in (5.12) implies the changes caused by effect of crack size to crack growth as shown:

For variable scaling factor fa(Δσ) averaging methods are required to bring the S-N curves to standard linear form in logarithmic scale (5.1).
The necessary information for the prediction of full lifetime, including unstable crack growth (region three) beyond the steady FCG regime (region two), is the number of cycles to total failure Nft determined under test load Δσt.
The simple method for lifetime prediction till total failure under limited information on unsteady crack growth (region three) is the extrapolation of (5.9) for the number of cycles to total failure Nft determined under test load Δσt as follows

Example
Figure 5:FCG rate da(N)/dN.
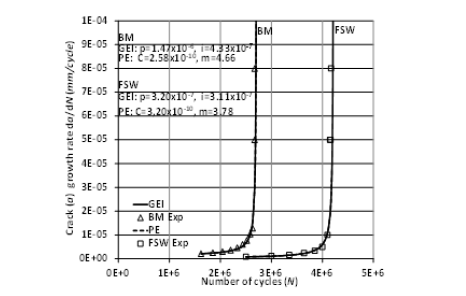
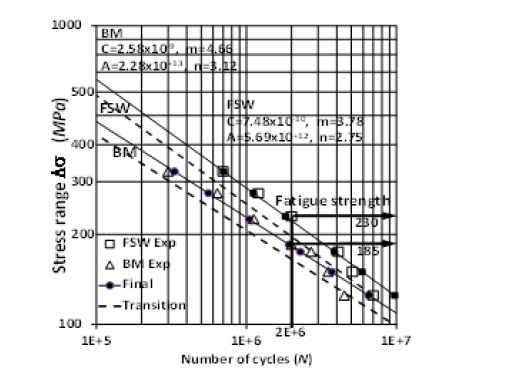
In this section, the appropriateness of the FCEI model is demonstrated by examples of FCG tests reported for Base Material (BM) and Friction Stir Welded joints (FSW) of AISI 409M grade ferritic stainless-steel joints [14] (Figures 3-8). The results of the example are summarized in the figures. Examples confirmed the agreement of calculated and reported data.
Figure 6:Stress intensity factor K(da/dN).
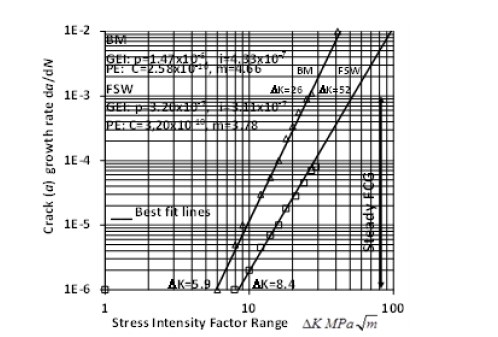
Figure 7:Factor fs for crack size effect.
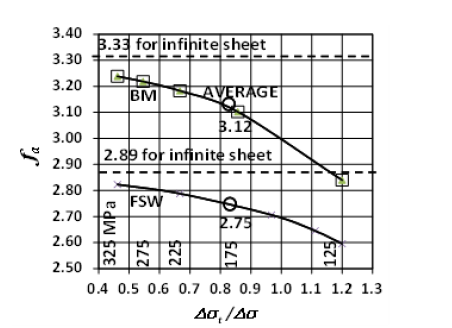
Figure 8:S-N curves.
Conclusion
The review shows that the macroscopically observable fatigue crack growth can be modeled as a mechanical yielding process induced by the redistribution of loads and overstressing among huge but finite numbers of failed and intact internal microstructural bonds in materials. Consequently, fatigue crack growth is regarded as an interaction between fatigue crack growth and fatigue endurance. The fatigue crack growth-endurance-interaction model makes it possible to assess the parameters of fatigue lifetime predictions directly from fatigue crack growth measurements rather than from sets of stress-life tests of lifetime duration under various loading conditions.
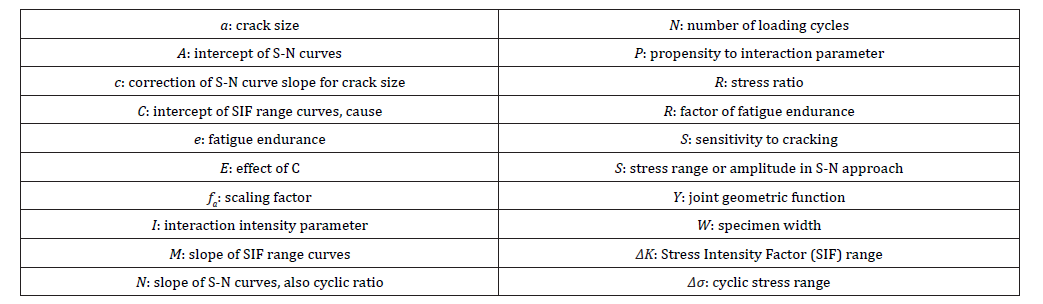
Nomenclature
Acknowledgement
The research was supported by the Ministry of Science, Education and Sports of the Republic of Croatia under grant No. 120-1201703-1702..
References
- Ziha K (2009) Fatigue Yield. International Journal of Fatigue 31(7): 1211-1214.
- Ziha K (2012) Modeling of worsening. J of Systemics Cybernetics and Informatics 10(4): 11-16.
- Ziha K (2014) Cause-and-effect interactions in natural sciences. Journal of Pensee 76(3): 3.
- Ziha K (2015) Stress-strain interaction model of plasticity. Acta Polytechnica Hungarica 12(1): 42-54.
- Ziha K (2016) Relating fracture mechanics and life time prediction. Material Sciences & Engineering-A 651: 167-176.
- Ziha K (2018) Dynamics of finite causal processes. Earth Syst Dynam Discuss.
- Ziha K (2025) Finite causal processes in engineering. Evolutions Mech Eng 6(3): 1-3.
- Paris P, Erdogan F (1963) A critical analysis of crack propagation laws. Journal of Fluids Engineering 85(4): 528-534.
- Pugno N, Ciavarella M, Conneti P, Aarpinteri A (2006) A generalized Paris’ low for fatigue crack growth. Journal of the Mechanics and Physics of Solids 54(7): 1333-1349.
- Brighenti B, Carpinteri A, Corbari N (2013) Damage mechanics and Paris regime in fatigue life assessment of metals. International Journal of Pressure Vessels and Piping 104: 57-68.
- Irwin GR (1957) Analysis of stress and strains near the end of a crack traversing a plate. Journal of Applied Mechanics 24(3): 361-364.
- ASTM E739-91 (2004) Standard practice for statistical analysis of linear or linearized stress-life (S–N) and strain-life (E–N) Fatigue Data, ASTM International.
- Basquin OH (1910) The exponential law of endurance tests. Proc ASTM 10: 625-630.
- Lakshminarayanan AK, Balasubramanian V (2012) Assessment of fatigue life and crack growth resistance of friction stir welded AISI 409M ferritic stainless-steel joints. Materials Science and Eng A 539: 143-153.
© 2026 Kalman Ziha. This is an open access article distributed under the terms of the Creative Commons Attribution License , which permits unrestricted use, distribution, and build upon your work non-commercially.
Editor In Chief







.jpg)































Signup for Newsletter

Quick Links
 Editorial Board Registrations
 Submit your Article
 Best Paper of the Volume
 Reprints
 Refer a Friend
 Advertise With Us
Our Recent Edition

.jpg)



Top Editors




.jpg)

















.bmp)
.jpg)
.png)
.jpg)













.jpg)






.png)

.png)




.png)




Financial Support

Sponsors

Latest e-Books

Latest Video

 a Creative Commons Attribution 4.0 International License. Based on a work at www.crimsonpublishers.com.
Best viewed in
a Creative Commons Attribution 4.0 International License. Based on a work at www.crimsonpublishers.com.
Best viewed in 
 | Above IE 9.0 version