
- About Us
- Information
-

The Author ensures that the research has been conducted responsibly and ethically with adherence to all relevant regulations. read more..
- For Authors
- For Reviewer
- Manuscript Guidelines
- Membership
- Publication Ethics
-
- Journals
- Reprints
- e-Books
- Videos
- Policies
- Contact Us
 COVID-19
- Submissions


Full Text
COJ Biomedical Science & Research
A Committee Machine Qsar Workflow for Estimation of Efficient Papain-Like Protease (PLpro) Inhibitors
Elham Zamani*, Gholamreza Dehghan, Abolfazl Barzegar and Leila Sadeghi
Department of Biology, Faculty of Natural Sciences, University of Tabriz, Iran
*Corresponding author:Elham Zamani, Department of Biology, Faculty of Natural Sciences, University of Tabriz, Tabriz, Iran
Submission: April 28, 2025; Published: June 20, 2025

Volume2 Issue4June 20, 2025
Abstract
Coronavirus disease was one of the most challenging pandemics of the current century and it is necessary to design most efficient inhibitors for that. Quantitative Structure-Activity Relationship (QSAR) has a very important role in manufacturing novel and potent compounds for predicting the best new compounds activity. In this study, expert QSAR systems comprising of fuzzy inference system, neuro-fuzzy model and neural networks were developed for training inhibitors of SARS-CoV PLpro using 1558 descriptors. Six descriptors out of 1558 including RDF035u (Radial Distribution Function-035), RDF050u (Radial Distribution Function-050), Mor23u (signal 23/unweighted 3D-MoRSE descriptors), E2e (2nd component accessibility directional WHIM index/weighted by Sanderson electronegativity WHIM descriptors), R4p (R autocorrelation of lag 4/weighted by polarizability GETAWAY descriptors) and B04[N-N] (Presence/ absence of N-N at topological distance 4 2D Atom Pairs) were applied as the optimal inputs for estimating pIC50 (-log[IC50]) of PLpro inhibitors. Using the weighted averaging committee machine, the correlation coefficient increased to 0.86 that corresponds to the mean squared error of 0.121. The results of this study enable researchers to predict the behaviour and activity of new molecules and compounds based on the behaviour of similar molecules to control SARS-CoV-2. The advanced committee machine models can successfully be employed in drug discovery and design.
Keywords:Quantitative structure-activity relationship; Papain-like protease; Coronavirus; Committee machine; Neural network; Descriptors; Fuzzy inference system; Neuro-fuzzy model
Introduction
SARS-CoV-2 (Severe Acute Respiratory Syndrome Coronavirus 2) was recognized in Wuhan (China) for the first time and spread all over the globe. This became one of the most challenging epidemics of the current century [1]. Coronavirus belongs to the betacorona family of viruses and its large (+) sense ssRNA codes 29 proteins [1,2]. The genome of coronavirus RNA has a 5 polyadenylated tail and a 5́ methylated cap that enables it to function similar to the messenger RNA and be translated by the host cell ribosomes, directly. The Open-Reading Frames ORF1a and ORF1b of the overlapping virus genome are translated by the host ribosomes into two large overlapping polypeptides, pp1a and pp1ab [3]. These Polyproteins have specific proteases including Mpro (chymotrypsin-like main protease) and PLpro (Papain-Like protease) that break down polyproteins at specific sites [4]. Processing of the polyproteins by these two kinds of Mpro and PLpro cysteine proteases is important for the virus proliferation cycle. PLpro is very conservative and normally has two copies (PL1pro and PL2pro) in all coronaviruses [5,6]. In MERS-CoVs and SARS-CoVs it has deubiquiting and deISG15ylating activities. Both of these proteins (ubiquitin and ISG15) have a motif for recognition PLpro at their c-terminal [7-9]. Eliminate these modifications intrude with host cells respond to viral infection and facilitate viral proliferation and replication [8,10,11].
Furthermore, PLpro put TBK1 out of function, prevents signalling of NF-kappaB, impedes IRF3 translocation to the nucleus, blocks TLR7 signalling, and causes EGr-1-dependent to upregulate TGF-β1 [12,13]. Due to the essential and multiple functions and requisite roles of PLpro in viral pathogenesis it can be considered a great therapeutic targeting. Pairwise sequence alignments in Figure 1 are shown that the SARS-CoV-2 PLpro sequence is 90.2% similar and 83% identical to SARS-CoV PLpro. Also, crystal structure comparison denotes strong structure conservation with a quantitative comparison that is provided in the form of a Root- Mean-Square Deviation (RMSD) in the atomic positions for the CoV-2 PLpro and CoV PLpro (Figure 2). There is no significant difference in the conservation of geometrical core or surface residues in both CoV-2 PLpro and CoV PLpro crystal structures. Since, the sequence, structure, and functional conservations of CoV PLpro with CoV-2 PLpro suggest that therapeutics SARS-CoV PLpro possibly could be effectively targeting against SARS-CoV-2 virus by PLpro. The previous studies with CoV PLpro have resulted in the development of several inhibitors that were effective for SARS-CoV PLpro. Currently, there is no significant number of compounds to inhibit the SARS-CoV-2 PLpro. In this scenario, it seems that the screening of SARS CoV PLpro inhibitors may be culminated in potential inhibitors of the SARS-CoV-2 PLpro enzyme by saving the costs and the drug development timeline. Therefore, we believe that using SARS-CoV PLpro inhibitors will be an excellent starting point for designing putative inhibitors against SARS-CoV-2 by Quantitative Structure-Activity Relationship (QSAR) studies. QSAR as a mathematical method intends to make relationships between biological activities and structure [14]. The QSAR modeling serves as the most robust approach in computer-aided drug design and will be utilized to introduce new effective inhibitors. In this work, we developed a deep model platform of a committee machine for QSAR studies and strategies to discover highly potent SARS-CoV-2 inhibitors. The developed hybrid approach called committee machine to provide critical insights for further ligand-based drug design efforts against SARS-CoV-2 PLpro to enable the design of higher effective inhibitors and, finally, Covid-19 treatments.
Figure 1:Pairwise global sequence alignment between SARS-CoV-2 PLpro and SARS-CoV PLpro using EMBOSS Needle Program. Alignment was performed by EMBOSS default as; Matrix: BLOSUM62, Gap penalty: 10.0, Extend penalty: 0.5. Pairwise sequence similarities between SARS-CoV-2 PLpro and SARS-CoV PLpro were achieved 90.2%.

Figure 2:3D structures of SARS-CoV-2 PLpro (PDB: 7CJM) and SARS-CoV PLpro (PDB: 4OW0). Comparison structure of SARS-CoV-2 PLpro (in red color), the SARS-CoV crystal structure (in grey color). RMSD between 277 pruned atom pairs (including active site) is 0.761 Å; (across all 312 pairs: 1.324 Å). The main conformational changes are related to C-terminal section of enzymes. Figures were generated with UCSF Chimera 1.11.2.

Material and Methods
Dataset and methodology
A set of 91 SARS-CoV PLpro diverse inhibitors was taken as a
reference [15]. All of the SMILES (Simplified Molecular Input Line
Entry System) notation of compounds with their pIC50 values were
provided in the supplemental link (https://www.researchgate.net/
publication/353957843_Entry_1). The QSAR methodology adopted
in this study comprises four major steps as follows;
a) the conformational optimization of different 91 compounds
as input dataset for calculation of molecular descriptors (1558
descriptors).
b) stepwise regression analysis to reduce the dimensionality of
the problem and select the appropriate inputs for intelligent mode
construction.
c) different initial models developing for predicting pIC50 (-log
[IC50]) of PLpro inhibitors using intelligent ensembles including
neural networks, fuzzy inference systems, and hybrid neuro-fuzzy
systems.
d) finally, developing and establishing a Committee Machine
with Intelligent Ensembles (CMIE) as an improved model for
estimating pIC50 values of PLpro inhibitors by using genetic
algorithms. The inputs of the CMIE are the outputs of individual
intelligent ensembles.
Molecular structure optimization
All of the initial 3D structures of 91 compounds were achieved by using the SMILES-3D converting web-based software available at https://cactus.nci.nih.gov/translate/. Afterwards, we used Hyperchem 8.0 software for optimizing all of 91 compounds 3D structure geometries. Molecular Mechanics (MM+) and semiempirical (AM1) methods were employed for the pre-optimization and optimization of the structures, respectively. Geometry optimization was performed by using the Polak-Ribiere algorithm based on the conjugate gradient approach. The least Root-Mean- Square (RMS) gradient convergence values were below 0.001 and 0.01kcal/mol for applied molecular mechanics and semi-empirical methods [16,17].
Descriptors calculation
The molecular descriptors are applied to assess molecular structure-activity and/or structure-property relations together with an analysis of similarity in molecule databases. A total of 1558 molecular descriptors were calculated in 22 logical blocks by applying Dragon 5.5 software package as represented in Table 1. These blocks we clustered according to the descriptor dimensionality of 0D, 1D, 2D, 3D, and others. The descriptor dimensionality of 0D represents atom- and bond-type counts, 1D refers to fragment counts, 2D to topological and related descriptors, and 3D to all the descriptors, which are dependent on the geometrical coordinates of the molecule atoms.
Table 1:Summary of machine learning method’s performance for PIC50 estimation.

Stepwise regression analysis
Stepwise regression analysis was performed on 1558 descriptors to choose the optimal ones for estimating the pIC50 of PLpro inhibitors. We have divided the input dataset into 15 groups each one containing 100 descriptors, except the last group which includes 159 datasets of descriptors. A stepwise regression model was built within each group to choose the optimal descriptors. Due to the large volume of descriptors and memory limitation in running the regression model in MATLAB, the whole 1558 descriptors were divided into 15 sets comprising 1400 descriptors in sets 1 through 14 (100 descriptors each) and 158 descriptors in the 15th set. In this regard, fifteen regression models were used to choose the optimum descriptors for the estimation of pIC50 of PLpro inhibitors. The results of all fifteen individual regression models were led to identify a total of 14 descriptors. Cross plots representing the relations between pIC50 and the identified 14 descriptors out of 1558 ones are illustrated in Figure 3. To choose the final important descriptors, an additional stepwise regression was established between the identified 14 descriptors and pIC50 values. Accordingly, a total of six inputs including RDF035u, RDF050u, Mor23u, E2e, R4p, and B04[N-N] were achieved as the final descriptor for estimating the pIC50 of PLpro inhibitors.
Figure 3:Crossplots showing the relations between pIC50 and final descriptors. As is seen, out of 14 descriptors, six ones including RDF035u, RDF050u, Mor23u, E2e, R4p and B04[N-N] show the strongest relations with pIC50 of PLpro inhibitors.

Designing Committee Machine with Intelligent Ensembles (CMIE)
A committee machine that merges the outputs of the individual machine learning method with some extra calculations. The performance of CM (Committee Machine) is better than individual machine learning techniques [18]. The general architecture of a CMIE used in this research for pIC50 estimation is shown in Figure 4. The committee machine can be built by using simple and weighted averaging approaches. In the simple averaging approach, each of the individual experts has an equal contribution to the overall prediction, while in the weighted averaging committee machine an optimization algorithm such as a genetic algorithm is employed to assign the appropriate weights to each expert [19]. The previous applications of committee machines in different problems solving can be mentioned [20-26].
Figure 4:The schematic diagram of the workflow adopted in this study for estimating pIC50 of PLpro inhibitors

pIC50 estimation by machine learning methods
In this study, machine learning methods including artificial neural networks, hybrid neural network-fuzzy systems (neurofuzzy), and fuzzy inference system models were employed to estimate pIC50 from a set of predefined descriptors. For this purpose, a total of 91 inhibitors and their corresponding measured pIC50 values were chosen as targets to be estimated by machine learning methods. The whole dataset was divided into 72 training input-output datasets to establish expert systems and 19 testing samples to assess their accuracy. Training samples that form the majority of data (79%) are used for feature extraction and making relationships between input and output data, while a small fraction of whole data (21%) were chosen by random to evaluate the reliability of the established machine learning models.
Fuzzy Inference System
In order tore generate a fuzzy model first, the input/output space was divided into a set of clusters by using subtractive clustering [27,28]. The most important parameter in subtractive clustering is setting an optimal value for clustering radius (r) in the range of [01] [29,30]. A small clustering radius (such as 0.1) yields too many clusters resulting in too many fuzzy rules. A larger clustering radius (such as 0.9) generates a few clusters of fuzzy rules. To optimize the clustering radius a total of 199 fuzzy models were generated based on clustering radii ranging from 0.005 to 1 with 0.005 incremental intervals. The clustering radius corresponding to minimum MSE (Mean Squared Error) was considered the optimal r value. The plot showing the MSE and R (correlation coefficient) in pIC50 estimation versus clustering radius in testing data is displayed in Figure 5a & 5b. As is seen, setting the clustering radius of 0.195 is associated with the minimum MSE in testing samples. This has generated 67 Gaussian membership functions for each input/output space. Accordingly, 67 fuzzy if-then rules were established to formulate the descriptors to pIC50. The Gaussian membership function uses the mean (μ ) and standard deviation (σ ) of data fallen within each cluster as follows [31,32].
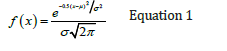
Figure 5a:Plot showing the mean squared error in pIC50 estimation versus clustering radius. The clustering radius of 0.195 is associated with the minimum MSE in testing samples. This has generated 67 Gaussian membership functions for each input/output space.

Figure 5b:Plot showing the correlation coefficient in pIC50 estimation versus clustering radius. Choosing the clustering radius of 0.195 is associated with the highest correlation coefficient of 0.6055 in training data.

Neural Network
A neural network comprising three layers with an error backpropagation algorithm was established to predict pIC50 with the same cluster of 6 descriptors, explained in section 2.4, used in the fuzzy model. The model data were classified into training (70%), validation (15%), and testing (15%) groups. It is worth mentioning that this classification is used only for neural network models on 72 data samples already chosen for all methods as model data. As with the other machine learning models, the same 19 testing samples were used for the final validity evaluation of the neural network model. Training data were applied to learn the input/output relationships and extract the optimal weight and bias values. Validation data were employed to avoid overtraining or overfitting. It means that in the absence of validation data, the neural network memorizes the training examples so that it performs well in the training dataset but fails in unseen data or testing datasets. Testing data aimed at measuring the accuracy of the designed neural network model. Six neurons were considered in the inputs layer corresponding to six descriptors. The number of neurons optimized in the middle layer was set to 8 and the output layer includes one neuron for the pIC50 values. The Levenberg-Marquardt Training Algorithm (LMTA) and MSE functions were applied for optimization of the weights and measuring the accuracy of the model, respectively. The used transfer functions from the input to hidden and hidden to the output layers were Tansig and Purelin, respectively. The training goal was considered as 0 and the maximum number of training epochs was set to 1000. Performance graphs illustrating the correlation coefficient between the estimated and measured pIC50 in training, validation, testing, and all data sets are shown in Figure 6.
Figure 6:Performance plots showing the correlation coefficient between measured and estimated pIC50 in training, validation, testing and all data set.

Hybrid Neuro-Fuzzy Model
In this section, a hybrid neuro-fuzzy model was established to predict pIC50 from the same six descriptor sets used in the neural network and fuzzy models. Neuro-fuzzy models reap the advantages of both errors back-propagation neural nets and fuzzy systems. Neuro-fuzzy model is a fuzzy model in which a backpropagation algorithm was used to optimize the membership function parameters. Several training epochs were set to 1000 and subtractive clustering was applied for the generation of fuzzy rules. The general architecture of the adaptive neuro-fuzzy model developed in this study for pIC50 estimation is shown in Figure 7.
Figure 7:A general architecture of the adaptive neuro-fuzzy model developed in this study for pIC50 estimation.

Result and Discussion
The World Health Organization has described COVID-19 disease caused by SARS-CoV-2 as a global pandemic. For a rapid response, the QSAR method based on inhibitors that were previously designed against various targets of previous human coronavirus infections will be a key starting point for designing anti-SARS-CoV-2 inhibitors. In this research, our approach integrates different ligand-based drug design QSAR strategies for PLpro chemical inhibitors [33].
Input descriptors selection
To select the optimal input data for pIC50 estimation of PLpro inhibitors, the Stepwise Regression Analysis (SRA) recommended the input descriptors including RDF035u, RDF050u, Mor23u, E2e, R4p, and B04[N-N]. The following equation was derived by using the SRA for pIC50 estimation from the above-mentioned descriptors:
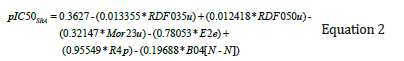
Graphs representing the correlation coefficient and graphical comparison between the estimated and measured pIC50 of PLpro inhibitors in test data are illustrated in Figure 8a & 8b, respectively. The R2 value to estimate pIC50 by using stepwise regression is equal to 0.64 corresponding to a mean squared error of 0.028.
Figure 8:Plots showing the correlation coefficient
(a) and graphical comparison
(b) between measured and estimated pIC50 of PLpro inhibitors by using stepwise regression analysis in test data.

Applying individual machine learning models
The output of running machine learning algorithms including fuzzy inference system, neural network, and neuro-fuzzy model in testing data to estimate pIC50 of PLpro inhibitors are shown in Figure 9a & Figure 9b and Figure 10a & Figure 10b through Figure 11a & Figure 11b, respectively. As is seen, among the machine learning methods applied, the neural network model with the correlation coefficient and MSE of 0.843 and 0.015 outperforms neuro-fuzzy and fuzzy logic models. There is a good correlation between the experimentally calculated and neural network estimated pIC50 of PLpro inhibitors.
Figure 9:Plots showing the correlation coefficient
(a) and graphical comparison
(b) between measured and estimated pIC50 of PLpro inhibitors by using fuzzy inference system in test data.

Figure 10:Plots showing the correlation coefficient
(a) and graphical comparison
(b) between measured and estimated pIC50 of PLpro inhibitors by using neural network in test data.

Figure 11:Plots showing the correlation coefficient
(a) and graphical comparison
(b) between measured and estimated pIC50 of PLpro inhibitors by using neuro-fuzzy inference system in test data.

Applying committee machine models
In the next step, a Simple Averaging Committee Machine (CMSA) was designed by employing a simple averaging approach. In this method, each of the individual machine learning methods and SRA model has an equal contribution to constructing CMSA. That is every four models used to estimate pIC50 has a weight value of 0.25. Thus, the pIC50 was estimated from CMSA through the following equation.
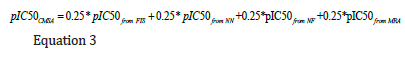
Applying Equation 3 results in the mean squared error of 0.019 and R2 of 0.756 in estimating pIC50. Plots showing the correlation coefficient and graphical comparison between measured and estimated pIC50 of PLpro inhibitors by using CMSA in test data are illustrated in Figure 12a & Figure 12b. Finally, a Weighted Averaging Committee Machine (CMWA) was constructed by using GA (Genetic Algorithm) to derive the optimum weight contribution of the individual experts of the committee machine model. The cost function for GA to be minimized was defined as below:

Figure 12:Plots showing the correlation coefficient
(a) and graphical comparison
(b) between measured and estimated pIC50 of PLpro inhibitors by using simple averaging committee machine (CMSA)
in test data.

where w1 through w4 are the weight factors relevant to fuzzy inference system (o1i), neural net model (o2i), neural fuzzy (o3i), and MRA (o4i) predictions, respectively. i T is the measured pIC50 data and is the total number of samples in the training data (72 data points). Using the optimized weights derived from GA, the final equation for estimating pIC50 of PLpro inhibitors is expressed as follows:
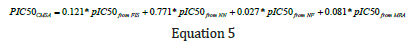
Equation 5 which represents the mathematical form of the weighted averaging committee machine was applied to the input descriptors of the test samples to estimate their corresponding pIC50 values. The obtained mean squared error and correlation coefficient in test samples are 0.014 and 0.856, respectively. Graphs representing the R2 and graphical comparison between the measured and estimated pIC50 of PLpro inhibitors by using CMWA in test data are illustrated in Figure 13a & Figure 13b. A summary of the machine learning method’s performance for pIC50 estimation is listed in Table 1. As is seen, CMWA has improved the correlation coefficient between measured and estimated pIC50 to 0.856. This has led to a decrease in mean squared error to 0.014. A very good agreement exists between the experimentally calculated and CMWA-predicted pIC50 of Papain-like protease inhibitors.
Figure 13:Plots showing the correlation coefficient
(a) and graphical comparison
(b) between measured and estimated pIC50 of PLpro inhibitors by using weighted averaging committee machine
(CMWA) in test data.

Conclusion
In this study, individual and hybrid machine learning methods including fuzzy logic, neural network, and neuro-fuzzy were used to estimate the pIC50 of Papain-like protease inhibitors from a set of predefined descriptors by using stepwise regression analysis. Six descriptors out of 1558 including RDF035u (Radial Distribution Function-035), RDF050u (Radial Distribution Function-050), Mor23u (signal23 unweighted 3D-MoRSE descriptors), E2e (2nd component accessibility directional WHIM index/weighted by Sanderson electronegativity WHIM descriptors), R4p (R autocorrelation of lag 4/weighted by polarizability GETAWAY descriptors) and B04[N-N] (Presence/absence of N-N at topological distance 4 2D Atom Pairs) were extracted as the optimal inputs for estimating pIC50. Among the individual machine learning methods applied, a neural network with a correlation coefficient and MSE of 0.843 and 0.015 outperforms neuro-fuzzy and fuzzy logic models. Applying the CMWA has improved the correlation coefficient between estimated and measured pIC50 to 0.856. This has led to a decrease in mean squared error to less than 0.014. There is a satisfactory match between the experimentally calculated and CMWA estimated the pIC50 of Papain-like protease inhibitors. It is expected that using an integrated intelligent model with little additional computation will improve the performance of QSARartificial intelligence models. The applied integrated intelligent models can successfully be used in drug discovery and design.
Declarations
Ethical approval
Our study, whose information is given above, is not included in this scope. Therefore, it does not require any ethics committee approval. I acknowledge and declare that no breach of ethical rules has been made during the preparation and publication of the study.
Consent to participate
The current study is not included in this scope. Therefore, it does not require any participant.
Consent to publish
We transfer to Springer Nature the non-exclusive publication rights and we warrant that our contribution is original and that we have full power to make this grant. We accept responsibility for releasing this material. This transfer of publication rights covers the non-exclusive right to reproduce and distribute the article, including reprints, translations, photographic reproductions, microform, electronic form (offline, online) or any other reproductions of similar nature.
Author’s contribution
All the authors had good and active cooperation in writing the article and the article has been completed with the participation of all the authors. Elham Zamani is the main writer of the manuscript. Gholamreza Dehghan and Abolfazl Barzegar assisted in methodology, software and supervision. Leila Sadeghi contributed in reviewing the manuscript.
Availability of data and materials
The datasets analysed in the current study can be found in the Supplementary material of this article.
Acknowledgement
The authors would like to thank Sk. Abdul Amin from the Jadavpur University of India for his help and insightful comments in preparation for this paper. The vice-president of research and technology of the University of Tabriz is acknowledged for sponsoring this research. We express our gratitude to the unknown reviewers that helped us improve the quality of this research paper.
References
- Kim D, Yang JS, Kim JW, Kim VN, Chang H, et al. (2020) The architecture of SARS-CoV-2 transcriptome. Cell 181(4): 914-921.e10.
- Baker SC, Drosten C, Enjuanes L, Fouchier RAM, Galiano M, et al. (2013) Middle east respiratory syndrome coronavirus (MERS-CoV): Announcement of the coronavirus study group. J Virol 87(14): 7790-7792.
- Hui DS, Azhar EI, Kim YJ, Memish ZA, Zumla A, et al. (2018) Middle east respiratory syndrome coronavirus: Risk factors and determinants of primary, household, and nosocomial transmission. Lancet Infect Dis 18(8): e217-e227.
- Snijder EJ, Decroly E, Ziebuhr J (2016) The nonstructural proteins directing coronavirus RNA synthesis and processing. Adv Virus Res 96: 59-126.
- Woo PCY, Huang Y, Lau SKP, Yuen KY (2010) Coronavirus genomics and bioinformatics analysis. Viruses 2(8): 1804-1820.
- Mielech AM, Chen Y, Mesecar AD, Baker SC (2014) Nidovirus papain-like proteases: Multifunctional enzymes with protease, deubiquitinating and deISGylating activities. Virus Res 194: 184-190.
- Ratia K, Kilianski A, Yahira MBS, Baker SC, Mesecar A (2014) Structural basis for the ubiquitin-linkage specificity and deISGylating activity of SARS-CoV papain-like protease. PLoS Pathog 10(5): e1004113.
- Wang CY, Hunang SH, Hsiao LH, Wan L, Kung SH, et al. (2016) SARS coronavirus papain-like protease inhibits the TLR7 signaling pathway through removing Lys63-linked polyubiquitination of TRAF3 and TRAF6. Int J Mol Sci 17(5): 678.
- Shin D, Mukherjee R, Grewe D, Bojkova D, Widera M, et al. (2020) Papain-like protease regulates SARS-CoV-2 viral spread and innate immunity. Nature 587(7835): 657-662.
- Lindner HA, Ziomek E, Lytvyn V, Hongtao Q, Lachance P, et al. (2007) Selectivity in ISG15 and ubiquitin recognition by the SARS coronavirus papain-like protease. Arch Biochem Biophys 466(1): 8-14.
- Swaim CD, Canadeo LA, Monte KJ, Khanna S, Lenschow DJ, et al. (2020) Modulation of extracellular ISG15 signaling by pathogens and viral effector proteins. Cell Rep 31(11): 107772.
- Chen CH, Lin ZS (2006) A committee machine with empirical formulas for permeability prediction. Computers & Geosciences 32(4): 485-496.
- Chen X, Zheng Y, Yang X, Yudong Y, Chen Z, et al. (2014) SARS coronavirus papain-like protease inhibits the type I interferon signaling pathway through interaction with the STING-TRAF3-TBK1 complex. Protein Cell 5(5): 369-381.
- Clasman JR, Everett RK, Srinivasan K, Mesecar AD (2020) Decoupling deISGylating and deubiquitinating activities of the MERS virus papain-like protease. Antiviral Res 174: 104661.
- Barzegar B, Elham ZG, Ali KI (2017) ANN QSAR workflow for predicting the inhibition of HIV-1 reverse transcriptase by pyridinone non-nucleoside derivatives. Future Med Chem 9(11): 1175-1191.
- Abdul ASK, Ghosh K, Gayen S, Tarun J (2021) Chemical-informatics approach to COVID-19 drug discovery: Monte carlo based QSAR, virtual screening, and molecular docking study of some in-house molecules as papain-like protease (PLpro) inhibitors. J Biomol Struct Dyn 39(13): 4764-4773.
- Barzegar A, Pedersen JZ, Incerpi S, Ali AMM, Saso L (2011) The mechanism of antioxidant activity of IRFI005 as a synthetic hydrophilic analogue of vitamin E. Biochimie 93(10): 1880-1888.
- Barzegar A (2012) Proton-coupled electron-transfer mechanism for the radical scavenging activity of cardiovascular drug dipyridamole. PLoS ONE 7(6): e39660.
- Labani MM, Ali KI, Salahshoor K (2010) Estimation of NMR log parameters from conventional well log data using a committee machine with intelligent systems: A case study from the Iranian part of the south pars gas field, persian gulf basin. Journal of Petroleum Science and Engineering 72(1-2): 175-185.
- Naftaly U, Intrator N, Horn D (1997) Optimal ensemble averaging of neural networks. Network: Computation in Neural Systems 8(3): 283-296.
- Kadkhodaie AI, Rezaee MR, Hossain RB, Chehrazi A (2009) Petrophysical data prediction from seismic attributes using a committee fuzzy inference system. Computers & Geosciences 35(12): 2314-2330.
- Kadkhodaie AI, Rezaee MR, Hossain RB (2009) A committee neural network for prediction of normalized oil content from well log data: An example from south pars gas field, persian gulf. Journal of Petroleum Science and Engineering 65(1-2): 23-32.
- Kadkhodaie AI, Hossain RB, Rezaee M (2009) A committee machine with intelligent systems for estimation of total organic carbon content from petrophysical data: An example from the kangan and dalan reservoirs in south pars gas field, Iran. Computers & Geosciences 35(3): 459-474.
- Javad GF, Kadkhodaie A, Ziaii M (2012) The application of committee machine with intelligent systems to the prediction of permeability from petrographic image analysis and well logs data: A case study from the south pars gas field, South Iran. Petroleum Science and Technology Journal 30(20): 2122-2136.
- Golsanami N, Kadkhodaie AI, Sharghi Y, Zeinali M (2014) Estimating NMR T2 distribution data from well log data with the use of a committee machine approach: A case study from the asmari formation in the zagros basin, Iran. Journal of Petroleum Science and Engineering 114: 38-51.
- Sfidari E, Kadkhodaie AI, Ahmadi B, Faraji MA, Bechzad A (2018) Prediction of pore facies using GMDH-type neural networks: A case study from the south par’s gas field, persian gulf basin. Geopersia 8(1): 43-60.
- Chiu S (1994) Fuzzy model identification based on cluster estimation. Journal of Intelligent and Fuzzy Systems 2(3): 267-278.
- Rasoul RK, Kadkhodaie AI, Shiri M (2014) A modified fuzzy inference system for estimation of the static rock elastic properties: A case study from the kangan and dalan gas reservoirs, south pars gas field, the persian gulf. Journal of Natural Gas Science and Engineering 21: 962-976.
- Kadkhodaie AI, Rezaee M, Moallemi SA (2006) A fuzzy logic approach for the estimation of permeability and rock types from conventional well log data: An example from the kangan reservoir in Iran offshore gas field, Iran. Journal of Geophysics and Engineering 3(4): 356-369.
- Nourafkan A, Kadkhodaie AI (2015) Shear wave velocity estimation from conventional well log data by using a hybrid ant colony-fuzzy inference system: A case study from cheshmeh-khosh oilfield. Journal of Petroleum Science and Engineering 127: 459-468.
- Rezaee MR, Kadkhodaie AI, Barabadi A (2007) Prediction of shear wave velocity from petrophysical data utilizing intelligent systems: An example from a sandstone reservoir of carnarvon basin, Australia. Journal of Petroleum Science and Engineering 55(3-4): 201-212.
- Kadkhodaie AI, Amini A (2009) A fuzzy logic approach to estimating hydraulic flow units from well log data: A case study from the ahwaz oilfield, South Iran. Journal of Petroleum Geology 32(1): 67-78.
- Osipiuk J, Dvorkin S, Endres M, Jones KA, Kang S, et al. (2021) Structure of papain-like protease from SARS-CoV-2 and its complexes with non-covalent inhibitors. Nat Commun 12(1): 743.
© 2025 Elham Zamani. This is an open access article distributed under the terms of the Creative Commons Attribution License , which permits unrestricted use, distribution, and build upon your work non-commercially.
Editor In Chief


.jpg)


Signup for Newsletter

Quick Links
 Editorial Board Registrations
 Submit your Article
 Refer a Friend
 Advertise With Us
Our Recent Edition

.jpg)


Top Editors


.jpg)


.bmp)
.jpg)
.png)
.jpg)


.jpg)


.png)

.png)


.png)


Financial Support

Sponsors

Latest e-Books

Latest Video

 a Creative Commons Attribution 4.0 International License. Based on a work at www.crimsonpublishers.com.
Best viewed in
a Creative Commons Attribution 4.0 International License. Based on a work at www.crimsonpublishers.com.
Best viewed in