
- About Us
- Information
-

The Author ensures that the research has been conducted responsibly and ethically with adherence to all relevant regulations. read more..
- For Authors
- For Reviewer
- Manuscript Guidelines
- Membership
- Publication Ethics
-
- Journals
- Reprints
- e-Books
- Videos
- Policies
- Contact Us
 COVID-19
- Submissions


Full Text
Aspects in Mining & Mineral Science
A Novel Methodology for Predicting Fractures and Mining Induced Seismicity around Underground Excavations
R W O Kersten*
Witwatersrand University, South Africa
*Corresponding author:R W O Kersten, Witwatersrand University, 7 Imverness Road, Johannesburg, South Africa
Submission: December 10, 2025: Published: December 17, 2025

ISSN 2578-0255Volume14 Issue 4
Abstract
The paper describes a failure criterion/methodology consisting of five components: the maximum and minimum principal stresses, their ratio, a strength/stress criterion, stress orientations and the coincidence of the optimum stress orientation and the strength/stress contour. The criterion is included in an elastic continuum model for a series of mining geometries predicting fracture development and comparing these with measured data. The extent and fracture type and possible seismic activity is discussed. It is concluded that the results obtained are positive and this line of research is worthwhile pursuing.
Keywords:Mining; Coalescence; Microcrack; Underground excavations; Optimal orientations
Introduction
The objective of this article is to simulate possible rock fracture types present around stopes and how this knowledge can be used in the study of seismic activity and tectonic processes. To achieve this objective a credible failure criterion is required for determining the extent of the failed zones as well as the effect this has on the overall stress field which again will affect the failure process. Failure in the rock must, therefore, be seen as a process and not as instantaneous snapshots. The process, however, is complex and the objective will be limited to defining individual fracture zones and the resulting fracture types. The effect of interaction between different zones and the resultant combined fracture system are discussed and need further work.
An update is given of the failure criterion proposed by Kersten [1] in terms of the rock strength/stress ratio as well the failure mechanism and the interaction between the strength/stress ratio and the optimum microcrack orientation.
A mechanism of micro-crack coalescence is investigated in detail for various stress regimes and a methodology for prediction thereof is given. The adjusted failure criterion is then introduced in a FLAC2D model to predict the fracture zones and the different types of fractures compared to underground observations and measurements.
It was found that:
a.Failure for k-ratio, minimum/maximum principal stress, close to zero results in induced tensile stress fractures parallel to the maximum principal stress.
b.Failure for k ratio in excess of 0 to a value of .03 the classic Griffith theory of brittle failure is applicable.
c. For a k-ratio in excess of .03 the failure mechanism changes
resulting in apparent complex geometries.
d. The criterion is applicable from micro to macro-scale scenarios.
e. For specific mining geometries it is possible to predict likely
seismic event locations and magnitudes.
Failure Criterion
Modifications to 2021 criterion
Kersten [1] proposed a failure criterion based on curve fitting to laboratory strength test data for various rock types, (Figure 1). The current discussion expands the basic principle to a dimensionless format to make it universally applicable.
Figure 1:Plot of strength curves for Granite, Pyroxenite, Norite, Anorthosite, Chromitite and Limestone.

The curves can be represented by either a linear or power function.
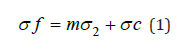
Where σf=failure strength
σ2=minimum principal stress
m=slope of curve
σc=Uniaxial compressive strength
Equation 1 defines a linear curve while the non-linear portions
in Figure 1 can be simulated by using a power function:
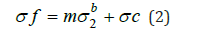
Where b=controlled variable.
To obtain a dimensionally balanced equation, equation 2 can
re-written as
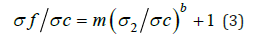
Figure 2 are strength curves obtained using equation 3 with controlled variable/constants for the rock types shown in Table 1.
Figure 2:Dimensionless plot of functional relationship between the failure strength and the confining stress in terms of the uniaxial compressive strength.

Table 1:Values of derived controlled variables for various rock types.

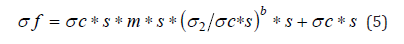
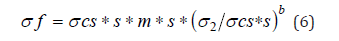
Multiplying by the uniaxial compressive strength equation 3 can be rewritten as:
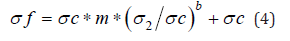
Figure 3 is a comparative plot of laboratory results and those predicted using equation 4 showing good correlation with the measured data based on apparent uniform constants indicating an underlying unifying mechanism; the fit is acceptable for all practical purposes. The above data is based on selected intact rock specimen and for underground application a strength reduction due to rock mass discontinuities must be incorporated in the same manner as used in the Hoek-Brown failure criterion by a “GSI” factor.
Where s=“GSI” factor.
Deformation after failure is accommodated in equation 5 by
reducing the “uniaxial strength” value. (Associated flow rule)
Where σcs=post failure strength
Figure 3:Plot of Laboratory results compared to predicted strength values using equation 4, a. for Granite, Pyroxenite and Norite. b. Anorthosite, Chromitite, and Limestone.

This equation was calibrated for pillar geometries, Kersten [2], and additional calibrations are required for universal application. The current study is partly prediction as well as calibration. The b value appears to be a function of the coefficient of friction used in the Mohr envelope failure criterion defined by:
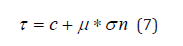
where τ=Shear stress
c=cohesion
σn=Stress normal to failure surface
μ=coefficient of friction
Equation 7 can be rewritten as:
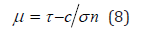
Using the c and ψ values (Mohr-Coulomb parameters) from the laboratory data, a plot of the “coefficient of friction” for the Bushveld rocks are shown in Figure 4. An inversion of the “coefficient of friction” occurs at a k ratio of .03 due to the increase in the coefficient of friction, or due to increase in the stress normal to failure surface with the coefficient of friction remaining constant or a change in the failure mechanism. For the present discussion it is concluded that the failure mechanism changes; two failure mechanisms appear to be active, the classic Griffith criterion and an apparent complex compression mechanism.
Figure 4:“Coefficient friction” for igneous rocks at various k-ratios.

Fracture orientation
Figure 5 summarises the classic Griffith criterion, Hoek et al. [3,4] and its limiting value at a k-ratio (minimum/maximum principal stress) of .03. Beyond this value the original or modified Griffith criterion is not applicable anymore; the failure mechanism still follows the critical/optimum stress orientation of the microcrack, but crack coalescence cannot be based on induced wing cracks. Figure 5a depicts the essence of the generally accepted Griffith failure criterion for calculating the orientation of the optimum/critical angle of a microcrack. Figure 5b illustrates the failure mechanism due to induced tensile failure at the crack tips creating secondary fractures with lengths given in Figure 5c. Note that the length of the induced tensile crack reduces to zero and an alternative process takes over; the optimum crack orientation stays the same but the relative displacement in the microcrack surfaces is apparently reduced by the increase in the frictional resistance causing a change in the fracture mechanism and the resulting fracture appearance. Figure 6 illustrates the difference in fracture appearance with the change in k ratio at 0.03.
Figure 5:The three main concepts in determining the fracture initiation, wing crack formation and length for k-ratios below .03, [3].

Figure 6:Change in fracture mechanism with change in k-ratio.

Fracture coalescence
Zao-Wei et al. [5] summarised the findings of at least 300 papers on crack coalescence concluding with a listing 8 different options that could be used but none of them are of immediate practical application. In the current discussion it is postulated that micro-fractures coalesce if and when the critical composite, wingcrack micro-crack orientation coincides with the orientation of the strength/stress contour=1.
Figure 7a illustrates the generally accepted wing crack extension based on the Griffith criterion postulated for a random crack orientation expected in a rock specimen indicating the most likely length of wing crack extension. Figure 7b shows the critically orientated cracks only. Note that the conjugate system is included in the diagram. Superimposed on the crack array two contours are drawn depicting the strength/stress ratio=1. When the contour cuts across the optimum micro/wing crack orientation, contour b, no coalescence is possible. Strength contours a is parallel to the critical composite which can now interact with the adjacent configuration resulting in microcrack coalescence resulting in a fracture plane.
Figure 7:7a presents an array of randomly orientated micro-cracks with the most likely length of wing cracks for the various orientations. 7b the optimum crack orientation in terms of the stress distribution and orientation with 2 superimposed contours of the strength stress=1.

Micro-crack coalescence/extension must satisfy:
a) A stress/strength ratio<=1 and
b) The contour of strength/stress<1 must be parallel to the
orientation of the critical crack composite
Figure 8:Fracture terminology and abbreviations.

This concept is fundamental for crack coalescence/extension to occur. The failure mechanism, discussed above, changes above a k-ratio of 0.03. The frictional resistance will increase and stress changes in the sidewalls of these microcracks increases substantially. Inspection of rock burst fractures indicates that at least three fracture types can be identified, with a possible fourth one. This aspect requires further investigation but for the present discussion the fractures in Figure 8 will be the basis for the current paper.
Summarising, three fracture systems can develop:
i. For k=0 the fracture angle will be the same as the maximum
principal stress, symbol of T, pure tension.
ii. For a k ratio from 0 to .03 the angle will increase from 0° to 25°.
Symbol TI, tensile induced.
iii. k-ratio in excess .03, angle remains constant, symbol C1 and
C2, conjugate fractures.
Composite fracture diagram
In summary, for macro-fracturing to occur 3 basic parameters
have to be satisfied.
a. The strength/stress contours using equation 4 or 5.
b. The stress orientation of a critical microcrack for both
conjugate fracture orientations.
c. The strength stress contour and the critical crack orientation
must coincide.
Figure 9 is a composite diagram of:
A grid of the optimum orientation of discontinuities/
microcracks for a conjugate system, C1 and C2.
i. The strength/stress contour=1
ii. Superimposed are 5 different predicted schematic fracture
geometries.
Figure 9:Schematic presentation of fracture coalescence for changes in angle between the strength contour and the optimal stress orientation. k ratio in excess of .03. Note that the grid patterns are that of C1 and C2.

Geometries 1 and 2: Microcracks will initiate but cannot coalesce in the optimal direction and will terminate on the strength curve. As the strength curve continues to extend upwards, microcracks of limited extent will be created resulting in weaker/softer material without obvious fracture zones, “Failed” region. In geometry 3 the microfractures can coalesce in the direction of the optimal orientations creating fracture zones of limited extent creating an off-set pattern. Geometry 4 illustrates the coincidences of the optimum orientations with the strength contour over extended length and a narrow resulting in a narrow and extended failure surface. Geometry 5 fractures are created the same as In off-set geometry 3 but in the opposite orientation. Figure 10 illustrates the effect of a slight variation in the stress/strength curve orientation the fracture pattern is changed significantly. All of the above geometries can have mirror images creating an apparently greater number of possible configurations.
Figure 10:Schematic change in fracture propagation/coalescence with small changes in the difference between the strength stress contour and the optimum failure surface. k ratio in excess of .03.

Figure 11:Synthesis of the orientation of fracture sets within a burst fracture.

The fracture process described above is scale independent; it reflects the process from microcrack scale to tectonic deformation; the mechanism remaining the same. Small fractures create bigger fractures with increase and consistency of the loading system. Figure 11 is picture of a burst fracture with an associated schematic copy as well as the definition of the different fractures. The off-set pattern has two causes:
i. The vertical crack, TI, is parallel to the maximum principal
stress indicating that the k ratio is in the region between 0 and
.03.
ii. Two initial microcracks C1 are connected by a set of C2.
iii. The divergence between the strength/stress contour and the
optimum crack orientation creates a wider intermediate zone
between two C1 cracks/fractures.
The basic pattern is fundamental to all fractures created at k-ratios in excess of .03. The transition between brittle to plastic failure is deemed also part of this process but needs some more development.
Application
Elastic model
FLAC2D is used to model a replicating gravity model solving boundary effect problem usually associated with limited areas while gravity loading is more realistic than the initiate or the apply commands. The elastic model sets the background stress levels and ratios required for predicting failure zones around underground excavations. Figure 12 is an overall view of the model with the detail stress values shown in Figure 13, showing the values of a selected portions around the excavation; a 2m wide slot initially 30m in length. The model is bi-symmetrical hence the slot is the half-span of an excavation of 60m and the solid in front of the stope a pillar with a width of 60m, 30+30m. The rapid changes in the principal stresses and the increase in shear stresses in the immediate face positions results in the creation of different fracture types and orientations over short distances. Also note the significant changes in the k-ratio, minimum/maximum principal stress, (Figure 13c).
Figure 12:Overall view of the model with stope at 2000m below surface. With horizontal displacement fixed on the vertical axis creating twofold symmetry, half stope span with pillar on right hand side.

Figure 13:Stress distribution around a stope with span of 60m at 2000m below surface under gravity loading. From top to bottom maximum principal stress, minimum principal stress, shear stress and stress orientation.

To keep the model simple assumptions made were:
a) The rock is massive; no bedding planes or joints are present.
b) The effect of changes in the shear and bulk moduli due to
failure is not included.
c) No associated flow rule is considered for the tensile regions.
All the above do not fall in fatal flaw category and can be incorporated as soon as it is shown that the proposed methodology merits refinement. The main disadvantage is that the solution for the different stope geometries do not recognise the previous failure zone.
Fracture types
Figure 14 is a close up of the individual predicted fracture geometries with increase in the stope span. The optimum orientation of the conjugate fracture systems is calculated in the FLAC2D program and contours can be drawn but are not easy to visualise, instead the main components affecting the fracture orientation, the k-ratio, strength/stress contour and the principal stress orientations are used in an attempt to illustrate the resulting fracture orientation. The superimposed fracture surfaces based on an approximate angle of plus or minus of 250 to the principal stress orientation. (The data is accessible for every grid-point in the FLAC2D program, and the schematic orientations given in Figure 14 can be plotted in detail, but the combination thereof is beyond the programming capability of the author and needs to be included in the program). The predicted patterns have been observed extensively in the mines, and it is concluded that the simplistic FLAC2D program be improved.
Figure 14:Extent of strength/stress ratio <1.0 with most likely fracture orientations for 30, 40 and 52m stope.

Associated seismicity
Due to rapid changes in the stress orientation, stress magnitudes and k-ratios different fractures will be formed in the immediate vicinity of the stope face. Most of the fractures will have a limited length and change in orientation. This has been observed in all of the mines and is well documented. What is also well documented is the intensity of micro-seismicity in the immediate vicinity of the stope face. It is concluded that all fracturing will be associated with seismicity, (acoustic emissions in specimen), and that the magnitude of the seismic event is dependent on the extent of individual fracture coalescence; the greater the coincidence between the orientation of the strength/stress contour=1 and the critical crack orientation, the greater the seismic emission. Kersten [6] described a stress/failure setting that seemed to indicate that rock bursts, mine induced, can be predicted. Figure 15 is a copy of a mine plan, Ortlepp [7], showing the face positions and observed burst fractures.
Figure 15:Regularity of burst fractures at ERPM gold mine, [7].

The regularity is impressive indicating that the mechanism discussed is applicable; the longer the coincidence between the strength/stress curve and the optimum crack orientation the greater the seismic emission. The implication is that the seismic/ acoustic emissions are a function of the fracture length, or area in three dimensions. The data for calculating the individual length’s, areas, in conjunction with the value of σn (i,j) the seismic moment can be calculated and the “micro-seismic” activity in the immediate vicinity, and further afield, can be simulated.
Summary and Conclusions
The initial failure criterion was calibrated using detailed pillar geometries and results predicted the failure zones as observed, Kersten [2]. With the modifications it is concluded that it can be applied to all types of excavations. The predicted fracture geometries mirror observations made in numerous mines and different settings including the occurrence of burst fractures in deep level mines. Kersten [8] assigned fractures around stopes into three categories, class I, II and III based purely on observation of surface characteristics and orientations. Ortlepp [7] also gives excellent descriptions of burst fractures which coincide with the third type of setting.
In summary:
a. Failure for k-ratio close to zero results in induced tensile stress
fractures parallel to the maximum principal stress.
b. Failure for k ratio in excess of 0 to a value of .03 following the
classic Griffith theory of brittle failure.
c. For a k-ratio in excess of .03 compression is the driving
mechanism.
The fractures produced in the Brazilian test are a good example of class I while the class II fracture is defined by the Griffith fracture criterion. Class III fractures are best described by the class III. All of these can now be predicted in terms of magnitude and orientation in detail around underground excavations.
The main deficiencies in the proposed methodology that can influence the results are:
A. The failure criterion is “parachuted” into an elastic model,
and each individual step does not incorporate the effect of the
previous mining step. The result is that maximum principal
stress only is changed while the stress orientation, hence
optimum crack orientation is as for an elastic medium. The
k-ratio given is a function of the modified maximum principal
stress while the minimum is still the elastic solution. Fracturing,
however, occurs on the leading edge of the failure zone; at
values closest to the elastic solution hence the results obtained
are deemed representative enough and the conclusions drawn
not invalidated. The results are promising enough that this
deficiency needs to be corrected by someone with a better
knowledge of FLAC2D programming.
B. The value of the bulk and shear moduli need to be adjusted as
fracture zones develop.
References
- Kersten RWO (2021) An alternative brittle failure criterion and methodology for predicting fracturing around underground excavations. Aspects in Mining & Mineral Science 8(1):
- Kersten RWO (2025) AfriRock conference Pillar workshop. Sun City, South Africa.
- Hoek E, Bieniawski ZT (1968) Brittle rock fracture propagation in rock under compression. South African Council for Scientific and Industrial Research Pretoria, South Africa.
- Hoek E, Martin CD (2014) Fracture initiation and propagation in intact rock-A review. Journal of Rock Mechanics and Geotechnical Engineering 6(4): 287-300.
- Wang ZW, Li DA, Zong YF, Liu YK, Shar YN (2024) Review of experimental, theoretical and numerical advances in multi-crack fracture mechanics. Mathematics 12(24): 3881.
- Kersten RWO (2006) Rock burst fracture; A unique example of fracture initialization and propagation. RASIM 6, Perth.
- Ortlepp WD (1999) Observation of mining induced faults in an intact rock mass at depth. ISRM 37(2000).
- Kersten RWO (1969) Structural analysis of fractures around underground excavations on a Witwatersrand gold mine. MSc thesis. Pretoria, South Africa.
© 2025 R W O Kersten. This is an open access article distributed under the terms of the Creative Commons Attribution License , which permits unrestricted use, distribution, and build upon your work non-commercially.
Editor In Chief


.jpg)


Signup for Newsletter

Quick Links
 Editorial Board Registrations
 Submit your Article
 Refer a Friend
 Advertise With Us
Our Recent Edition

.jpg)


Top Editors


.jpg)


.bmp)
.jpg)
.png)
.jpg)


.jpg)


.png)

.png)


.png)


Financial Support

Sponsors

Latest e-Books

Latest Video

 a Creative Commons Attribution 4.0 International License. Based on a work at www.crimsonpublishers.com.
Best viewed in
a Creative Commons Attribution 4.0 International License. Based on a work at www.crimsonpublishers.com.
Best viewed in