
- About Us
- Information
-

The Author ensures that the research has been conducted responsibly and ethically with adherence to all relevant regulations. read more..
- For Authors
- For Reviewer
- Manuscript Guidelines
- Membership
- Publication Ethics
-
- Journals
- Reprints
- e-Books
- Videos
- Policies
- Contact Us
 COVID-19
- Submissions


Full Text
Aspects in Mining & Mineral Science
An Alternative Brittle Failure Criterion and Methodology for Predicting Fracturing around Underground Excavations
Rudiger Kersten*
Westdene, Johannesburg, South Africa
*Corresponding author: Rudiger Kersten, 10 Banbury Road, Westdene, Johannesburg, South Africa
Submission: November 05, 2021;Published: November 18, 2021

ISSN 2578-0255Volume8 Issue1
Abstract
The modified Griffith fracture initiation criterion and other failure criteria were used, from the late 1960 to the present for predicting, or attempting to, the extent and orientation of fractures in the hanging wall of deep level stopes. Because of the apparent problematic nature of solving the fracture propagation part of the criteria, the search for alternative failure criteria were then pursued along the empirical route of which the now in common use Hoek-Brown criterion was developed. The extent of fracturing is predicted but the lack of predicting the orientations and extension of induced fractures around underground excavations prompted the re-examination of the failure process. It was found that a failure criterion requires the input of the strength, the orientation of the maximum principal stress as well as the associated orientation of the newly created macro-crack. The paper describes a theoretical framework by which it is possible to determine the data required for fracture coalescence as well as proposes an associated empirical failure criterion. The results obtained using the proposed failure criterion compare well with results obtained using the Hoek-Brown criterion while the fracture propagation model predicts the orientation of observed fracture patterns. The use of the methodology is illustrated by comparing FLAC generated fracture zones for a circular specimen, a pyroxenite pillar and a preliminary comparison with measured stope fractures.
Keywords: Underground; Mining; Micro-crack; Geological
Introduction
The modified Griffith fracture initiation criterion came to the fore in the South African mining industry after the publication by Hoek & Bieniawski [1]. Over the last 50 years hundreds of additional papers have been published on the subject but in spite of intensive research it is still not possible to accurately predict observed fracture pattern around underground excavations. For example, from 1969 until 1990’s, intensive research on fracturing around tabular excavations was conducted by the Chamber of Mines Research Organization, summarized by Napier et al. [2] with the result shown in Figure 1. The method does predict the possible extent of the fracture zone but cannot be used to predict the individual failure surfaces generally observed around excavation. Adams et al. [3] gives a description of the fracture types and distribution around deep level stopes but does not propose a method for predicting them. Brummer [4] summarized fracture observations and measurements to create a generic fracture pattern, not a prediction but a composition, which he used to incorporate the non-linear effect to calculate stresses and rock mass deformation around tabular excavations. Numerous experiments and analogue models of micro-cracks have been investigated and reviewed over the last 30 years [5] but the results obtained cannot be used to predict fractures observed underground. A review by Lisjak [6] lists the various discrete modelling techniques for fracturing processes and concludes that the rock masses contain discontinuities due to geological processes rendering the modelling thereof problematic.
Figure 1: Simulation of fracture pattern around a 1m wide stope using multiple versions of DIGS (a) homogeneous rock mass (b) rock mass with bedding planes [2].

The Hoek-Brown failure criterion is the most widely used method to predict failure, but it was found wanting when it was attempted to predict the growth and extent of failure zones [7]. Hoek [8] summarizes the state of the Hoek-Brown failure criterion and discusses alternative promising methods for failure prediction such as the PFC code, also used by Yuanyuan Zhang et al. [9], to simulate the crack growth in basalt. The closest to a prediction of the orientation and density of fractures in the immediate hanging wall of a stope was an attempt by Kersten [10] where he predicted fracture orientations based on early computer simulations of the elastic stress field in the hanging wall of a tabular stope in conjunction with the modified Griffith fracture initiation criterion. It does predict a systematic change in dip values as well as the repetitive, or cyclical, nature which appears to be a function of the average distance at which the stope face advances per blast. Kersten [11] discussed the fracture localization and propagation of a burst fracture where the stress field, relative orientations of a failure contour and the principal stress orientation were combined. The concept of a fracture initiation surface was introduced which, in conjunction with the orientation of the maximum principal stress, can be used to predict the length and orientation of a macrofracture. From the above it is concluded that the prediction of fracture orientation such as pursued by Kersten [10,11] is promising when a failure criterion, fracture coalescence and orientation of the principal stress is combined. The first section deals with the stress distribution and resultant shear stress around micro-crack obtained from laboratory test results, followed by incorporating the creation of wing cracks, their extension and their relative orientation for principal stress orientations and stress ratios for different rock types. The second section proposes an alternative empirical failure criterion for calculating the contours of the failure stress around underground excavations and a compared with the generally accepted Hoek-Brown failure criterion testing its veracity. The third section uses the methodology to predict and compare the fracture growth in a uniaxially loaded specimen, a pyroxenite pillar and fractures in the hanging wall of a deep level stope.
Developing a Methodology to Determine the Angle Between the Fracture Surface and the Maximum Principal Stress
Failure criteria to date do not include the orientation of the
induced fracture except in the initial modified fracture initiation
criterion proposed by Hoek & Bieniawski [1]. The apparent partial
success obtained by Kersten [10,11] included the orientation aspect
and is developed further by elaborating the known parameters
that are necessary for predicting the initiation and the direction of
propagation of a series of micro-cracks which is a function of:
a. The maximum and minimum principal stresses.
b. Cohesion
c. The apparent angle of friction.
d. The tensile strength.
e. The angle between the maximum principal stress and the
orientation of the micro-crack that is most likely to fail as well
as the orientation of the micro-crack/wing crack combination.
f. The angle between the micro-crack extension and the “failure
surface”.
The above parameters, except the last one, can be obtained
from laboratory results of uniaxial and biaxial strength tests
using the commonly available Roclab programme. In the current
investigation similar results are obtained based on the wellknown
equality of the shear stress vs shear resistance for relative
displacement of opposing micro-crack surfaces. Laboratory results
from a suite of Lac du Bonnet granite specimens [8] are used to
illustrate the determination of the required constants. The equality
in equation (1) defines failure initiation and propagation across a
surface/micro-crack; the shear and normal stress are calculated
from the principal stresses at failure for the suite of specimens.
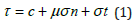
μ=Apparent Coefficient of friction
c=Cohesion.
σt=tensile strength
Equation 1 can be expanded to:
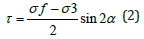
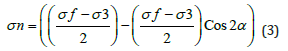
Where σf=Failure stress
σ3=Minimum principal stress
α=Angle between σ1 and potential extended crack
The strength of a specimen is defined by the value of the
principal stress when it reaches its peak value, the failure stress,
used here to prevent confusion when combining the criterion
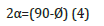
and the stress field in the medium investigated. The value of 2α is
related to the angle of internal friction Ø:
Laboratory results of the stresses at failure reflect the combined effect of the frictional resistance, the tensile strength and the cohesion, equation 5.
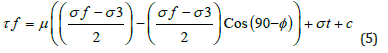
Where τf=Failure shear stress
Incorporating the results of the set of laboratory results and
equations 1 to 5 in a spreadsheet, the values for the required
values of c, σt, Ø can be obtained by varying the unknowns until
equation 1 is satisfied simultaneously for the full data set, Figure
2 is an example for Lac du Bonnet granite. (Because of the large
range for the confining stress, the change in the slope of the Mohr
envelope, the apparent friction angle varies between 510 and 540).
The cohesion is obtained by plotting the Mohr envelope.
Figure 2: Shear and normal failure stress for Lac du Bonnet granite for apparent friction angle of 520, u=1.28.

In summary the relevant input parameters are:
a. Friction angle Ø=52°
b. Cohesion=42MPa
c. Uniaxial Compressive Strength=227MPa
d. Tensile strength σt=7MPa (Estimate).
Data sets for different rock types were analysed in the same
manner with the results shown in Figure 3. Results obtained from
laboratory data for various rock types by the above methodology
are given in Table 1. (The curves are the result of using one value
for the apparent coefficient of friction since the range of confining
stress values is limited to 40MPa.) Summarizing, it is proposed
that the fracture propagation/coalescence process consists of the
following steps:
Table 1: Comparison of internal angle of friction obtained using the alternative method.

Figure 3: Comparative diagrams for 4 rock types. (a) Norite (b) Chromitite (c) Pyroxenite (d) 2 types of sandstone [12].

a. Micro-crack initiation of sliding between opposing surfaces,
τ=μσn
b. Creation of wing cracks at the extremities of the mobilized
section, τ=μσn+σt
c. The coalescence of wing cracks in a specific direction and
τ=μσn+σt+c
d. Extent of crack mobilization is defined by the region where
σ1/σf>1.
To link the above to a crack coalescence and propagation
mechanism, the orientations of the following are required
i. α=Angle between the maximum principal stress and the microcrack
orientation.
ii. ϕ=Effect of k-ratio on the length, hence angle, of wing crack.
iii. γ=Orientation of the maximum principal stress
iv. β=Orientation of the resultant macro-fracture
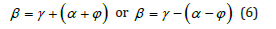
The orientation of the final macro-fracture is a function of:
I. The ratio of the minimum to maximum principal stress, k.
Figure 4 gives the relative length of the induced wing crack in terms
of the k-ratio and the length of the initial micro-crack.
II. The coalescing fracture will have a different overall
orientation than that of the original micro-crack. The extending
wing crack tends towards the orientation of the maximum principal
stress. This orientation,ϕ is a function of the combined wing crack
micro-crack length with a distinct inflection point for a k-ratio of
0.03. For the present initial study the values for ϕ are assumed to
be:
k-ratio> 0.03 φ=α-3
k-ratio< 0.03 φ=α-15
The effect of this assumption is that for low confining stresses
the micro-crack coalescence will tend to be sub parallel to the
maximum principal stress while for higher confinement, the angle
will be closer to the original value α. (The derived power function
becomes unstable wat a k-ratio of 0 and the simplification will
affect the orientation marginally only).
III. Crack coalescence can occur only if there is a similar
crack combination positioned in the direction of their individual
directions which for a conjugate system is:
Figure 4: Extent of wing cracks for various k ratios with a theoretical curve fitted. Average values from data published by Hoek [1]. (Ls Length of wing crack, c length of micro-crack.)

IV. When β is parallel to the σ1/σf=1 contour cracks can coalesce. If the σ1/σf=1 contour does not follow the orientation of either conjugate extended micro-cracks, a macroscopic fracture will not develop. The extent of the parallelism between the σ1/ σf=1 contour and the β orientation will determine the length of the macro fracture; a rock burst fracture being one of the more spectacular examples [11].
Determining the Failure Contour around Underground Excavations
The Hoek-Brown failure criterion is based on derived parameters one of which is the mi value. The determination or basis of this value has been discussed by many authors, to mention some [7,8,12,13] where the general conclusion is that it is difficult to define a definite relationship to other associated parameters in rocks, but it is generally assumed that the value is a function of the tensile strength and the uniaxial compressive strength. Because of this uncertain critical value, it was decided to investigate an alternative empirical failure criterion based on “constants” having a clear functional relationship with results obtained from strength tests. Figure 5 is a plot of the failure stress against the minimum principal stress for three rock types, Lac du Bonnet granite, green sandstone, GSS, [12] and anorthosite. Also shown are curves obtained by fitting a power function to the individual data sets. The basic form of the power equation is:
Figure 5: Failure stress plotted against the minimum principal stress for Granite, Green Sandstone (GSS) and Anorthosite (An).
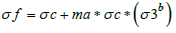
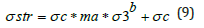
Normalizing the failure strength with respect to the uniaxial compressive strength and plotted against the minimum principal stress for the data sets leads to a simple strength equation:
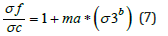
Where σf=Specimen strength
ma=Slope of curve
b=exponent
σ3=Minimum principal stress
σc=Uniaxial compressive strength
Additional sets of strength data were analysed in the same
manner with the results shown in Table 2. It was concluded that the
expression in equation 7 reflects the strength of the specimen tested
and can be used as a failure criterion based on direct derivatives
from experimental data (Figure 6).
Table 2: ma and b values for different rock types. (Green and Red sandstone data from [12], igneous rocks from Bushveld rock data base).

Figure 6: Plot of Strength/Uniaxial compressive strength vs the minimum principal stress for data sets in Figure 5.

Comparison with Hoek-Brown Criterion
The above approach is an empirical process and needs to be compared to alternative criteria. The strength curves obtained from the Hoek-Brown criterion based on laboratory and field data is used for comparison. With the aid of the Roclab programme for the Lac du Bonnet granite, GSI=100, a comparison between the two criteria, the power function, equation 9 and the Hoek Brown criterion, equation 8, is shown in Figure 7.
Figure 7: Comparison between laboratory data, the power function and the Hoek criterion for Lac du Bonnet granite.

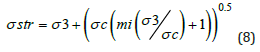
Equation 10 is a function of the value of ma, b and the uniaxial compressive strength.
The result obtained compare well with the Hoek-Brown equation, the main difference is the derivation of “constants” or factors. Both the ma and b value are derived directly from curves obtained from laboratory data, b expressing the nonlinearity excluding the uncertain mi value and tensile strength value required for the Hoek criterion. Additional comparisons are given in (Figure 8) with Hoek’s equation 8, (GSI=100), which depends on the mi value, assuming the s-value=1 and the respective uniaxial compressive strengths.
Figure 8: Comparative curves for granite, green sandstone and anorthosite.

By comparing the two equations the following is of note:
a. The mi value has been the subject of a series of investigations
[12,13] and the consensus is that, generally but not definitely,
mi is obtained by dividing the uniaxial strength by the tensile
strength.
b. The ma value (equation 4) is a direct measure of the slope of
the laboratory data.
c. The non-linearity of the Hoek curve is the square root function
and constant for all rock types while the b value is again a
direct reflection of the rock type tested.
d. Both equations rely on the apparent angle of friction, although
not identical, and the uniaxial compressive strength.
It is concluded that the power function criterion gives comparative results with those obtained by the empirical Hoek- Brown criterion and hence it can be used for practical design procedures. The advantage of the method is its simplicity and the use of well-defined input parameter, the uniaxial strength, ma and b values. The Hoek-Brown criterion has the advantage that it includes the rock mass quality, the geological strength index, GSI, in a complex empirical set of equations. The Hoek-Brown predicted strength values for Lac du Bonnet granite for GSI values for 100, 80 and 60 are compared with equivalent curves using the proposed method with values given in Table 3. The correlation is promising, and additional work is required to formalize the comparative values.
Table 3: Comparative values for the power function simulating the Hoek GSI predictions.

Prediction of the Failure Zone in Specimen, a Circular Excavation and a Pillar
Predicting the fracture zone and the orientation of the induced fractures is achieved by combining equations 6 and 8. FLAC 2D is used to calculate the stress distribution for a Lac du Bonnet granite specimen, 20cm length and 10 cm diameter. The uniaxial strength used in the simulation is 227MPa and a residual strength of 170MPa for the “failed” region (Figure 9). Loading is simulated applying a velocity with increase in the number of steps. The ratios of σf/σ1 contour are plotted for individual nodes for a quarter symmetry of the specimen, (Figure 10). A ratio of more than 1, the blank areas, define the region where existing crack are mobilized; the blank areas increase with an increase in the applied uniaxial stress. Crack mobilization starts at the edge of the specimen and extends with an increase in area towards the centre with a final shape in the fourth slide, (Figure 10). With increase in stress level the “failed” area increases at a much slower rate and stabilizes for a shape expressed in the final slide. The blank area does not mean that all the microcracks that have been mobilized will coalesce and propagate. The orientation of the critical crack, α, is 17.50 and with the k-ratio equal to 0, the wing crack will extend to their maximum if parallel to the maximum principal stress, creating individual subvertical extended micro-cracks, 17.50-140, that can coalesce with similarly oriented cracks, resulting in a sub-vertical macro-crack as illustrated in Figure 11. With improvement in the FISH function the orientation of the cracks for different k-ratios, β=γ+(α-ϕ) or β=γ- (α-ϕ) will propagate (coalesce) where they are parallel to the σf/ σ1 contour. In the example above the maximum principal stress is for all purposes vertical and the k-ratio is less than .03, resulting ϕ being less than 40.
Figure 9: Hoek-Brown strength curves for Lac du Bonnet granite and comparative curves using the proposed method by incorporating the changes in ma, b and UCS values given in Table 2.

Figure 10: Areas of fracture initiation for applied stress levels of 190, 195, 205 and 215MPa shown in red, Lac du Bonnet granite.

Figure 11: Schematic cumulative fracture distribution based on Figure 10 sequence.

The final macro-fracture is the result of the strength difference between the solid cone and the weakened remainder of the specimen, Figure 10. The second example simulates the stress condition in a pyroxenite pillar in a mine at a depth of 800m below surface for which the fracture zone is well defined by borehole observations [7]. The uniaxial strength of 130MPa has been reduced to 90MPa, GSI=85, and a residual strength of 75MPa (Figure 12). The modelled pyroxenite pillar has the same dimensions as those underground including the effect of the hanging wall, (Figure 13). The final width of the fracture zone is again similar to that measured with an interesting development in a corner fracture in the hanging wall, reminiscent of the “guttering” effect observed in the platinum mines. Figure 13 shows the predicted failure zone at increasing stress levels. Failure commences at the top corner of the pillar, extending towards the centre as the stress increases. Simultaneously, a small failure zone is created in the top corner extending in length with stress increase. This failure zone is seldom exposed but of great significance for stability reasons. The predicted failure zones in Figure 13 do not include the effect of the orientation of the principal stress and the σf/σ1=1 contour. Figure 14 is an enlarged picture of the top region illustrating the effect of the orientation difference between that of the β value and the σf/ σ1=1 contour. It clearly shows that micro-crack mobilization will occur but coalescence is prevented by the difference in orientation. The pattern reflects the standard sidewall fractures including the corner fractures generally ascribed to the effect of blasting. The possible vertical fractures are not noticed but reflect the onset of the fracture propagation in the hanging wall for extended spans. The prediction of fracture orientation in the stope hanging wall is controlled by the same requirements as for the two-example given. The main difference is that the stope face advances in regular defined distances explaining the repetitive nature of the measured fractures. In addition, the repetitive action is a semi-dynamic process. Figure 15 is one example where the measured values lie within the limits of 920 and 1120. Super imposed on the measured values are the predicted orientation of conjugate fracture 2 for a distance of 1 to 5m. Since the face advance is of the order of 1 to 1.3m, the intersection of the limiting lines and the distance will define the limits between which the fractures were induced; in this instance 0.3 to 1.3m in front of the stope face. The example must be seen as a preliminary finding and detail of this process requires a separate detailed discussion [14-16].
Figure 12: Uniaxial compression failure of granite. From [15].

Figure 13: Predicted failure zone for Impala pyroxenite pillar for 68, 95, 125 and 165MPa.

Figure 14: Likely fracture formation (Heavy lines) in sidewall and in corner with possible development higher in the hanging wall. Note the difference in the failure and fracture orientation in the hanging wall.

Figure 15: Measured dip of fractures in stope hanging wall with superimposed limits derived using the proposed methodology.

Summary and Conclusion
The paper proposes a theoretical framework/methodology for predicting the initiation and coalescence of micro-cracks and defines the conditions under which this can occur. In conjunction with a simplified empirical failure criterion encouraging results are obtained when using simplistic models using the methodology. The prediction of the fracture development in the hanging wall of stopes is now possible but requires a separate paper because of its complexity. The underlying assumption throughout the discussion is the presence of randomly orientated micro-cracks. This assumption is valid for all granular material either sedimentary or crystalline. The latter also including the presence of cleavage plane orientations for individual minerals. The random orientation can be altered by tectonic or sedimentary processes, but these will be apparent when evaluating the material and provision can be made for the anisotropic response. It is concluded that the results are promising enough, and additional work is required refining the model with the aid of extensive software development that can simulate the process more effectively than those used in the illustrative examples.
Acknowledgement
The assistance of Peter Cundall given in the creation of the FISH function and Itasca for making available a temporary license for the use of FLAC 2D 8.1 is appreciated.
References
- Hoek E, Bieniawski ZT (1965) Brittle fracture propagation in rock under compression. International Journal Fracture Mechanics 1(3): 137-155.
- Napier JAL, Daehnke A, Dede T, Hildyard MW, Kuijpers JS, et al. (1997) Quantification of stope fracture zone behaviour in deep level gold mines. Journal South African Inst Mining and Metallurgy 97(3).
- Adams GR, Jaeger AJ, Roering C (1981) Investigations of rock fracture around deep level gold mine stopes. Proceedings of the 22nd US Symposium on Rock Mechanics. Massachusetts Institute of Technology, USA.
- Brummer KR (1987) Fracturing and deformation at the edges of tabular gold mining excavations and the development of numerical model describing such phenomena. PhD Thesis, Rand Afrikaans University, Johannesburg, South Africa.
- Cao R, Cao P, Lin H, Fan X, Zhang C, et al. (2019) Crack initiation, propagation, and failure characteristics of jointed rock or rock-like specimens: A review. Advances in Civil Engineering.
- Lisjak A (2014) A review of discrete modelling techniques for fracturing processes in discontinuous rock masses. Journal of Rock Mechanics and Geotechnical Engineering 6(4): 301-314.
- Kersten RWO (2015) A probabilistic structural design process for bord and pillar workings in chrome and platinum mines in South Africa. PhD Thesis, Univ Witwatersrand, South Africa.
- Hoek E, Martin CD (2014) Fracture initiation and propagation in intact rock-A review. Journal of Rock Mechanics and Geotechnical Engineering 6(4): 287-300.
- Zhang Y, Shao Z, Wei W (2019) PFC simulation of crack evolution and energy conversion during basalt failure process. Journal of Geophysics and Engineering 16(3): 639-651.
- Kersten RWO (1969) Structural analysis of fractures around underground excavations on a Witwatersrand gold mine. MSc Thesis, Univ Pretoria, South Africa.
- Kersten RWO (2005) Rock burst fracture; A unique example of fracture localization and propagation. RASIM6, Rock Burst and Seismicity in Mines, Perth, Australia.
- Wei L, Liu Q, Liu X (2018) An improved crack initiation stress criterion for brittle rock under confining stress. 2nd International Symposium on Resources Exploration and Environment, IOPF Conference Series 170.
- Zhang Q, Zhu H, Zhang L, Ding X (2012) Effect of micro-parameters on the Hoek-Brown strength parameter Mi for intact rock using particle flow modelling. American Rock Mechanics Assoc. Chicago, USA.
- Gonzalves da Silva BM (2009) Modelling of crack initiation, propagation and coalescence in rocks. MSc Thesis, Massachusetts Institute of Technology, USA.
- Konietzky H, Fruewirt T (2018) Overview about damage condition of brittle rocks. Internal Publication, Freiberg Geotechnical Institute.
- Roberts D (2017) Calibration of numerical model for bore-and-fill mining. JSAIMM 117(7).
© 2021 Rudiger Kersten. This is an open access article distributed under the terms of the Creative Commons Attribution License , which permits unrestricted use, distribution, and build upon your work non-commercially.
Editor In Chief


.jpg)


Signup for Newsletter

Quick Links
 Editorial Board Registrations
 Submit your Article
 Refer a Friend
 Advertise With Us
Our Recent Edition

.jpg)


Top Editors


.jpg)


.bmp)
.jpg)
.png)
.jpg)


.jpg)


.png)

.png)


.png)


Financial Support

Sponsors

Latest e-Books

Latest Video

 a Creative Commons Attribution 4.0 International License. Based on a work at www.crimsonpublishers.com.
Best viewed in
a Creative Commons Attribution 4.0 International License. Based on a work at www.crimsonpublishers.com.
Best viewed in