

- About Us
- Information
-

The Author ensures that the research has been conducted responsibly and ethically with adherence to all relevant regulations. read more..
- For Authors
- For Reviewer
- Manuscript Guidelines
- Membership
- Publication Ethics
-
- Journals
- Reprints
- e-Books
- Videos
- Policies
- Contact Us
 COVID-19
- Submissions



Full Text
Strategies in Accounting and Management
Lagged Cross Correlations analysis between China’s GDP quarterly Growth (2016-2025) and NPL Ratios
Xixi Feng* and Xueyi Guo
College of Accounting, Chengdu College of Arts and Sciences, Chengdu, 610401, China
*Corresponding author:Xixi Feng, College of Accounting, Chengdu College of Arts and Sciences, Chengdu, 610401, China
Submission:August 31, 2026Published: November 02, 2026

ISSN:2770-6648Volume6 Issue 4
Abstract
This study examines the lagged cross‑correlations between China’s quarterly GDP growth and Non‑Performing Loan (NPL) ratios of large commercial banks and rural commercial banks over the period 2016Q1-2025Q4. Using 40 quarterly observations, we find fundamentally distinct response patterns across bank types. Large commercial banks exhibit their strongest negative correlation with GDP contemporaneously (*r*=-0.61), with the magnitude steadily decaying over subsequent quarters, indicating a real‑time monitoring capacity and strong risk absorption. In contrast, rural commercial banks display a hump‑shaped lag structure, with the correlation peaking at a two‑quarter delay (*r*=- 0.53), reflecting slower cash‑flow cycles of small and medium enterprises and agricultural borrowers, extended delinquency recognition windows, and protracted collateral recovery processes. The correlation magnitudes cross over between the two groups-large banks dominate at lag‑0, but rural banks become more sensitive by lag‑2, revealing a sequential “trickle‑down” risk transmission from large enterprises to downstream regional borrowers. Moreover, rural banks maintain persistently higher correlations even at lag‑3 (*r*=-0.49), underscoring weaker loss‑absorption capacity and longer‑lasting impairment effects. These findings provide quantifiable lead‑time signals for macro‑prudential supervision: a spike in large‑bank NPLs can serve as an early warning for future rural‑bank asset deterioration, with approximately a two‑quarter window for pre‑emptive counter‑cyclical policy interventions.
Keywords: Non‑performing loans; GDP growth; Lagged cross‑correlation; Rural commercial banks; Macro‑prudential policy
Introduction
A consistent finding across all reviewed works is the statistically significant negative correlation between GDP growth and NPL ratios. Using system GMM on 53 RCBs, He [1] show that lower regional economic development elevates NPLs, while Zhu et al. [2] find that agricultural output growth actually reduces RCB risk. Similarly, Ying [3], applying cointegration and Granger causality tests on UCB data, confirms a long run negative relationship and bidirectional causality. Qiu [4] and Yue [5] both employ panel models and VAR, respectively, and conclude that macroeconomic slowdowns worsen bank asset quality, with the latter further noting that NPL fluctuations can constrain economic growth-hinting at a feedback loop. Methodologically, the studies vary from dynamic panel GMM He [1]; Zhu et al. [2] and fixed effects panel Xu [6] to VAR Yue [5], cointegration Ying [3], and stress testing frameworks (the 2023 provincial UCB study). Xu’s [6] master’s thesis explicitly tests heterogeneity across bank types, revealing that the impact of macro variables differs significantly between state owned, joint stock, UCBs and RCBs. The Sha County RCB case study [7] uses a regional regression with GDP per capita and confirms the negative sign at the local level. Song et al. [8] introduce an innovative network DEA approach, demonstrating that economic growth reduces bank risk via lower loan to capital ratios, and they find that UCBs and joint stock banks exhibit higher risk levels than large state-owned banks-consistent with He’s [9] doctoral research, which showed that GDP growth significantly affects credit risk for both states owned and UCBs.
Regarding bank type differences, the literature suggests that UCBs are more vulnerable to aggregate industrial cycles, whereas RCBs are more sensitive to local real estate and agricultural income shocks. The 2023 provincial UCB study and Ying [3] both highlight the pronounced impact of GDP on UCB asset quality, while He [1] emphasize that RCBs are disproportionately affected by property market corrections-a channel distinct from pure GDP slowdown. Nevertheless, all studies agree on the fundamental negative association. Despite the robust consensus, several gaps remain. Most studies rely on aggregate provincial or national data, lacking granular firm level or loan level information. Few explore nonlinear threshold effects or the role of local government debt and fiscal policy in mediating the GDP NPL link. Additionally, dynamic interactions between monetary policy, regulatory capital requirements, and NPL recognition practices are under examined. Future research should adopt disaggregated regional data, incorporate structural breaks (e.g., the COVID 19 pandemic), and use nonlinear models to capture threshold effects. Policy wise, the heterogeneous responses imply that macroprudential tools should be tailored to bank type-tightening supervision on UCBs during booms and supporting RCBs during local downturns. Overall, this review confirms that GDP growth is a pivotal determinant of NPLs in both rural and urban Chinese banks, but the transmission mechanisms and policy implications warrant deeper investigation.
Data
This section presents the empirical analysis of the quarterly Non-Performing Loan (NPL) ratios for large commercial banks and rural commercial banks in China, together with the quarterly GDP growth rate, over the period from 2016Q1 to 2025Q4. The dataset comprises 40 quarterly observations. All variables are expressed in percentage terms. The analysis proceeds with descriptive statistics, contemporaneous and lagged correlation analyses, and a robustness check excluding extreme GDP observations [10].
Descriptive Statistics
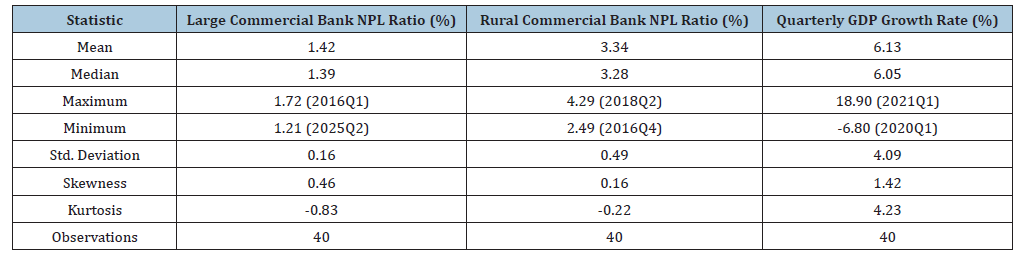
Table 1 reports the summary statistics. Over the full sample, the average NPL ratio of large commercial banks is 1.42%, with a narrow range from 1.21% (2025Q2) to 1.72% (2016Q1) and a standard deviation of 0.16 percentage points, indicating a stable downward trend over time. In contrast, rural commercial banks exhibit a higher average NPL ratio of 3.34%, with greater volatility (std. dev. = 0.49 p.p.), ranging from 2.49% (2016Q4) to 4.29% (2018Q2). The quarterly GDP growth rate averages 6.13% but shows considerable fluctuations (std. dev. = 4.09 p.p.), with a minimum of -6.8% (2020Q1) and a maximum of 18.9% (2021Q1), reflecting the impact of the COVID 19 pandemic and the subsequent base effect. The skewness and kurtosis measures indicate that GDP is right skewed and leptokurtic, while both NPL series are roughly symmetric and platykurtic.
Table 1:Descriptive statistics of key variables (2016Q1–2025Q4).
Trend inspection
Visual examination of the time series reveals that large commercial bank NPLs have steadily declined from 1.7% in early 2016 to about 1.2% by the end of 2025, showing little sensitivity to short term GDP fluctuations. Conversely, rural commercial bank NPLs rose persistently from 2016 to a peak of over 4% in 2018- 2019, remained elevated during the 2020 pandemic period, and have gradually decreased thereafter, though they still stand well above the level of large banks. This suggests a possible counter cyclical behaviour, especially for rural banks, but with a lagged response to economic downturns.
Contemporaneous correlation analysis
Pearson correlation coefficients were computed for the full sample (Table 2). The NPL ratio of large commercial banks is moderately negatively correlated with GDP growth (r=-0.61, p<0.001). The correlation between rural commercial bank NPLs and GDP is also negative but weaker (r=-0.42, p=0.007). The two NPL series are positively correlated with each other (r=0.57, p<0.001), though their long term trends diverge. To mitigate the influence of extreme values, Spearman’s rank correlations were also estimated, yielding similar results (-0.58 and -0.35, respectively), confirming the negative association.
Table 2:Contemporaneous Correlation Matrix (Full Sample, n = 40).

Notes: *p < 0.05; **p < 0.01; **p < 0.001. Pearson correlation coefficients are reported. Spearman’s rank correlations for Large Bank–GDP and Rural Bank–GDP are –0.58 and –0.35, respectively, confirming the negative association.
Lagged cross correlations analysis
Given the potential delay in the recognition of credit deterioration, we computed cross correlations between GDP growth (leading) and NPL ratios at lags of one, two, and three quarters (Table 3). For large commercial banks, the contemporaneous correlation is the strongest (–0.61), and the magnitude declines gradually with longer lags (-0.55 at lag 1, -0.48 at lag 2, -0.41 at lag 3). This pattern implies that large banks’ asset quality responds promptly to current economic conditions, possibly due to their more diversified and higher quality loan portfolios. For rural commercial banks, however, the peak negative correlation occurs at a lag of two quarters (r = -0.53), compared with -0.42 contemporaneously and -0.48 and -0.49 at lags 1 and 3, respectively. This lagged effect is consistent with the typical delay in the impairment of loans to small enterprises and agricultural sectors, which are more vulnerable to economic slowdowns with a time lag.
Table 3:Cross-correlations between GDP growth (Leading) and NPL ratios at different lags.

Notes: All reported coefficients are Pearson correlations. The strongest negative correlation for rural banks appears at a 2-quarter lag, indicating a delayed response to economic downturns.
Results
Insight 1: Divergent response speeds – “real time monitor” vs. “delayed echo”
The most striking difference lies in the peak correlation timing. For large commercial banks, the strongest negative association occurs contemporaneously (lag 0, r=-0.61) and monotonically weakens as the lag extends (-0.55 → –0.48 → -0.41). This pattern implies that large banks’ asset quality is an almost coincident economic indicator. The rationale is twofold: (i) their loan portfolios are heavily concentrated in large state owned enterprises (SOEs) and manufacturing sectors that are directly and immediately exposed to cyclical demand fluctuations; (ii) these banks employ sophisticated, forward looking risk management systems (e.g., expected credit loss models under IFRS 9) that recognize impairment signals promptly as macro conditions evolve. For rural commercial banks, the correlation strengthens over time, peaking at a two-quarter lag (r=-0.53) and only then declining slightly (-0.49 at lag 3). This “delayed echo” reflects structural rigidities: rural banks primarily serve Small and Medium Enterprises (SMEs), agricultural households, and local government related projects. These borrowers have longer cash conversion cycles and weaker financial reporting standards. Moreover, rural banks often engage in grace period forbearance or utilize government guarantee schemes that temporarily mask deterioration during the first few months of an economic slowdown. Consequently, the true credit deterioration materializes only after two quarters of sustained GDP weakness, when working capital buffers are exhausted..
Insight 2: Divergent decay patterns – “risk absorption” vs. “loss recognition”
Large banks: The absolute value decreases steadily from 0.61 to 0.41 over four quarters (a drop of 0.20). This rapid decay suggests that large banks have strong risk absorption capacitiesthrough diversified portfolios, ample provisioning, and access to capital markets-which allow them to contain the spill over effects of a GDP shock within a relatively short horizon. After one year, the residual correlation is modest, implying that the initial shock has been largely provisioned for or offset by non interest income.
Rural banks: The correlation rises from 0.42 to a peak of 0.53 (lag 2) and then declines only slightly to 0.49 (lag 3). This hump shaped (or inverted U) pattern is highly informative. The rising segment (lag 0 to lag 2) reflects the gradual recognition cascade: overdue loans migrate to non performing status after 90 day delinquency windows, collateral valuations lag behind market prices, and legal repossession processes are protracted. The mild decline after lag 3 (0.53 → 0.49) can be attributed to two opposing forces: (i) some loans are eventually written off or restructured (cleaning the book), and (ii) if the economy recovers by the third quarter, the worst-case scenario does not fully materialize. However, the persistence of a relatively high correlation (-0.49) even at lag 3 indicates that rural banks carry the scars of a GDP shock for a much longer period, reflecting lower recovery rates on impaired collateral (e.g., rural land, agricultural machinery) and weaker workout capabilities.
Insight 3: “Role reversal” in risk exposure across the economic cycle
At lag 0, large banks exhibit a much stronger GDP sensitivity than rural banks (-0.61 vs. -0.42). This suggests that in the very short term, large banks are the primary “transmission belt” of macroeconomic stress-their blue-chip corporate clients immediately adjust production and investment, affecting debt servicing capacity. However, by lag 2, the situation completely reverses: rural banks become more sensitive (-0.53 vs. -0.48). This crossover reveals a sequential risk exposure pattern: an economic downturn first hits the large enterprise/export-oriented segment (captured by large banks), and then, after a 6-month transmission lag, the stress permeates downstream supply chains, regional SMEs, and the agricultural sector (captured by rural banks). This “trickle down” risk dynamic has crucial implications: monitoring large bank NPLs can serve as an early warning signal (leading indicator) for future rural bank asset quality, with approximately a two-quarter lead time. In other words, if large bank NPLs spike in Q1, policymakers should expect rural bank NPLs to follow suit in Q3.
Insight 4: Asymmetric sensitivity to GDP growth “regimes”
The two quarter peak for rural banks (-0.53) is not merely a statistical artifact; it points to a nonlinear threshold effect. Rural borrowers typically operate on thin profit margins. A GDP slowdown that persists beyond two consecutive quarters (e.g., from 5% to 4% to 3%) drastically increases their default probability because their cash flow coverage ratio falls below the breakeven point. Conversely, a sharp but one quarter shock (e.g., 2020Q1’s -6.8%) followed by a rapid rebound (2020Q2’s 3.2%) may not produce the full peak impact at lag 2, because government relief policies (loan moratoria, subsidized refinancing) bridge the temporary gap. This explains why the correlation at lag 2 is the maximum: it captures the cumulative fatigue of borrowers enduring a prolonged downturn, rather than a transient dip.
Insight 5: Implications for macro prudential policy and stress testing
The lag structure offers tangible, actionable intelligence for financial regulators
For large banks: Given their contemporaneous correlation, supervisory authorities should employ high frequency macro indicators (e.g., PMI, industrial production, export orders) to update stress test scenarios on a monthly rather than quarterly basis. A drop in GDP growth in the current quarter should trigger immediate, targeted portfolio reviews in cyclical industries (e.g., real estate, heavy manufacturing).
For rural banks: The two-quarter lag provides a policy window. If GDP growth decelerates in Q1 (e.g., from 5.0% to 4.5%), regulators have roughly two quarters to proactively deploy counter cyclical measures-such as increasing targeted reserve requirement relief, expanding collateral eligibility, or facilitating distressed asset transfers to asset management companies-before the NPL ratio peaks in Q3. Ignoring this lag would lead to reactive, crisis driven interventions, whereas exploiting it enables forward looking, pre emptive stabilization.
Dynamic provisioning: The evidence strongly supports the case for sector specific dynamic provisioning rules. Rural banks should be required to build higher general provisions during GDP expansion phases (when r is low) to create a buffer that can be released exactly when the lag 2 correlation peaks, smoothing the pro cyclicality of their lending behaviour.
Conclusion
This research reveals two fundamentally distinct response patterns across China’s banking sector. Large commercial banks exhibit their strongest negative correlation with GDP growth contemporaneously (r=-0.61), with the magnitude steadily decaying over subsequent quarters. This marks them as real‑time barometers of macroeconomic stress, reflecting their direct exposure to large, cyclically sensitive corporates and advanced risk‑detection systems. In stark contrast, rural commercial banks display a hump‑shaped lag structure, with the correlation peaking at a two‑quarter delay (r=-0.53). This lagged response stems from the slower cash‑flow cycles of SMEs and agricultural borrowers, extended delinquency recognition windows, and protracted collateral recovery processes. Critically, the correlation magnitudes “cross over” between the two bank types-large banks dominate at lag‑0, but rural banks become more sensitive by lag‑2. This sequential dynamic implies a trickle‑down transmission path: an initial GDP shock first impairs large enterprises (captured by large banks), and the stress then permeates downstream supply chains and regional borrowers over the following two quarters. Consequently, a spike in large‑bank NPLs can serve as a leading early‑warning signal for future rural‑bank asset deterioration, with a lead time of approximately two quarters.
Beyond timing differences, the persistence of the correlation further distinguishes the two groups. While large banks’ correlation declines sharply from -0.61 to -0.41 over four quarters, rural banks maintain a persistently high correlation (-0.49 even at lag‑3), indicating weaker loss‑absorption capacity, lower recovery rates on impaired collateral, and longer‑lasting impairment effects from a given GDP slowdown. This quantifiable two‑quarter lag offers a critical policy window for pre‑emptive intervention. If GDP decelerates in the current quarter, regulators have roughly two quarters to deploy counter‑cyclical measures-such as dynamic provisioning, targeted liquidity support, or distressed‑asset transfers-before rural‑bank NPLs peak. In essence, Table 3 transcends mere statistical correlation; it narrates the structural heterogeneity of China’s dual‑track credit market, where large banks absorb shocks instantly but recover quickly, while rural banks react with a delayed but more protracted and cumulatively fragile trajectory. This insight transforms GDP growth from a descriptive metric into a forward‑looking, actionable leading indicator for calibrated macro‑prudential supervision.
References
- He JK, Huang DJ (2020) Research on influencing factors of non-performing loan ratio of rural commercial banks based on system GMM. Agricultural Outlook 16(11): 34-40.
- Zhu JM, Wu YX, Yuan WJ (2020) Analysis of influencing factors of non-performing loan ratio of rural commercial banks. Journal of Hebei University of Science and Technology (Social Sciences Edition) 20(2): 10-16.
- Ying HF (2018) An empirical study on economic growth and non performing loan ratio of city commercial banks. Economic Research Guide.
- Qiu ZX, Liu YL (2011) Research on the relationship between credit risk of Chinese commercial banks and macroeconomic factors. Journal of Guangdong University of Finance.
- Yue BB, Zheng XG (2011) VAR model analysis of economic growth and non performing loan ratio fluctuation of commercial banks. Finance and Economy (1): 28-31.
- Xu JB (2024) Research on influencing factors of non-performing loan ratio of commercial banks in China [Master’s thesis]. Shanghai University of Finance and Economics.
- (2018) Sha County Rural Commercial Bank credit risk analysis and countermeasures. Journal of Nanning Vocational and Technical College (2): 51-56.
- Song M, Zheng H, Chen J, Shen Z (2022) Alternative risk measurement for the banking system and its nexus with economic growth. Computers & Industrial Engineering 176.
- He R (2010) Credit risk determinants in the Chinese banking industry. University of Nottingham, UK.
- Zhutan Q (2023) Research on the relationship between non performing loan ratio of provincial city commercial banks and economic development level (5).
© 2026 Xixi Feng. This is an open access article distributed under the terms of the Creative Commons Attribution License , which permits unrestricted use, distribution, and build upon your work non-commercially.
Editor In Chief







.jpg)































Signup for Newsletter

Quick Links
 Editorial Board Registrations
 Submit your Article
 Best Paper of the Volume
 Reprints
 Refer a Friend
 Advertise With Us
Our Recent Edition





Top Editors




.jpg)

















.bmp)
.jpg)
.png)
.jpg)













.jpg)






.png)

.png)




.png)




Financial Support

Sponsors

Latest e-Books

Latest Video

 a Creative Commons Attribution 4.0 International License. Based on a work at www.crimsonpublishers.com.
Best viewed in

 | Above IE 9.0 version