

- About Us
- Information
-

The Author ensures that the research has been conducted responsibly and ethically with adherence to all relevant regulations. read more..
- For Authors
- For Reviewer
- Manuscript Guidelines
- Membership
- Publication Ethics
-
- Journals
- Reprints
- e-Books
- Videos
- Policies
- Contact Us
 COVID-19
- Submissions



Full Text
Research & Development in Material Science
Raman Spectrum of Berlinite [𝛼-AlPO4]
Rainer Thomas*
Im Waldwinkel 8, D-14662 Friesack, Germany
*Corresponding author:
Rainer Thomas, Im Waldwinkel 8, D-14662 Friesack, Germany
Submission: September 15, 2026;Published: September 30, 2026
ISSN: 2576-8840 Volume 23 Issue 2
Abstract
Raman spectroscopy was used to characterize a synthetic, defect-poor berlinite [𝛼-AlPO4] single crystal and compare its spectral features with published data and natural reference samples. Measurements were performed with a 532nm laser over 0-4000cm-1 using calibrated silicon and diamond standards, with spectra collected from rhombohedral and prismatic crystal planes. The principal diagnostic Raman bands occurred near 220, 461, and 1110-1112cm-1, while the strongest bands were observed at approximately 462 and 1112cm-1. Their positions were consistent with handbook data obtained using 514nm excitation and with measurements from berlinite samples from Sweden and Germany. Comparison of the examined orientations indicates that the principal band positions are relatively stable, although the available data does not establish complete orientation independence. Further measurements involving additional crystals, controlled polarization, and quantitative intensity analysis are required to define orientation effects more rigorously.
Keywords: Berlinite; 𝛼-AlPO4; Raman spectroscopy; Diagnostic raman bands; Crystal orientation; Synthetic single crystal; Mineral characterization
Introduction
During the study of pegmatites of the Variscan Ehrenfriedersdorf tin deposit, we frequently found berlinite crystals [1]. At that time, we used, at first, reference material from Vestanå and Hålsjöberg from the Naturhistoriska Riksmusset in Stockholm/Sweden arranged by Hans-Jürgen Wilke [2]. Later, we used as a reference a synthetic single crystal of berlinite from the AMNH, which Dr. G. Harlow provided.
Sample Material and Method
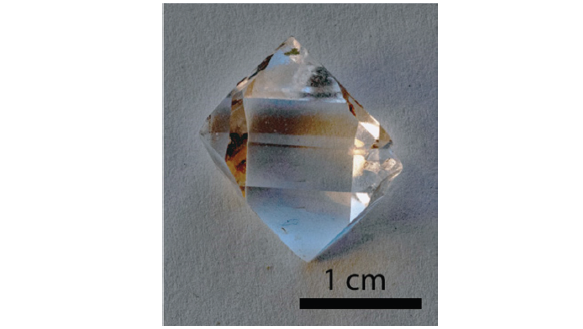
As a sample, we used a water-clear, defect-poor, single berlinite crystal of about 17x10x8mm from the American Museum of Natural History, New York, USA (No. 99035). Figure 1 shows that crystal.
Figure 1:Synthetic berlinite crystal used for Raman spectroscopy.
Microscopic investigations were performed using a Zeiss JENALAB POL microscope in transmitted and reflected light. Raman measurements were performed with an Olympus BX43 microscope and an EnSpectr R532 system using a 532nm laser. Spectra were collected from 0-4000cm⁻¹ with an approximate resolution of 4cm⁻¹. Calibration used silicon and diamond standards; minerals were identified with Crystal Sleuth [3].
Results
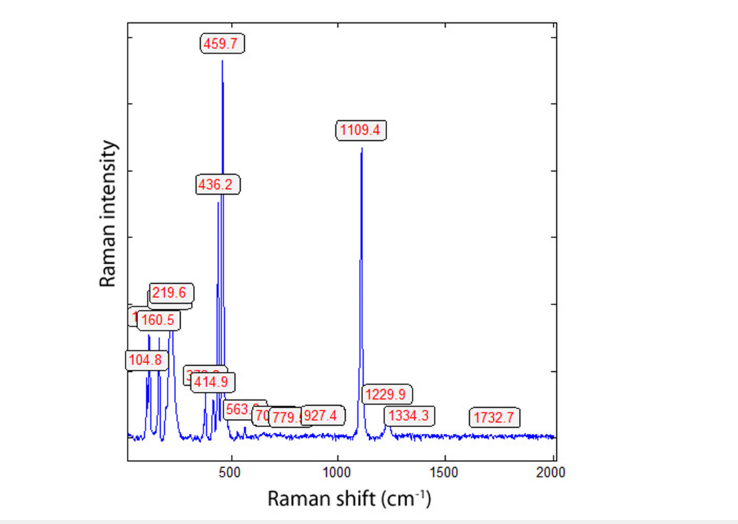
Raman spectra of berlinite are shown in Figures 2 & 3. Three typical Raman bands of berlinite are diagnostically: 221, 462, and 1112cm-1. Table 1 shows the results on the synthetic berlinite crystal and the reference material from Lyon [4]. The composition is 58.20% P2O5 and 41.8% Al2 O3.
Figure 2:Raman spectrum of a rhombohedral plane.
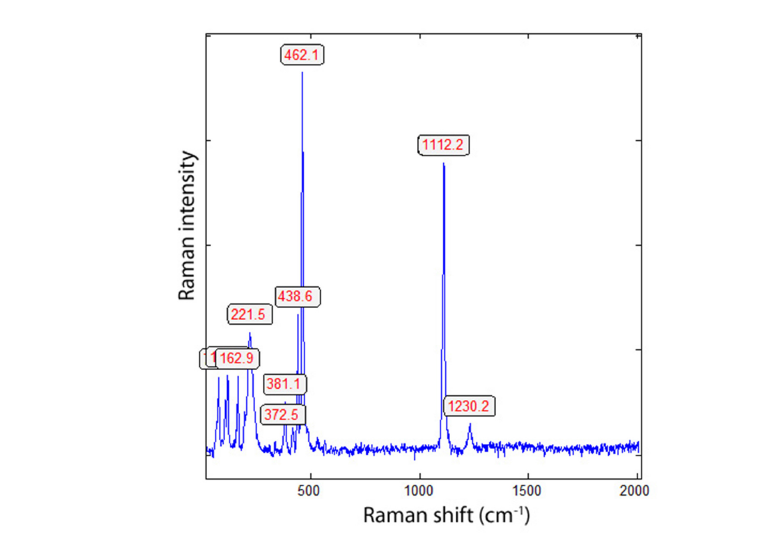
Figure 3:Raman spectrum of a prismatic plane (30° rotated).
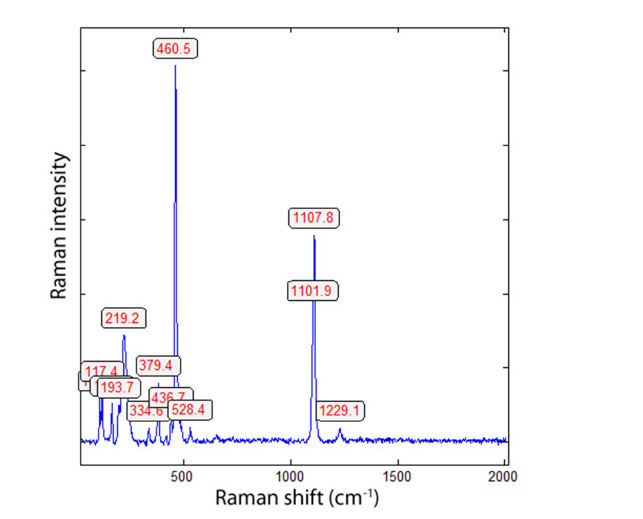
Table 1:Important Raman lines of berlinite (in cm-1).
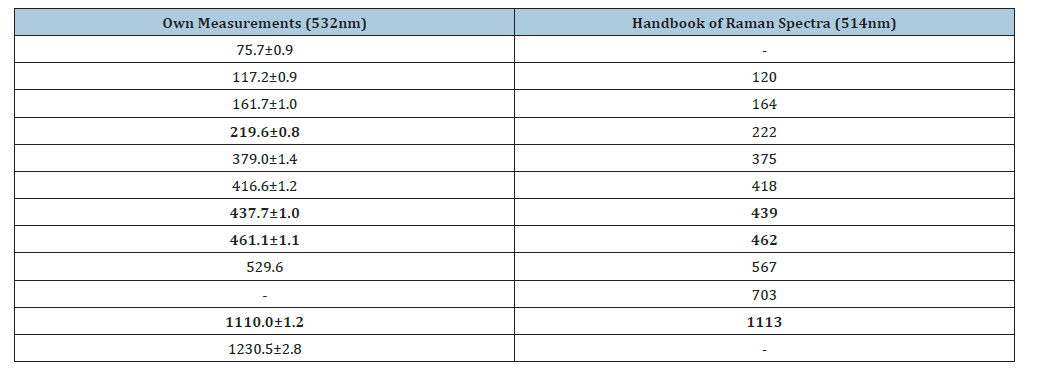
Number of measurements: n = 20.
Table 2:Diagnostic Raman bands of different berlinite samples.

The Raman spectra are characterized by two strong bands at 462 and 1112cm-1, which are the strongest and are ± independent of orientation. Table 1 gives a comparison between our measurements and the data from the Handbook of Raman spectra [4]. Table 2 summarizes the diagnostic Raman bands of different berlinite samples.
The data from Vestanå, Halsjöberg (Sweden), and Ehrenfriedersdorf, Saxon Erzgebirge/Germany are from Thomas and Webster [1] using the Dilor XY Laser Raman Triple 800mm spectrometer with the 514nm laser. According to Figure 4 and comparison with Figure 3, we see that the Raman line at 436cm-1 depends strongly on the orientation of the berlinite crystal.
Figure 4:Raman spectrum of berlinite of prismatic plane (120° rotated).
Discussion
Berlinite [α-AlPO4] is isomorphous to α-quartz, showing a doubling of the unit cell along the c-axis as a result of the alternance of AlO4 and PO4 tetrahedral [5].
The principal claim is that berlinite exhibits a Raman spectrum that is largely insensitive to crystal orientation, with particularly strong bands near 462 and 1112cm-1. This interpretation is plausible because the measurements were obtained from a wellcharacterized single crystal using calibrated instrumentation and multiple crystal planes. The comparison of rhombohedral and prismatic orientations provides a relevant, although limited, basis for assessing orientation dependence.
Accordingly, the data supports the more cautious conclusion that the principal Raman bands appear stable across the orientations examined, rather than demonstrating complete orientation independence. The reported variation of the 436cm-1 line further indicates that orientation effects should not be dismissed, even if they are less pronounced for the strongest bands. Additional measurements on several natural and synthetic crystals, with controlled polarization and quantitative intensity comparisons, would be required to establish the scope and reproducibility of the observed behavior.
References
- Thomas R, Webster JD (1999) Characteristics of berlinite from the Ehrenfriedersdorf pegmatite, Ergebirge, Germany. Journal of Geological Sciences 27(5/6): 443-454.
- Wilke HJ (1997) The minerals and localities of Sweden. Christian Weise Verlag, Munich. Pg. 200.
- Lafuente B, Downs RT, Yang H, Stone N (2015) The power of databases: the RRUFF project. In: Armbruster T, Danisi RM (Eds), Highlights in Mineralogical Crystallography. Berlin, pp. 1–30.
- Handbook of Raman Spectra for geology (2002). Lyon Geology Laboratory, ENS de Lyon - berlinite.
- Gillet P, Badro J, Varrel B, McMillan PF (1995) High-pressure behavior in a-AlPO4: Amorphization and the memory-glass effect. Physical Review B 51(17): 11262-11269.
© 2026 © Rainer Thomas. This is an open access article distributed under the terms of the Creative Commons Attribution License , which permits unrestricted use, distribution, and build upon your work non-commercially.
Editor In Chief







.jpg)































Signup for Newsletter

Quick Links
 Editorial Board Registrations
 Submit your Article
 Best Paper of the Volume
 Reprints
 Refer a Friend
 Advertise With Us
Our Recent Edition





Top Editors




.jpg)

















.bmp)
.jpg)
.png)
.jpg)













.jpg)






.png)

.png)




.png)




Financial Support

Sponsors

Latest e-Books

Latest Video

 a Creative Commons Attribution 4.0 International License. Based on a work at www.crimsonpublishers.com.
Best viewed in

 | Above IE 9.0 version