
- About Us
- Information
-

The Author ensures that the research has been conducted responsibly and ethically with adherence to all relevant regulations. read more..
- For Authors
- For Reviewer
- Manuscript Guidelines
- Membership
- Publication Ethics
-
- Journals
- Reprints
- e-Books
- Videos
- Policies
- Contact Us
 COVID-19
- Submissions


Full Text
Research & Development in Material Science
Stress Distribution Analysis in ZrB2-SiC Based Thermal Protection System Using Machine Learning Driven Approach
Carmine Zuccarini*, Karthikeyan Ramachandran and Doni Daniel Jayaseelan
Department of Aerospace and Aircraft Engineering, Kingston University, Roehampton Vale Campus, London, United Kingdom
*Corresponding author:Carmine Zuccarini, Department of Aerospace and Aircraft Engineering, Kingston University, Roehampton Vale Campus, London, United Kingdom
Submission: July 26, 2024;Published: August 30, 2024

ISSN: 2576-8840 Volume 20 Issue 5
Abstract
Data-to-knowledge has significantly increased over the last decades, and this led to a new paradigm of science where Machine Learning (ML) and big data are utilised to optimize and solve complex problems. This study is the first of its kind to evaluate a non-discrete stress distribution behaviour of ZrB2/SiC composite based thermal protection system (TPS) using ML. Thermo-fluid analysis using FEM at re-entry conditions indicated maximum external temperature of 5000 K with boundary layer pressure up to 205 MPa. The ML driven approach through Keras library with combination of clustering indicated that high thermal stress occurs within approximately on three quarters of boundary layer separation points where flow is highly stochastic, and oxygen ionization takes place. A maximum stress of ~400 MPa obtained from stress distribution supports the ablative behaviour of TPS. The use of deep learning has significantly reduced the computational time needed for simulation and showed improved accuracy.
Keywords:Thermal protection system; Hypersonic conditions; machine learning; ZrB2-SiC composites, Keras library
Introduction
Established methods and extensive previous research have proved that it could be possible to fly outside the earth’s atmosphere and re-enter reaching speeds that could go above the speed of sound by 5 folds [1]. However, sharp leading edges, combustors and thermal protection systems of such hypersonic vehicles require materials that can withstand extreme thermal, mechanical and shock-wave loadings. Ultra-High Temperature Ceramics (UHTCs) are potential candidates that can be utilised as non-ablative TPS for a space vehicle due to their low volatility, high melting point and high heat-flux resistance [1-4]. The current trend in barrier coatings utilised by designers and engineers involves randomised choice of material combinations based upon historical experiments and extensive testing to ensure safety and vehicle manoeuvrability [5]. However, experimental preparation of UHTCs and the testing for harsh environmental conditions require hypersonic wind tunnel facility and the availability of such facilities is scarce. Further, using such exotic techniques, materials can only get evaluated for limited time leading to lack of information over time.
Computer-based simulation, based upon the Finite Element Modelling (FEM) and Computational Fluid Dynamics (CFD) have been utilised to estimate the rate of change of fluid field across the vehicle to determine safety parameters, such as heat flux and shock wave resistance, which could be provided by understanding structural integrity and thermal efficiency [6]. However, computer-based simulations do not bear any environmental and physical properties of wind tunnel in terms of accuracy and requires high performance computing and time and further not very efficient for hypersonic conditions owing to its time consumption [7]. As a result of these limitations, the current TPS are built as ablative layers to protect C/C composites which are majorly utilised as the substrates, meaning that in extreme conditions such as high temperature during atmospheric re-entry, the energy is dissipated against the coating making all the TPS non-reusable in nature [8- 10].
Modern development in data to knowledge ideas have created a new pillar in scientific discovery that has been acknowledged as the big data driven discovery. This approach is based upon the combinatorial solutions of the Euler - Lagrange equations of the Density Functional Theory (DFT) [11], that in computer science is known as Machine Learning (ML) [12,13]. Use of such methodologies coupled with powerful data processing and high prediction performance algorithm is slowly replacing the traditional method for material discovering based upon trial and error and allow a more efficient way to predict key failures points while reduce significant computational power required [14].
The purpose of this study is to analyse the stress distribution across a solid boundary of a known space vehicle using a surrogate model and multiple level deep learning algorithm to give insights about the computational power needed as well as the possibility of further application of such methodologies for broader application. Given the lack of application of ML algorithms specific for UHTCs at the times when the study was conducted, most of the comparison has been done using results from similar materials that are subjected to stress in highly stochastic environment. This paper will focus on determining the stress distribution across a solid semi-cone shaped leading edge coated with a TPS layer made up of a composite blend of Zirconium Diboride (ZrB2) and 15% Silicon Carbide (SiC). The first two datasets generated for the model will be about the geometry and fluid field. The geometrical dataset will be derived using linear regression and topological mapping as previously utilised [15], whereas the fluid field is attained through Monte-Carlo based CFD through Ansys software [16]. After generating these datasets, sets will be added as an input for an unsupervised model based upon a method that reflect the human brain and allows computer program to recognize patterns to solve problems, these kinds of models are known as neural networks. To understand the stress distribution, a surrogate model is introduced, and further datasets and unsupervised algorithm are utilised which aim to predict locations of high stress accumulation and make an average, such approach is called k-mean clustering [17].
Computational details
The schematics of the machine learning model is illustrated in Figure 1 and the corresponding material properties of the UTHCs were attained from our previous study and reported in Table 1 [18]. In Figure 1, geometry and thermo-fluid parameters are mapped into dataset using topology. The dataset is used as training data for segmentation that leads to the generation of a dataset that is then coupled with another topological mapping of the material property data. The first stage of this research involved estimation of fluid around space vehicle to understand the temperature and pressure distribution as well as boundary layer separation point and shock waves occurring due to extreme frictional heating during re-entry. This analysis was conducted through CFD technique through Ansys with randomised Navier Stokes Equations based upon the Direct Monte Carlo method. The attained CFD results were used as input to evaluate stress distribution and the points of high stress through ML approach using a surrogate model built by combining k-mean clustering and neural network gradient boosting algorithm using the open source keras library.
Figure 1:Schematics of machine learning model utilised in this research.

Table 1:Properties of UHTCs adapted from our previous study [18].

Thermo-fluid analysis
The reference geometry chosen for the study is a semi-cone shaped leading edge similar to traditional re-entry space vehicles as illustrated in Figure 2. The design was analysed using Ansys to understand the thermo-fluid field to achieve initial data for the ML approach. The hypersonic hydro-dynamic and molecular gas-flow solver was utilised for the study based upon the high stochastic study made by Swartzentruber et al. which uses revised Monte Carlo model for flow prediction developed and implemented by Bird et al. [19, 20]. The solver has the capability to model physical phenomena relative to high-speed and chemically reactive that are typical of re-entry conditions.
Figure 2:Computer Aided Design of a semi cone shaped leading edge.

Table 2 summarizes the initial and boundary conditions that have been utilised to obtain the thermo-fluid profile and the subsequent dataset with free steam velocity, temperature, pressure and density which are the typical values that a re-entry vehicle would face, the wall temperature is assumed to be circa 1000 K. The use of the Monte Carlo method to compute the transient hyper-velocity reacting flow in a vacuum employs the non-equilibrium Navier- Stokes-Fourier equations [21]. Therefore, in cartesian coordinates, the flux-divergences (W) are given by:
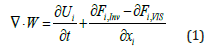
Table 2:Parameters used for the CFD simulation.

Where Fi,Inv and Fi,VIS are Fourier transform of the induced pressure gradients and U is velocity vector field in cartesian coordinate i=(u,v,w). The flux vector (W) will be made up of continuum and non-continuum functions. It is important to point out, a randomized solution will only need to consider the part where continuum assumption cannot be made, considering a microscopic flow quantity Φ. The non-continuum Knudsen number is approximated as:
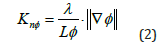
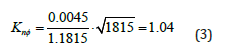
where λ is the local mean free path of flow, L is the characteristic length of the sample molecules and ∇ϕ can be assumed to be the gradient of the non-continuum part of the velocity vector. For the simulation, velocity will be assumed to be in only one direction and therefore the local non-continuum Knudsen number will be given by:
Computational fluid dynamics
A tailored solver based upon Monte Carlo approximations in fluid flow was chosen to be used for the thermo-fluid analysis and the field distributions across the designed geometry. Ansys Fluent has such solver, however, given the impossibility to modify the code, it was not possible to work out an accurate linear function that describes the two parameters. i.e., temperature and pressure. Hence, it will be assumed adequate accuracy of the simulation. The mesh towards the 2D design was based on a fine mesh with growth rate of 1.2 and orthogonal quality of 0.96. Using a fine mesh and considering the parameters from Table 2 the profiles were obtained for (a) total pressure, (b) velocity and (c) temperature distribution as illustrated in Figure 3.
Figure 3a:Profile attained for Total pressure distribution.

From Figure 3, it could be noted that the maximum temperature of 5262 K was observed near the flow stagnation point and there was a uniformly crescent profile around the leading edges. Another crucial point that needs to be noticed from Thermo-Fluid analysis is that the change of pressure occurs only in areas where there is a highly randomise change in temperature, making low pressure points directly proportional to high temperature points. Experimental data from hypersonic wind tunnel availability is scarce, and in most cases has very limited applicability as it looks only at small samples with diameters of 10-20 mm and with an exposure that does not exceed 1-2 seconds A similar hafnium based CMC was tested in a plasma wind tunnel by Savino et al. [22] using several different geometries including one very similar to the shape considered in this paper. The results of the CFD analysis shows a temperature distribution similar to the ones observed using Ansys Fluent MC with a maximum temperature of 3890 K at the stagnation point [23]. White et al. [23] developed a bespoke solver using Direct Monte Carlo Simulations within the Open Foam framework, such solver was based upon similar parameters used in these simulations but was applied against a cylinder. Published results of this analysis only consider the rotational temperature distribution with a peak temperature of 4800 K at the stagnation point, there was no data on translational temperatures or pressure distribution. Casseau et al. applied the exact framework using a Pyfoam based solver across the cylinder, temperature and pressure distributions were very similar to the ones found by Fluent solver [24]. Traditional FEM based model would use an average value of temperature and pressure to calculate the heat-flux and such value will then be used as an input value for the stress analysis, such methodology tends to have a negative effect on the overall results of the simulation. Hence it is often necessary to perform multiple simulations with multiple paraments to increase accuracy. Hence, purpose of this paper is to use big data driven experiment to derive the data set and then to export the data set as a csv file in the machine learning model.
Machine learning model
Geometry and Thermo-fluid data sets generation: Machine learning can be defined as a part of artificial intelligence (AI) that provides systems with the ability to automatically learn and improve from experience with minimal human intervention [25]. Such definition, from a physical perspective, involves the use of a set of data and information that is here by referred as training data set. Therefore, for the model to work, there is a need to generate a training data set using both the geometry and fluid data [12]. The branch of mathematics that studies the generation of datasets from geometrical figures is called topology and that part of topology that generates datasets is referred as shape encoding [26]. Encoding is a method of representing a vectorial shape by a small number of scalar values. Some of the methodology that topology uses includes method available for shape encoding, including Principal Component Analysis (PCA), independent component analysis and sparse coding [27]. A PCA algorithm was developed from Heiman et al. to encode both the shape and the geometrical representation of the fluid field into a unique dataset [28]. By using PCA, a shape X can be rep-resented by:
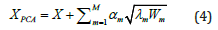
Where X is the mean shape, and Wm and λm are the eigenvector and eigenvalues of the covariance matrix, respectively. By using equation (4) and the fact that eigenvectors are orthogonal to each other, the shape code of the geometries and the fluid filed can be estimated as:
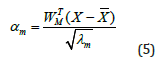
Where WTM is the transpose of the column vector m W , when m is limited to three dimensions (1,2,3) the column vector is equivalent to a neural network with linear unites and no hidden layers. The geometry of the sample has therefore topologically approximated as rectangle. Figure 4 shows the results of the transformation done using a Matlab code [29] that included the results of equations (4) and (5).
Figure 3b:Temperature distribution.

Algorithmic description: As previously mentioned, in order to study the overall stress distribution, a surrogate model was developed specifically for the problem. Surrogacy in this case is seen as a combination of supervised linear regression (the topological representation), to approximates to triangles and rectangle the input of the model and neural network. It is widely accepted that material properties (anisotropic) change according to the environment in which they are operating and although the ultimate goal of material informatics would be to predict the required material based upon this condition, for the sole purpose of this study an extra function that includes the material properties in Table 2 has been added to the code. The simulation should output a stress distribution curve that resembles results of traditional FEM software with the advantage of requiring less computational power. The flowchart illustrated in Figure 5 shows the process the ML code follows to get to the results.
Once the datasets have been generated, multi-layer neural network was designed using open source codes from the python scikitlearn library. The codebase was based upon regression to map the shape code that was then placed into a neural network that mapped the shape code into the stress code that is essentially a non-linear regression with high dimensional outputs. βn=f(α1,….αm) with n=1, 2, 3 and so on. The structure of the neural network is illustrated in Figure 6 and has been simplified with two layers each of which has 128 nodes.
Figure 3c:Velocity profile.

Figure 4:Plotted shape encoding representation - the total length of the sample is approximately 4 meters.

The stress distribution of the leading edge will be represented by re-constructed scalar field. The encoding and decoding processes can be described conceptually by a bi-directional neural network with multiple layers and linear units. The first part of the machine learning algorithm utilises the same non-linear regression algorithm to train the model in mapping nodes and networks of the fluid field. However, to facilitate the processes, each leading-edge mesh was divided into 50 regions consisted of a set number of nodes using Low Rank Approximation (LRA) [30]. In the decoding process the stress code βn is converted into stress code for each area (A) of the sample and is given by:
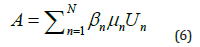
With A=[ATarea1, ,......, ATarean] which is the stress codes for Nth area, Un are the left singular vectors and μn are the corresponding singular values with βn approximating the LRA parameters. To simplify the algorithm, only the 16 most significant components were retained in the LRA, which led to an approximation error less than 2%. Therefore, the stress distribution (sk) matrix elements are given by:
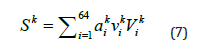
A further LRA was carried out on the matrix element of Eq. (7) where Vki is defined as the right singular vectors and Vki are the corresponding singular values and aki the LRA leading also to an approximation error of circa 2%. Using the 64 top significant results it has been possible to evaluate the key areas of Von-Mises stress points that will need to be used in the deep learning surrogate. Those stress codes are given by the following relationship.
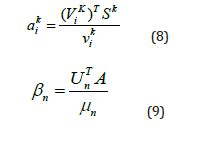
Given that singular vectors are orthogonal to each other, it has been possible to reduce complexity and each sub-networks share the same weight and hence the stress code can be implemented via a transposed-convolution layer [31]. While the stress encoding can be implemented via a neural network with convolution layers [32]. Following mapping of the geometry and fluid filed and encoding and decoding of the stress distribution the deep learning was applied by the use of k-means clustering. Using a python scripts, the material property dataset was generated and used as target test data whilst the output stress distribution dataset was used for training purposes. Clustering output a plot that would predict high stress point locations values for the given sample.
Results and Discussion
Once the stress learning code and decode had been developed and tested using scikit learn, data in regard to the material properties were brought into the model to generate a cluster. The deep learning modules were designed for specifics tasks (flying and re-entry at hypersonic speed) and therefore a further algorithm was implemented to generate a map of the high stress points together with the stress distribution graph. After the two modules were trained, the parameters of the non-linear mapping module were obtained through supervised learning by using a meansquare loss function and the Adamax optimization algorithm [33] to predict the stress code from the shape code, for which the stress code is obtained through stress-encoding. The Adamax algorithm performs stochastic optimization to find the optimal parameters of the non-linear mapping module, implementing this methodology within the model allowed the generation of the first set of training data. Stress analysis and simulations are usually performed using the FEM and it is well known that the maths behind is based upon approximation and averages. As already mentioned, the purpose of this paper is to find data and, eventually, estimate accuracy for a specific type of material combinations, therefore a second set of training data i.e., material property dataset, has been incorporated in in order model. From the keras library another algorithm based upon clustering has been implemented into the mode. As previously mentioned, in data science, a cluster is a group of homogenous or similar data point, the surrogate deep learning will then look for similar patterns based upon the training data set and the stress code to generate plots of homogenous stress points that are expected to be in line with what an FEM-based software would generate, with the advantage that it would not require significant computer power
A surrogate deep learning model has been developed using a combination of supervised and unsupervised machine learning algorithm combined with a thermo-fluid analysis data set that has been generated using traditional CFD. Experimental data showed that ZrB2/SiC UHTC had a strength of ~700 MPa with various degree of ablation [3]. Using the Direct Monte Carlo Simulation code embedded within Ansys Workbench, a thermo-fluid data profile has been generated and exported as a csv file for it to be read by the model. The datasets have then been loaded into the module using the open-source python interpreter and the Jupiter Notebook [34] within the Anaconda environment [35]. The datasets relative to the topological approximation of the geometry and thermo-fluid filed have been trained using the algorithm in the surrogate model. De-coupling the data set generated and plotting in a bi-dimensional orthogonal projections shows that the total stress distribution is high in the bottom part and lower in the lower part as shown in Figure 7 with the Von Mises Stress being mainly in the top part of the sample. It is important to point out that plots in Figures 7 & 8 are approximations of the cross session of the considered samples and that the total stress distribution contours are shown in Figure 9.
Figure 5:Deep learning methodology for attaining stress distribution.

Figure 6:Nodes and network shapes and stress codes.

Figure 7:General stress distribution and Von-Mises clustering at hypersonic conditions Highest points are in red; lowest points in blue.

It is important to point out that the material property dataset has been generated randomly and does not take into consideration possible environmental changes nor takes for example into consideration the different layers of Zirconia or Silica Carbide used. Whilst the former may have affected the accuracy of the results, it has also contributed to obtain data in a fast and efficient way without the need for a high-performance computer or GPU. The model has been deepened using k-mean clustering after generating the material property dataset, since the LRA algorithm and the nodes of the convolution layers had been limited to 16, it is safe to say that this clustering has been done average 16 clusters. The results illustrated in Figure 8 therefore show the stress distribution with high stress points in the zirconium-based sample, both for total and Von Misses stress to be around the bottom and middle of the sample and there is therefore the part where the shock wave generates the boundary layer separation and where likely there is a higher concentration of ionized air (stagnation point).
The final step that python mat-plot library [35] output as a result is a maximum total stress of 400 MPa. These results are in-line with the previous study based on finite element modelling when applied with known initial conditions of atmosphere re-entry conditions [3,36]. Figure 9 illustrates the stress distribution map, and it could be observed that the map mimics the average results of 16 mean cluster on the total stress distribution (Figure 8 (left)) and Von-Mises distribution (Figure 8 (Right)) for the ZrB2 - SiC material dataset (Figure 9).
From Figure 9, it could be observed that the stress distribution is highest in the boundary layer separation which is believed to be due to the ionization of air particles at hypersonic conditions. At hypersonic speed, the bow shocks forms in front of the noise tip which results in compressing of gases passing through the bow shock causing an increase of the static enthalpy which leads to dissociation or boundary layer separation and ionization. This condition significantly contributes to the aero-thermal heating experienced by the components. The results for stress distributions that can be observed in Figure 9 (left) can be compared with some previous experimental and modelling studies. Most of the ablative TPS that have been utilised in the past for re-entry including Russian Soyuz which have indicated mostly part damages at the points were high ionization and boundary layer separation occurs [9]. Some zirconium-based thermal protection system have also been tested in hypersonic wind tunnel facilities, Savino et al. reported effects of arc-jet facilities on zirconium-based composites with high enthalpy of 20 MJ Kg−1 and an absolute temperature of 2000 K which indicated similar damages patterns as of Figure 9; [22,37]. Their study was carried out across a series of different geometries including a hemispherical sample that is similar to the semi-cone used in this study and showed similar patters described by the machine learning model [37]. Although the attained stressdistribution of ~400 MPa was verified by various above-mentioned researchers as in our results it is fair to say that there may be some reservations over the accuracy of the values calculated through this model. However, ultimate goal of this research is to predict and aid design against events, it remains safe to say that this surrogate model could and should be applied using different problem statement and different datasets.
Figure 8:Stress distribution based on the ZrB2 - SiC dataset red points represents highest point of stress and blue points represents the lowest point of stress.

Figure 9:Total stress distribution (right) and Von-Mises (left) distribution on the ZrB2-SiC dataset.

Conclusion
The use of machine learning in solving tailored material science problems is likely going to make future discoveries faster and more efficient. The use of open-source bespoke algorithm coupled with traditional FEM based thermo-Fluid analysis has been shown in this paper to generates insights not only about the maximum stress distribution, but also location of likely high (or low) stress points in specific sample. Data science can only be as accurate as the quality of the data that is fed into a model, therefore this example where limited number of clusters and nodes have been used and a specific material data set has been created cannot be considered to be fully accurate to what would really happen to the sample in a wind tunnel or a real re-entry scenario, however, given that the cost of developing such model is limited and the computational power required to run the simulation is significantly lower than the one required by high performing FEM studies, it is worth to conclude that this model should be tried and used with bigger data sets and against a larger material repository .
Acknowledgement
Authors C Zuccarini and K Ramachandran would like to acknowledge the support from Kingston University, London towards supporting their research. Data and code are available on GitHub at - https://github.com/AstroBOY92/DLStressPaper [38].
References
- Paul A, Jayaseelan D, Venugopal S, Solvas EZ, Binner J, et al. (2012) UHTC composites for hypersonic application. American Ceramic Society Bulletin 91(1): 22-29B.
- Zhang H, Jayaseelan D, Bogomol I, Reece M, Hu C, et al. (2019) A novel microstructural design to improve the oxidation resistance of ZrB2-SiC ultra-high temperature ceramics (UHTCs). Journal of Alloys and Compounds 785: 958-964.
- Jayaseelan D, Xin Y, Vandeperre L, Brown P, Lee W (2015) Development of multi-layered thermal protection system (TPS) for aerospace applications. Composites Part B: Engineering 79: 392-405.
- Duffa G (2013) Ablative thermal protection systems modeling. Duffa Inc, Chigago.
- Barraza C, Manara D, Boboridis K, Watkins T, Grasso S, et al. (2016) Investigating the highest melting temperature materials: A laser melting study of the TaC-HfC system. Scientific Reports 6(37962): 1-11.
- Czaplewski K, Swierczynski S, Zwolan P (2021) Increasing the reliability of simulation tests in navigation and maneuvering simulators using the k-epsilon model based on the RANS method. Sensors 21(15): 1-19.
- Marschall J (2011) Testing and modeling ultra-high temperature ceramic. SRI International.
- Boghozian T (2015) Alternative high-performance polymers for ablative thermal protection systems. University Space Research Association, Columbia, Meryland, USA.
- Khatuntseva N (2011) Analysis of the reasons for an aerodynamic hysteresis in flight tests of the Soyuz reentry capsule at the hypersonic segment of its descent. Journal of Applied Mechanics and Technical Physics volume1(544): 52.
- Mason W (1959) Hypersonic aerodynamics. Hypersonic Flow Theory, Blacksburg, Virginia Tech University, USA, pp: 1-31.
- Ermon S, Bras RL, Gomes CP, Selaman B, Dover RV (2018) SMT-aided combinatorial materials discovery. Dept of Computer Science, Dept of Materials Science and Engr, Cornell University, USA.
- Agrawal A, Choudhary A (2016) Materials informatics and big data: Realization of the “fourth paradigm” of science in materials science. APL Materials 4(1): 53-208.
- Simpers JH, Gregoire J, Kusne A (2016) Composition-structure-property mapping in high-throughput experiments: Turning data into knowledge. APL Materials 4: 053211.
- Wei J, Chu X, Sun XY, Xu K, Deng HX, et al. (2019) Machine learning in materials science. Infomat 1(3): 338-358.
- Auricchio F, Conti M, Morganti S, Reali A (2013) Simulation of transcatheter aortic valve implantation: a patient-specific finite element approach. Computer Methods in Biomechanics and Biomedical Engineering 12(1): 1347-1357.
- Ansys (2020) Monte Carlo analysis utility. Ansys Inc, Canonsburg, USA.
- Schmidth J, Marques M, Botti S, Marques M (2019) Recent advances and applications of machine learning in solid-state materials science. npj Computational Materials 5(83).
- Zapata-Solvas E, Jayaseelan D, Lin H, Brown P, Lee W (2013) Mechanical properties of ZrB2- and HfB2-based ultra-high temperature ceramics fabricated by spark plasma sintering. Journal of the European Ceramic Society 33(7): 1373-1386.
- Schwartzentruber TE, Boyd ID (2015) Progress and future prospects for particle-based simulation of hypersonic flow. Progress in Aerospace Sciences 72: 66-79.
- Bird GA (1994) Molecular gas dynamics and the direct simulation of gas flows. Oxford University Press, Oxford, England.
- Espinoza D (2018) An open-source hybrid CFD-DSMC solver for high-speed flows. University of Strathclyde, Glasgow, UK.
- Savino R, Mungiguerra S, Martino GD (2017) Testing ultra-high-temperature ceramics for thermal protection and rocket applications. Advances in Applied Ceramics 117(1): 50-62, 2017.
- White C, Borg M, Scanlon T, Longshaw S, John B, et al. (2018) dsmcFoam+: An Open FOAM based direct simulation monte carlo. Computer Physics Communications 224(1): 22-43.
- Casseau V, Scanlon TJ, John B, Emerson DR, Brown RE (2016) Hypersonic simulations using open-source CFD and DSMC. AIP Conference Procceding, Strathclyde, UK.
- ParkWoolf B (2009) Machine Learning. Building Intelligent Interactive Tutors, Morgan Kaufaman, USA, pp. 223-297.
- LumPY, Singh G, Lehman A, Ishkanov T, Vejdemo-Johansson M, et al. (2013) Extracting insights from the shape of complex data using topology. Scientific Reports 3(1236).
- Zhang S, Zhan Y (2012) Deformable segmentation via sparse representation and dictionary learning.
- Heimann T, Meinzer H (2009) Statistical shape models for 3D image segmentation: A Review. Medical Image Analysis 13(4): 543-563.
- Matlab (2020) Matlab Version 2020a. Math Work Inc.
- Liang L, Liu M, Martin C, Sun W (2018) A deep learning approach to estimate stress distribution: a fast and accurate surrogate of finite-element analysis. J R Soc Interface15(138): 8-44.
- Zheng Z, Cao W, He Z, Luo Y (2021) Progressive anatomically constrained deep neural network for 3D deformable medical image registration. Neurocomputing 465(0925-2312): 417-427.
- Nie Z, Jiang H, Kara L (2020) Stress field prediction in cantilevered structures using convolutional neural networks. Journal of Computing and Information Science in Engineering 20(1): 011002.
- Muneer A, Taib S, Fati S, Balogun A, Aziz I (2022) A hybrid deep learning-based unsupervised anomaly detection in high dimensional data. Computers Materials and Continua 70(3): 6073-6088.
- Various (2016) Project Jupyter. Python.
- Anaconda (2010) Anaconda navigator. Anaconda, Austing, Romania.
- Thomas JM, Squirea H (2010) Material property requirements for analysis and design of UHTC components in hypersonic applications. Journal of European Ceramic Society 30(11): 2239-2251.
- Cinquegrana Eduardo T (2015) Final CFD Design of SCIROCCO Arc-jet Test Conditions for IXV TPS Interfaces. 8th European Symposium on Aerothermodynamics for Space Vehicle, Lisbon, PT.
- Zuccarini (2022) Surrogate Model Stress and Monte Carlo Codes. GitHub.
© 2024 Carmine Zuccarini. This is an open access article distributed under the terms of the Creative Commons Attribution License , which permits unrestricted use, distribution, and build upon your work non-commercially.
Editor In Chief


.jpg)


Signup for Newsletter

Quick Links
 Editorial Board Registrations
 Submit your Article
 Refer a Friend
 Advertise With Us
Our Recent Edition

.jpg)


Top Editors


.jpg)


.bmp)
.jpg)
.png)
.jpg)


.jpg)


.png)

.png)


.png)


Financial Support

Sponsors

Latest e-Books

Latest Video

 a Creative Commons Attribution 4.0 International License. Based on a work at www.crimsonpublishers.com.
Best viewed in
a Creative Commons Attribution 4.0 International License. Based on a work at www.crimsonpublishers.com.
Best viewed in