
- About Us
- Information
-

The Author ensures that the research has been conducted responsibly and ethically with adherence to all relevant regulations. read more..
- For Authors
- For Reviewer
- Manuscript Guidelines
- Membership
- Publication Ethics
-
- Journals
- Reprints
- e-Books
- Videos
- Policies
- Contact Us
 COVID-19
- Submissions


Full Text
Research & Development in Material Science
Data-Constrained Modelling of Material Microstructures and Properties
YS Yang*
CSIRO, Australia
*Corresponding author: YS Yang, CSIRO, Private Bag 10, Clayton, Victoria 3169, Australia
Submission: April 02, 2018;Published: April 13, 2018

ISSN: 2576-8840
Volume5 Issue3
Abstract
This article is a review of our recent development in data-constrained modelling (DCM) methodology for quantitative and sample-non-destructive (SND) characterization of 3D microscopic composition distribution in materials, and microstructure-based predictive modelling of material multiphysics properties. Potential impacts are illustrated with examples in a range of R&D disciplines.
Introduction
Although the X-ray CT and threshold image segmentation approach is widely used in the R&D community for sample-nondestructive (SND) characterization of internal microstructures of various materials [1], it is subjective and imposes an arbitrary length-scale cut-off at the X-ray CT voxel size. It generally assumes that each X-ray imaging voxel has a discrete material composition. That is, there are no finer structures smaller than the X-ray imaging voxels. The smallest X-ray CT voxel size is at the order 1/1000 of the sample size. In other words, the mainstream X-ray CT approach is inadequate to characterize material internal structures smaller than the order of 1/1000 of the sample size. This makes it not suitable for materials with multi-scale internal structures such as tight oil & gas reservoirs including shale, carbonate and tight sandstone; manufactured materials such as 3D-printed metal components, and corrosion inhibitive print primers [2-4]. As image segmentation is based on the X-ray CT slice image grey-scale, it is not sensitive enough to discriminate material compositions with similar X-ray attenuation properties.
The problem is addressed with the recent development in data-constrained modelling (DCM) method using quantitative X-ray CT [5,6]. By integrating statistical physics and multi-energy quantitative X-ray CT, DCM Video 1 explicitly reconstructs 3D microscopic distributions of materials and incorporates fine structures below X-ray CT image resolution as voxel compositional partial volumes. This offers a more accurate 3D representation of a material microstructure and enables more quantitative modelling of its properties. The DCM formulation will be presented in the next section, followed by a selection on case studies and references.
Model Formulation
For DCM, a material sample is represented numerically on a simple cubic grid of N = Nx × Ny × Nz cubic vowels. On the nth voxel where n=1,2,.....,N, the DCM model minimizes the following objective function:
The problem is addressed with the recent development in data-constrained modelling (DCM) method using quantitative X-ray CT [5,6]. By integrating statistical physics and multi-energy quantitative X-ray CT, DCM Video 1 explicitly reconstructs 3D microscopic distributions of materials and incorporates fine structures below X-ray CT image resolution as voxel compositional partial volumes. This offers a more accurate 3D representation of a material microstructure and enables more quantitative modelling of its properties. The DCM formulation will be presented in the next section, followed by a selection on case studies and references.
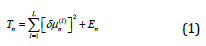
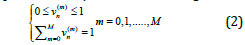
This is equivalent to minimize the discrepancy between the expected and the measured linear absorption coefficients and to maximize Boltzmann distribution probability [7]. In Equation (1), δμn(l) is the difference between the expected and CT reconstructed linear absorption coefficients, and En is the dimensionless phenomenological interaction energy [5,8]. The optimization is achieved by adjusting the volume fraction variables Vn(m) (m=0,1,....,M) for each material composition m, where M is the total number of non-void compositions, subject to the following constraints
Numerical solution to the above has been implemented as a DCM software [5,6]. Figure 1 is a typical main window of the DCM software. In DCM, sub-voxel structures are incorporated as coexistence of multiple compositions in the same voxels.
Figure 1: DCM software main display window for a case-study on cold-spayed Ti sample.

Figure 2: Microstructure and properties of a CIPS sandstone sample.

2a: Compositional distribution where quartz is displayed as blue, calcite as red and pores as green. Coexistences of multiple compositions in the same voxels are displayed as mixed colours.
2b: Induced electric potential when the pores are filled with the sea water and an external potential difference is applied along the Z-axis.
2c: Fluid speed distribution when a pressure difference is applied along the Z-axis.
Microstructure Characterization and Properties Modelling
As a demonstration case study for synthetic CIPS (Calcite Insitu Precipitation System) sandstone, which consists of quartz grains cemented by calcite, and pores? It was X-ray imaged at beam energies 35 and 45keV. The multi-energy X-ray datasets were analyzed using the DCM non-linear optimization algorithm [5]. The procedures of the analysis are demonstrated by the accompanying video https://research.csiro.au/static/dcm/DCM-CIPS-sandstoneweb- demo.mp4. Each voxel represents a sample volume of microns. Assuming the pores are filled with the sea water, its electrical conductivity and permittivity had been calculated using a finitedifference DCM plugin [9]. Its fluid permeability was calculated using a DCM plugin for partially percolating voxels [10,11]. Its composition distribution, induced voltage and fluid flow speed are illustrated in Figure 2.
References
- Arns CH, Bauget F, Ghous A, Sakellariou A, Senden TJ, et al. (2005) Digital core laboratory: Petrophysical analysis from 3D imaging of reservoir core fragments. Petrophysics 46(4): 260-277.
- Yang YS, Liu KY, Mayo S, Tulloh A, Clennell B, et al. (2013) A dataconstrained modelling approach to sandstone microstructure characterization. J Petroleum Science & Technology 105: 76-83.
- Ren YQ, King PC, Yang YS, Xiao TQ, Chu C, et al. (2017) Characterization of heat treatment-induced pore structure changes in cold-sprayed titanium, Materials Characterization 132: 69-75.
- Hughes AE, Yang YS, Hardin SG, Tulloh A, Wang Y, et al. (2015) Diversity of internal structures in inhibited epoxy primers. AIMS Materials Science 2(4): 379-391.
- Yang YS, Trinchi A, Tulloh A, Chu C (2016) A tutorial introduction to DCM quantitative characterization and modelling of material microstructures using monochromatic multi-energy X-Ray CT, XRM 2014: Proceedings of the 12th International Conference on X-Ray Microscopy 1696: 02002.
- Yang S, Chu C, Tulloh A, Chen F (2017) DCM-A Software platform for advanced 3D materials modelling, characterisation and visualization. CSIRO Data Access Porta.
- Thompson CJ (1988) Classical equilibrium statistical mechanics, Clarendon Press, Oxford, UK.
- Yang YS (2017) A data-constrained non-linear optimisation approach to a data-constrained model for compositional microstructure prediction. In Lecture Notes in Information Technology 15: 198-205.
- Yang S, Tulloh A, Clennell B (201) A DCM plug-in for microstructurebased computation of material sample electric conductivity and permittivity. CSIRO Data Access Portal, Australia.
- Li R, Chu C, Yang S, Pereira G (2017) DCM plugin for partially percolating LBM single phase flow. CSIRO Data Access Portal, Australia.
- Li R, Yang YS, Pan J, Pereira G, Taylor J, et al. (2014) Lattice Boltzmann modeling of permeability in porous materials with partially percolating voxels. Phys Rev E Stat Nonlin Soft Matter Phys 90(3): 033301.
© 2018 YS Yang. This is an open access article distributed under the terms of the Creative Commons Attribution License , which permits unrestricted use, distribution, and build upon your work non-commercially.
Editor In Chief


.jpg)


Signup for Newsletter

Quick Links
 Editorial Board Registrations
 Submit your Article
 Refer a Friend
 Advertise With Us
Our Recent Edition

.jpg)


Top Editors


.jpg)


.bmp)
.jpg)
.png)
.jpg)


.jpg)


.png)

.png)


.png)


Financial Support

Sponsors

Latest e-Books

Latest Video

 a Creative Commons Attribution 4.0 International License. Based on a work at www.crimsonpublishers.com.
Best viewed in
a Creative Commons Attribution 4.0 International License. Based on a work at www.crimsonpublishers.com.
Best viewed in