

- About Us
- Information
-

The Author ensures that the research has been conducted responsibly and ethically with adherence to all relevant regulations. read more..
- For Authors
- For Reviewer
- Manuscript Guidelines
- Membership
- Publication Ethics
-
- Journals
- Reprints
- e-Books
- Videos
- Policies
- Contact Us
 COVID-19
- Submissions



Full Text
Psychology and Psychotherapy: Research Study
Identifying Predictors of Depressive Symptoms Using Interpretable Machine Learning
Mizanur Rahman Md1,2*
1 Bath Spa University, Global Banking School, UK
2 School of Engineering and Computing, Regent College London, UK
*Corresponding author: Mizanur Rahman Md, School of Engineering and Computing, Regent College London, UK
Submission: July 11, 2026; Published: September 09, 2026

ISSN 2639-0612Volume9 Issue 5
Abstract
Depression is one of the most common mental health concerns worldwide and is associated with considerable personal, social and economic consequences. In recent years, the growing availability of population health data has encouraged researchers to apply machine learning to depression prediction. However, there is still limited evidence that interpretable machine learning can provide transparent identification of important predictors while maintaining predictive performance using recent nationally representative data. The present study therefore investigated predictors of depressive symptoms using the NHANES 2021–2023 dataset and evaluated the usefulness of explainable machine learning for depression risk assessment. Using a dataset of 4,227 adults, depressive symptoms were assessed using the Patient Health Questionnaire-9 (PHQ-9). To identify factors associated with depressive symptoms, exploratory statistical analyses, traditional machine learning algorithms, deep learning models and explainability techniques were applied. The results showed that significant differences were observed between depressed and non-depressed participants in age, income-poverty ratio, body mass index, sleep duration, sedentary behaviour, smoking status and diabetes status. Income-poverty ratio consistently emerged as one of the most influential predictors across statistical analyses, machine learning models and explainability analyses. Among the predictive models, Random Forest achieved the highest discrimination performance (ROC-AUC= 0.692), whereas Logistic Regression achieved the highest recall (60.2%). Deep learning models produced performance comparable to traditional machine learning approaches and offered no meaningful predictive advantage. The findings demonstrate that interpretable machine learning can identify meaningful socioeconomic, demographic, lifestyle and health-related predictors of depressive symptoms while maintaining transparent model interpretation. The study further suggests that, for structured population health data, traditional machine learning models may provide practical and interpretable alternatives to more complex deep learning approaches, thereby contributing to future mental health research and evidence-informed clinical practice.
Keywords:Depression; Depressive symptoms; Mental health; Interpretable machine learning; Explainable artificial intelligence; Risk assessment; Public health; NHANES
Abbreviations: AI: Artificial Intelligence; ML: Machine Learning; DL: Deep Learning; XAI: Explainable Artificial Intelligence; NHANES: National Health and Nutrition Examination Survey; PHQ-9: Patient Health Questionnaire-9; BMI: Body Mass Index; SVM: Support Vector Machine; MLP : Multilayer Perception; SMOTE: Synthetic Minority Oversampling Technique; ROC-AUC: Area Under the Receiver Operating Characteristic Curve; SHAP: Shapley Additive Explanations; LIME: Local Interpretable Model- Agnostic Explanations
Introduction
Depression remains one of the most common mental health conditions and continues to pose a serious challenge to public health worldwide. According to the World Health Organization (WHO), depression affects hundreds of millions of people and contributes to disability, diminished quality of life, reduced individual productivity and increased pressure on healthcare services [1]. The impact of depression extends beyond clinical symptoms by influencing families, communities, healthcare systems and wider society through its social and economic consequences. These challenges have encouraged researchers to better understand the factors that influence depression and to investigate how to improve early identification and intervention to support people experiencing mental health conditions, including depression. Depression generally develops through the interaction of many factors such as demographic, socioeconomic, lifestyle and health-related factors rather than from a single underlying cause. Research has shown that age, gender, socioeconomic status, obesity, chronic disease, sleep disturbances, smoking behaviour and physical inactivity are associated with depression [2-5]. These factors are interrelated and sometimes the combination of some factors may increase the risk of depression. They often interact through biological, behavioural and social pathways that contribute to its development. Among the various factors associated with depression, socioeconomic circumstances play an important role in mental health. Individuals living with financial difficulties often experience greater stress, reduced access to healthcare and more challenging life circumstances, which may increase their vulnerability to psychological distress [6]. Previous studies have demonstrated that obesity, diabetes and sedentary behaviour are associated with depression, highlighting the close relationship between physical and mental health [3,7]. In addition, sleep disturbances have been identified as an important contributor to emotional dysregulation and depressive symptomatology [8].
The availability and rapid growth of large health datasets have created new opportunities for researchers to apply Artificial Intelligence (AI) and Machine Learning (ML) techniques to mental health research. ML algorithms are capable of identifying complex and hidden patterns within data and have supported various healthcare applications, including depression screening and risk assessment [9]. More recently, Deep Learning (DL), a subset of ML, has attracted considerable attention because it can analyse complex nonlinear relationships within high-dimensional heterogeneous datasets [10]. Despite the rapid development of ML and DL in healthcare research in recent years, several challenges remain. While many studies have emphasised predictive accuracy, they pay less attention to understanding why models make particular decisions. In healthcare settings, transparent and interpretable model decisions are often required because they allow clinicians and policymakers to better understand how predictions are made and which factors contribute to mental health outcomes [11]. Therefore, explainability and interpretability should be considered alongside predictive performance when developing AI and/or ML applications to better support individuals with mental health conditions. The present study examines data from the National Health and Nutrition Examination Survey (NHANES) 2021- 2023, which provides an important opportunity to investigate how mental health symptoms are associated with demographic characteristics, socioeconomic circumstances, lifestyle behaviours and physical health conditions. The dataset follows standardised data collection procedures and includes a nationally representative sample of the United States population. These characteristics make the NHANES dataset a valuable resource for this research. It allows the integration of statistical analysis, machine learning, deep learning and explainability techniques to identify the factors most strongly associated with depressive symptoms and to evaluate the practical value of interpretable machine learning for mental health risk assessment.
The aim of this study is to improve understanding of the factors that are most strongly associated with depressive symptoms and to support individuals experiencing mental health conditions better by identifying symptoms earlier and supporting appropriate intervention. To achieve this purpose, the study addresses three research questions: (1) Which demographic, socioeconomic, lifestyle and health-related factors are most strongly associated with depressive symptoms? (2) Do traditional machine learning and deep learning approaches provide meaningful differences in assessing depression risk using structured population health data? and (3) Can interpretable machine learning techniques consistently identify important predictors of depressive symptoms across different analytical approaches? By addressing these three research questions, the study contributes to mental health research in three important ways.
First, it identifies the most consistent factors associated with depressive symptoms using a nationally representative populationbased health dataset. Second, it compares traditional machine learning and deep learning approaches to determine whether they provide meaningful advantages for depression risk assessment. Finally, it demonstrates the practical value of interpretable and explainable machine learning by examining the important predictors of depressive symptoms. This study focuses solely on the identification and interpretation of depression risk factors rather than on improving predictive accuracy, thereby contributing to future mental health research and evidence-informed clinical practice. The article consists of seven sections, including this Introduction. Section 2, Literature Review, discusses factors associated with depression and mental health conditions, as well as machine learning and deep learning applications in mental health prediction. Section 3, Methodology, describes the study design, data source, predictor variables, data preparation, explainability analysis and ethical considerations of the study. Section 4, Results, presents the outcomes obtained from the statistical, machine learning, deep learning and explainability analyses. Section 5, Discussion, interprets the finding by explaining how different factors influence mental health outcomes and how interpretable machine learning can contribute to future research related to depressive symptoms through earlier identification and appropriate intervention. Section 6 highlights the study limitations and future study directions and Section 7 concludes the article.
Literature Review
Depression as a global public health challenge
Over the past two decades, depression research has expanded beyond traditional clinical diagnosis. Depression cannot be explained solely by biological or psychological factors, as it is influenced by interacting biological, psychological, behavioural and social processes rather than by a single pathological mechanism [12]. The biopsychosocial model proposed by Engel [12] remains highly relevant because depressive symptoms often develop through the combined effects of genetic vulnerability, physical health, individual behaviour and socioeconomic circumstances. Therefore, investigation of isolated risk factors has increasingly shifted towards understanding how multiple determinants interact to influence depression risk. As the global burden of mental health conditions continues to rise, researchers have shown growing interest in identifying the factors that contribute most to the development of depressive symptoms and in supporting individuals experiencing mental health conditions through earlier identification and appropriate intervention. While clinical assessment remains essential for diagnosis, increasing attention has been given to demographic, socioeconomic, lifestyle and healthrelated factors that may increase depression risk [13]. With the increasing availability of large-scale population health datasets, researchers may be able to develop predictive models that may better support individuals at high risk before clinical intervention becomes necessary.
Socioeconomic determinants of depression
Socioeconomic status is widely recognised as an important determinant of depression. Previous studies have shown that individuals experiencing financial hardship, unemployment, or social disadvantage face higher levels of depressive symptoms than those with better socioeconomic conditions [2]. Socioeconomic disadvantages may contribute to depression through multiple pathways. Financial hardship can increase chronic stress exposure, reduce access to healthcare services, limit educational opportunities and constrain social participation. These factors collectively may complicate mental health conditions and increase vulnerability to depression and other common mental health disorders [6]. Recent epidemiological evidence continues to demonstrate inverse relationships between income and depression, suggesting that lower-income populations experience disproportionately higher rates of depressive symptoms [14,15]. Therefore, socioeconomic variables are frequently included in mental health prediction models because they are strong predictors of depressive symptoms in population-based studies.
Demographic factors and depression risk
Demographic characteristics such as age, gender and ethnicity are well-established determinants of depression risk. Previous studies have reported that women generally exhibit higher rates of depression than men, although the underlying mechanisms remain complex and multifactorial, involving biological, psychological and social factors, including hormonal changes and gender-related stressors [16]. Age is another important demographic factor of depression. Earlier studies often suggested that older populations experience mental health burden due to chronic illness and social isolation [17]. However, recent population-based studies indicate that young adults have experienced increased levels of depressive symptoms [18]. This shift may be attributed to many factors, including socioeconomic conditions, educational pressures, employment uncertainty, financial insecurity and the growing influence of digital technologies. Ethnicity and cultural background may further influence depression risk through differences in socioeconomic circumstances, healthcare access, cultural attitudes toward mental illness and exposure to discrimination or other forms of social disadvantage. Therefore, demographic variables remain important predictors in population-based studies and play key roles in mental health prediction models.
Lifestyle and behavioural factors
Lifestyle and behavioural factors have been widely recognised as important determinants of depression. Increasing recent evidence suggests that behavioural patterns can significantly influence psychological well-being [19,20].
Sleep and depression: A strong positive correlation exists between sleep disturbances and depression. Numerous studies have identified strong associations between inadequate sleep duration, poor sleep quality and depressive symptoms [8]. Adequate sleep plays an important role in emotional regulation, cognitive functioning, memory consolidation and recovery from stress. Sleep disruption may increase vulnerability to mood disorders. The relationship between sleep and depression appears to be bidirectional. Sleep problems may contribute to depressive symptoms, whereas depression itself can disrupt normal sleep, creating a cyclical relationship between the two conditions [8,21].
Physical activity, physical inactivity and sedentary behaviour: While physical inactivity and sedentary behaviour have been widely recognised as risk factors for depression, physical activity has been widely recognised as a protective factor against depression. Regular 20 to 30 minutes of exercise are associated with improved mood, reduced stress and enhanced psychological well-being [22]. Extended periods of sitting for nothing or physical inactivity have been linked to poor mental health and increased depressive symptoms [5]. Potential mechanisms include reduced social interaction, lower energy expenditure and adverse physiological effects associated with prolonged inactivity [22]. Together, these findings highlight the importance of maintaining regular physical activity to support mental health and a healthy lifestyle.
Smoking and alcohol use: Smoking has been recognised as a risk factor for poor mental health and has consistently been linked to psychological distress and depression [4,23]. Although nicotine may temporarily reduce feelings of stress and anxiety, long-term smoking behaviour has been associated with poorer mental health outcomes. The relationship between alcohol consumption and depression remains uncertain and is more complex. Some studies have reported strong associations between problematic alcohol use and depressive symptoms, whereas others have suggested that moderate alcohol use may not be independently related to depression once potential confounding factors have been taken into account [24]. These inconsistent results highlight the need for further investigation into the relationship between alcohol consumption and depression using large population-based datasets.
Physical health conditions and depression
Physical and mental health are closely interconnected. People living with chronic health conditions are more likely to experience depression and the presence of chronic disease may increase psychological burden because of long-term disease management, functional limitations and reduced quality of life [25]. Among these conditions, obesity and diabetes have received considerable attention because they are strongly associated with depression.
Obesity: Obesity has also been associated with depression. Meta-analytic evidence suggests that the association between obesity and depression is bidirectional, as each condition increases the risk of the other [3]. Biological mechanisms, including inflammation, metabolic dysfunction, neuroendocrine alterations, together with psychosocial factors such as weight stigma and reduced quality of life, may further contribute to depression risk.
Diabetes: Diabetes is another important risk factor that is strongly associated with depression. Individuals living with diabetes often face the ongoing demands of disease management, medication adherence and concerns about future complications. These challenges may increase psychological stress and contribute to depressive symptoms [7,26]. Consequently, obesity and diabetes have become important variables in contemporary mental health prediction research.
Machine learning in mental health research
The increasing availability of large-scale health datasets has accelerated the application of machine learning algorithms within mental health research. Unlike traditional statistical approaches, machine learning algorithms are capable of identifying complex patterns and nonlinear relationships within high-dimensional datasets [9,27]. Over the past few years, numerous machine learning algorithms have been developed, including Logistic Regression, Decision Trees, Random Forests, Support Vector Machines, Gradient Boosting models and ensemble approaches and they are useful for depression prediction. However, their predictive performance varies considerably depending on the characteristics of the datasets, predictor and algorithm selection and outcome definitions. Despite the growing interest in machine learning algorithms for depression prediction, there are many challenges related to model generalisability, interpretability and reproducibility [28,29]. Due to these challenges, machine learning models may not be suitable for clinical applications even though they may provide high predictive accuracy. Machine learning models are more suitable for clinical applications if they can adequately explain how decisions are made, along with high predictive accuracy.
Deep learning and mental health prediction
There is growing interest in how to utilize deep learning for mental health and numerous areas have recently started to be explored, including the utilization of deep learning in electronic health records, social media, neuroimaging and population health surveys [10,30]. However, the benefits of deep learning over traditional machine learning models remain mixed. For data represented as structured tabular data, there is no additional benefit of the extra complexity of a deep learning model over existing machine learning approaches and indeed there may even be a decrease in performance [31,32]. Deep learning models are not necessarily better than traditional machine learning methods for prediction on structured tabular data from healthcare. The additional complexity of deep learning models does not necessarily translate into better performance [31].
Interpretable machine learning
As machine learning methods are increasingly applied within healthcare decision making, there is growing concern about the need for models to be transparent and interpretable. Interpretable machine learning has increasingly been applied to mental health prediction, including depression risk assessment, demonstrating that transparent models can support clinical decision making while maintaining competitive predictive performance [11,33,34]. Interpretable machine learning methods aim at identifying the input features of a dataset that a model uses most for its decision making. Recent studies have shown that interpretable machine learning approaches can successfully identify clinically meaningful predictors of depressive symptoms while providing clinically meaningful explanations of model predictions [34,35]. Moreover, and even more importantly, interpretable machine learning methods try to provide the most transparent possible explanations for a model’s decisions [36]. In order to achieve these goals, a wide variety of different methods have been developed, e.g., feature importance, coefficients and Explainable Artificial Intelligence (XAI). Over the last years, XAI methods have gained increasing importance in healthcare analytics [37]. As mentioned previously, healthcare decisions are increasingly supported by models. For this reason, models need to provide transparent results. In mental health, sensitive information is used in models to predict the risk of developing a variety of conditions, including depression. Therefore, it is just as important to understand the reasons for the increased risk of developing depression as it is to receive a prediction of risk of the condition.
Methodology
Study design
This study employed a quantitative secondary data analysis design to investigate depression risk factors using interpretable machine learning techniques. Publicly available data from the National Health and Nutrition Examination Survey (NHANES) 2021–2023 cycle were utilised. The study combined traditional statistical methods, machine learning algorithms and deep learning approaches to assess the extent to which demographic, socioeconomic, lifestyle and health-related variables could be used to identify individuals at risk of depressive symptoms. The research followed an analytical workflow consisting of data acquisition, data preparation, exploratory data analysis, machine learning model development, deep learning model development and explainability analysis.
Data source
The study utilised data from the National Health and Nutrition Examination Survey (NHANES), a nationally representative health survey conducted by the National Centre for Health Statistics (NCHS) of the Centres for Disease Control and Prevention (CDC). NHANES employs a complex multistage probability sampling design to collect information on the health and nutritional status of the United States population. The survey combines interviews, questionnaires, physical examinations and laboratory assessments, providing a comprehensive source of population health information. NHANES data are publicly available, anonymised and widely used in epidemiological and public health research.
The present study incorporated information from multiple
NHANES modules, including:
a) Depression Screener Questionnaire (DPQ)
b) Demographic Variables and Sample Weights (DEMO)
c) Sleep Disorders Questionnaire (SLQ)
d) Smoking Questionnaire (SMQ)
e) Body Measures Examination (BMX)
f) Physical Activity Questionnaire (PAQ)
g) Alcohol Use Questionnaire (ALQ)
h) Diabetes Questionnaire (DIQ)
These datasets were merged using the unique participant identifier (SEQN).
Study sample
The Depression Screener dataset initially contained 6,337 participants. Following the integration of additional datasets and the removal of observations containing missing values within selected variables, the final analytical sample consisted of 4,227 adults. Participants included in the final dataset possessed complete information for all variables used in the analysis. The resulting dataset contained both individuals with and without clinically significant depressive symptoms, allowing the development and evaluation of predictive models.
Outcome variable
Depressive symptoms were assessed using the Patient Health Questionnaire-9 (PHQ-9), one of the most widely used screening instruments for depression in epidemiological and clinical research [38]. The PHQ-9 consists of nine items measuring depressive symptoms experienced during the preceding two weeks. Each item is scored on a four-point scale ranging from 0 (“not at all”) to 3 (“nearly every day”), resulting in a total score ranging from 0 to 27. Consistent with established clinical recommendations, participants with PHQ-9 scores of 10 or greater were classified as experiencing clinically significant depressive symptoms. A binary outcome variable was therefore created:
a) Depression=1 (PHQ-9≥10)
b) Depression=0 (PHQ-9<10)
This threshold has been shown to demonstrate good sensitivity and specificity for identifying probable major depression [39].
Predictor variables
Ten predictor variables representing demographic, socioeconomic, lifestyle and health-related characteristics were included in the analysis.
Demographic Variables
a) Age
b) Gender
c) Ethnicity
Socioeconomic Variable
a) Income-Poverty Ratio
Lifestyle Variables
a) Sleep Hours
b) Smoking Status
c) Sedentary Minutes
d) Alcohol Frequency
Health Variables
a) Body Mass Index (BMI)
b) Diabetes Status
These variables were selected based on existing evidence linking them to depression risk and their availability within the NHANES dataset.
Data preparation
Data preparation was conducted using Python. NHANES datasets were imported from SAS Transport (.XPT) files and merged using the participant identifier (SEQN).
Several preprocessing procedures were undertaken:
A. Removal of duplicate records.
B. Handling of missing values and special NHANES response
codes.
C. Calculation of PHQ-9 total scores.
D. Creation of the binary depression outcome variable.
E. Selection of relevant predictor variables.
F. Integration of lifestyle and health indicators from multiple
NHANES modules.
Continuous variables were retained in their original form, while categorical variables were coded according to NHANES documentation.
Exploratory data analysis
Exploratory Data Analysis (EDA) was conducted to examine the characteristics of the study population and identify potential associations between predictor variables and depression status. Descriptive statistics were calculated for all variables. Continuous variables were summarised using means and standard deviations, while categorical variables were summarised using frequencies and percentages.
Group differences between depressed and non-depressed participants were assessed using:
a) Independent samples t-tests for continuous variables.
b) Chi-square tests for categorical variables.
Pearson correlation analysis was additionally performed to explore relationships among selected continuous variables.
Machine learning models
Five machine learning algorithms were implemented:
A. Logistic Regression
B. Decision Tree
C. Random Forest
D. Gradient Boosting
E. Support Vector Machine (SVM)
The dataset was partitioned into training (80%) and testing (20%) subsets using stratified random sampling to preserve class distribution. Feature standardisation was applied where appropriate using the Standard Scaler procedure.
Model performance was evaluated using:
a) Accuracy
b) Precision
c) Recall
d) F1-score
e) Area Under the Receiver Operating Characteristic Curve
(ROC-AUC)
Confusion matrices were also examined to evaluate classification behaviour.
Class imbalance handling
The prevalence of depression within the dataset was substantially lower than the prevalence of non-depression. To investigate the influence of class imbalance, the Synthetic Minority Oversampling Technique (SMOTE) was applied to the training data. SMOTE generates synthetic examples of minority class observations and is widely used in healthcare prediction studies involving imbalanced datasets [40]. The performance of machine learning models before and after SMOTE application was compared to determine whether class balancing improved predictive performance.
Deep learning model
A Multilayer Perceptron (MLP) neural network was developed
using Tensor Flow and Keras.
The neural network architecture consisted of:
a) Input layer containing the selected predictor variables
b) Three hidden layers with Rectified Linear Unit (ReLU)
activation functions
c) Dropout layers to reduce overfitting
d) Output layer with a sigmoid activation function
Binary cross-entropy was used as the loss function and the Adam optimiser was employed during training.
To address class imbalance, an additional class-weighted neural network was developed. Early stopping was implemented to prevent overfitting and improve generalisation performance.
Explainability analysis
Interpretability was assessed using two complementary approaches.
First, Random Forest feature importance scores were examined to identify variables contributing most strongly to model predictions. Second, Logistic Regression coefficients were analysed to determine the direction and magnitude of associations between predictor variables and depression risk. The use of interpretable machine learning techniques enabled the identification of influential demographic, socioeconomic, lifestyle and healthrelated predictors while maintaining transparency in model decision-making.
Ethical considerations
The study utilised publicly available, de-identified NHANES data. No direct contact with participants occurred and no personally identifiable information was accessed. As the research involved secondary analysis of anonymised public-use data, additional participant consent was not required. The study adhered to ethical principles governing the responsible use of publicly available research data.
Result
Participant characteristics
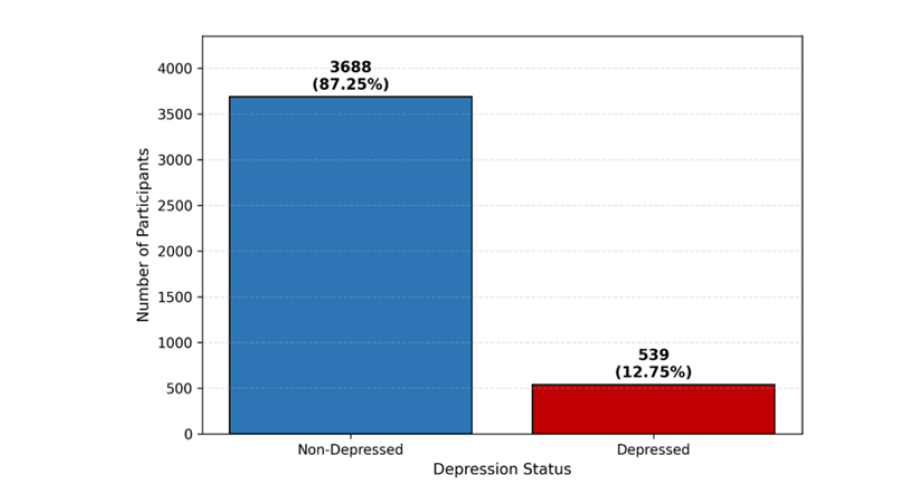
The study initially included 6,337 participants from the NHANES 2021–2023 Depression Screener dataset. Following the integration of demographic, sleep, smoking, body measurement, physical activity, alcohol consumption and diabetes-related variables and the removal of incomplete observations, the final analytical sample consisted of 4,227 adults. Depressive symptoms were assessed using the Patient Health Questionnaire-9 (PHQ-9). Participants with a PHQ-9 score of 10 or above were classified as experiencing clinically significant depressive symptoms. Based on the PHQ-9 classification criterion, 539 participants (12.75%) were identified as experiencing clinically significant depressive symptoms, whereas 3,688 participants (87.25%) were classified as non-depressed. The distribution of depression status within the analytical sample is presented in Figure 1. As shown, the prevalence of depression was substantially lower than the prevalence of non-depression, The prevalence observed in the present sample indicates that depressive symptoms remain a relevant public health concern within the adult population. Although the majority of participants did not meet the threshold for clinically significant depressive symptoms, more than one in ten participants were classified as depressed, highlighting the continuing burden of mental health difficulties within the community
Figure 1:Depression prevalence in the analytical sample.
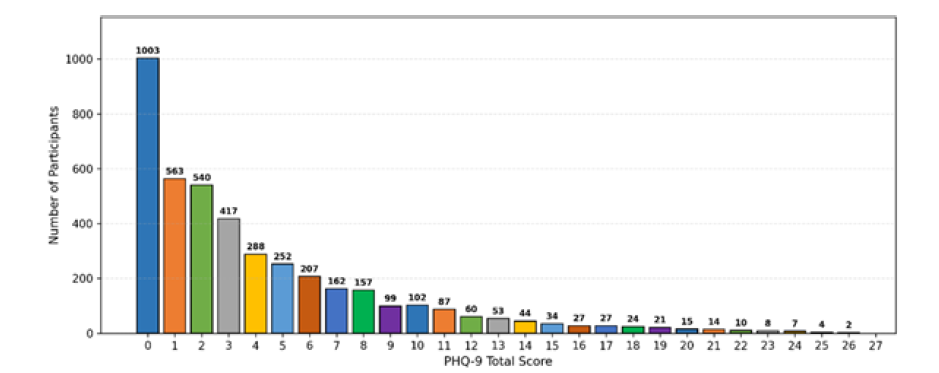
The distribution of PHQ-9 scores is illustrated in Figure 2. The majority of participants reported relatively low symptom scores, while progressively fewer participants were observed at higher levels of depression severity. This pattern is consistent with population-based mental health surveys in which severe depressive symptoms are less common than mild or absent symptoms. The PHQ-9 distribution demonstrates a clear concentration of observations at lower score ranges, accompanied by a gradual decline in frequency as symptom severity increases. This distribution further supports the observed class imbalance and provides an overview of depressive symptom severity within the study population.
Figure 2:Distribution of PHQ-9 scores among study participants.
Comparison of depressed and non-depressed participants
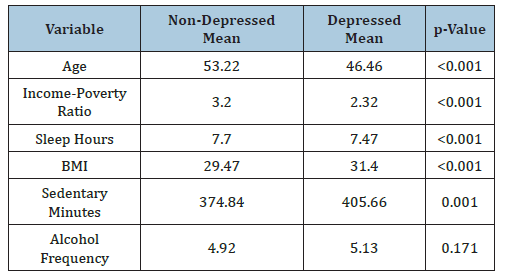
Table 1 presents the comparison between participants with and without depressive symptoms.
Several statistically significant differences were observed between the two groups. Participants classified as depressed were younger on average than those without depressive symptoms (46.46 years versus 53.22 years, p<0.001). Income-poverty ratio also differed substantially between groups. Individuals experiencing depressive symptoms reported lower income-poverty ratios (2.32) than non-depressed participants (3.20), indicating a possible association between socioeconomic disadvantage and depression risk. Sleep duration showed a modest but statistically significant difference. Depressed participants reported fewer hours of sleep compared with non-depressed individuals (7.47 versus 7.70 hours, p < 0.001). Body Mass Index (BMI) was significantly higher among participants with depressive symptoms (31.40kg/m²) than among those without depression (29.47kg/m², p<0.001). Sedentary behaviour also appeared to be associated with depression. Participants with depressive symptoms reported spending more time engaged in sedentary activities than non-depressed participants (405.66 versus 374.84 minutes per day, p=0.001). In contrast, alcohol frequency did not demonstrate a statistically significant difference between groups (p=0.171), suggesting that alcohol consumption patterns in this sample were not strongly associated with depression status. Significant associations were additionally identified for gender, ethnicity, smoking status and diabetes status. Female participants demonstrated a higher prevalence of depressive symptoms than male participants. Smoking and diabetes were also more common among individuals classified as depressed.
Table 1:Presents the comparison between participants with and without depressive symptoms.
Correlation analysis
Correlation analysis revealed several noteworthy relationships between the predictor variables and PHQ-9 scores. The strongest negative correlations with depressive symptoms were observed for income-poverty ratio (r=-0.219) and age (r=-0.184). These findings indicate that lower socioeconomic status and younger age were associated with higher depression severity. Body mass index demonstrated a positive correlation with PHQ-9 scores (r=0.117), suggesting that higher levels of obesity may be linked to greater depressive symptom burden. Sedentary behaviour was also positively associated with depressive symptoms (r=0.090), whereas sleep duration exhibited a weak negative association (r=- 0.057). Overall, the correlation analysis suggests that depressive symptoms are influenced by multiple demographic, socioeconomic, lifestyle and health-related factors rather than a single dominant predictor.
Machine learning model performance
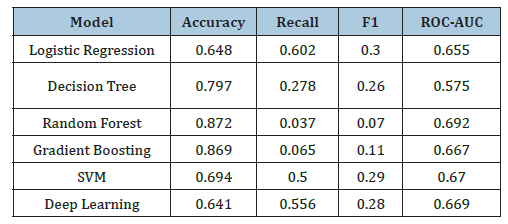
Five machine learning algorithms were evaluated for depression risk assessment: Logistic Regression, Decision Tree, Random Forest, Gradient Boosting and Support Vector Machine (SVM). The results demonstrated substantial variation across models. Random Forest achieved the highest discrimination performance with a ROC-AUC value of 0.692. However, despite its high overall accuracy (87.2%), the model correctly identified only a small proportion of depressed participants, producing a recall of 3.7%. Logistic Regression demonstrated a different performance profile. Although its ROCAUC value was lower (0.655), it achieved the highest recall (60.2%) among all machine learning models. This indicates that Logistic Regression was more successful in identifying individuals with depressive symptoms, despite generating a larger number of false positive classifications. The Support Vector Machine achieved a ROC-AUC of 0.670 and a recall of 50.0%, representing a compromise between discrimination performance and sensitivity. Decision Tree and Gradient Boosting models produced comparatively weaker results. A comparison of ROC-AUC values across machine learning and deep learning models is presented in Figure 3. As shown in Figure 3, Random Forest achieved the highest ROC-AUC value, followed by Support Vector Machine, Deep Learning and Gradient Boosting. However, higher discrimination performance did not necessarily correspond to improved identification of depressed individuals, highlighting the importance of considering multiple evaluation metrics when assessing depression risk models. Overall, the findings suggest that no single machine learning model achieved strong predictive performance. Nevertheless, Logistic Regression and SVM demonstrated greater utility for identifying individuals at risk of depression, whereas Random Forest provided the highest overall discrimination capability (Table 2).
Figure 3:ROC-AUC comparison across machine learning and deep learning models.
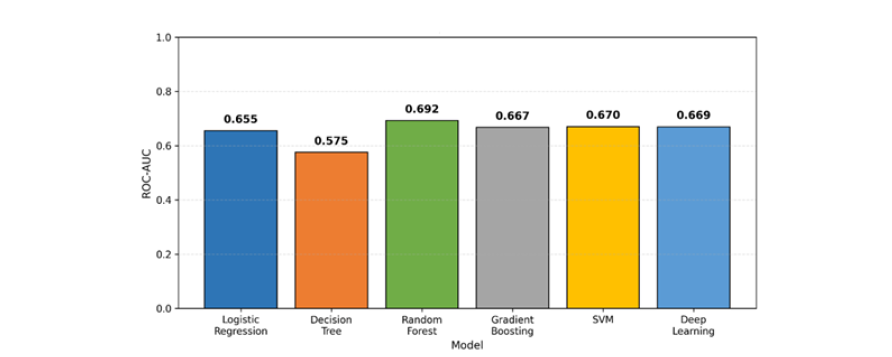
Table 2:Performance comparison of machine learning and deep learning models for depression risk assessment.
Effects of class balancing
To investigate the influence of class imbalance, Synthetic Minority Oversampling Technique (SMOTE) was applied to the training data. The balanced dataset produced only modest changes in predictive performance. Logistic Regression remained the strongest model in terms of recall, identifying approximately 59% of depressed participants. Random Forest, Gradient Boosting and SVM showed limited improvements, while overall discrimination performance remained similar to that observed in the original analyses. These findings suggest that class imbalance was not the primary factor limiting model performance. Instead, the available demographic, socioeconomic, lifestyle and health-related variables appear to provide only moderate predictive information regarding depression risk.
Deep learning performance
A multilayer perceptron neural network was developed to evaluate whether deep learning could improve prediction performance. The initial neural network achieved a ROC-AUC of 0.654, which was comparable to Logistic Regression. However, the model classified all participants as non-depressed when using the default decision threshold, resulting in zero recall. To address this issue, a class-weighted neural network was subsequently developed. The revised model achieved a ROC-AUC of 0.669, a recall of 55.6% and an F1-score of 0.283. Although these results were an improvement over the initial neural network, they remained broadly similar to those obtained from traditional machine learning methods. The findings indicate that deep learning did not provide a substantial predictive advantage over simpler and more interpretable machine learning approaches for the current dataset.
Explainability analysis
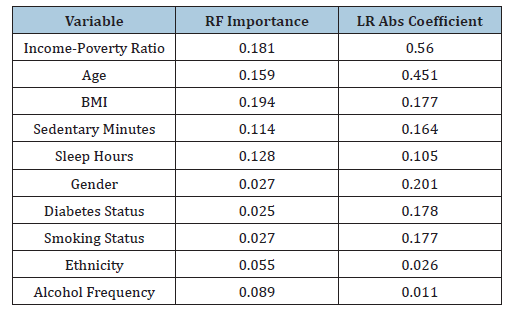
Explainability analysis was conducted using Random Forest feature importance and Logistic Regression coefficients. Table 3 presents the relative importance of selected predictors in the depression risk assessment models. Random Forest importance values indicate each variable’s contribution to model prediction, whereas Logistic Regression coefficients show the direction and relative strength of association with depressive symptoms after standardisation. Larger importance values and larger absolute coefficient values indicate stronger influence within the respective model. The Random Forest model identified body mass index, income-poverty ratio, age, sleep duration and sedentary behaviour as the most influential predictors of depression risk. The relative importance of predictors identified by the Random Forest model is shown in Figure 4. Figure 4 demonstrates that body mass index, income-poverty ratio and age contributed most strongly to prediction performance. Sleep duration and sedentary behaviour also exhibited meaningful contributions, whereas smoking status, gender and diabetes status demonstrated comparatively lower importance values. Logistic Regression produced a similar pattern, with income-poverty ratio and age emerging as the strongest predictors. The consistency observed across statistical analysis, machine learning models and explainability techniques strengthens confidence in these findings. In particular, socioeconomic status, age, obesity, sleep behaviour and sedentary lifestyle repeatedly emerged as important factors associated with depressive symptoms. Alcohol frequency demonstrated minimal influence across all analyses, indicating that its contribution to depression risk within the present sample was limited. In contrast, variables reflecting social and health disadvantage appeared to play a more substantial role in depression risk assessment.
Figure 4:Random forest feature importance ranking.
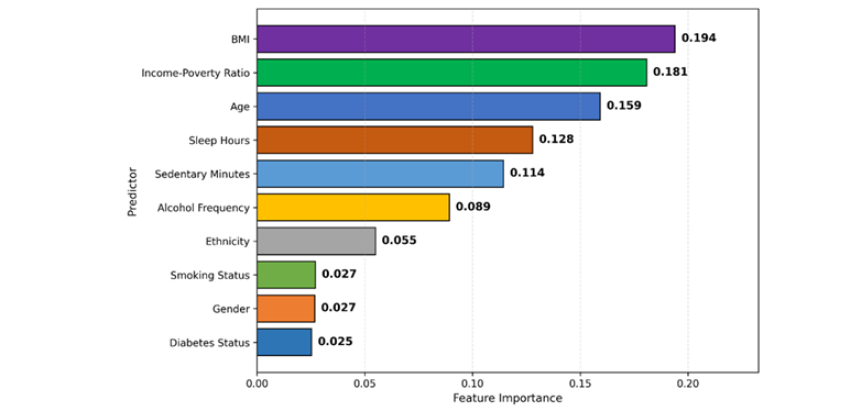
Table 3:Relative importance of predictors associated with depressive symptoms based on Random Forest and Logistic Regression analyses.
Discussion
The present study investigated the application of interpretable machine learning techniques for depression risk assessment using demographic, socioeconomic, lifestyle and health-related variables obtained from the NHANES 2021–2023 dataset. The findings highlighted that a strong association exists between depressive symptoms and several factors, including socioeconomic status, age, body mass index, sleep duration, sedentary behaviour, smoking status and diabetes status. The results showed that traditional machine learning models performed similarly to deep learning approaches, highlighting the value of interpretable machine learning in mental health risk assessment. One of the most important findings of this study was the consistent usefulness of socioeconomic status in mental health risk assessment. For instance, the income-poverty ratio was consistently identified as an important variable across all three analyses: Descriptive statistics, correlation analysis and machine learning. Participants experiencing depression reported significantly lower income-poverty ratios than non-depressed individuals. The findings reveal that socioeconomic disadvantage is still associated with a higher risk of depression in the recent nationally representative NHANES dataset when analysed using interpretable machine learning models. Therefore, interpretable machine learning can better support health-related decision making than traditional machine learning by providing transparent model interpretations while identifying individuals at risk of depression associated with financial hardship.
Age was also identified as an important predictor of depressive symptoms. The present study reports that younger people experience higher levels of depressive symptoms than older people. This may happen due to employment uncertainty, financial pressures, educational challenges and social transitions [18,41]. The study shows that age is still an important predictor in recent NHANES data analysed using interpretable machine learning models. The present findings provide further support for the importance of age-specific approaches to mental health prevention and intervention. Body Mass Index (BMI) was identified as another key predictor by both the statistical analyses and machine learning models. Participants with depression were found to have a higher BMI than participants without depression. These findings are consistent with previous research suggesting that physical health is inherently connected to mental health. In fact, many studies have identified a bidirectional relationship between obesity and depression: Obesity increases the risk of depression, but depression can also cause individuals to gain weight [3]. The current study shows that BMI is still a useful predictor when controlling for many other factors in a modern, nationally representative dataset and that this relationship is consistent across different forms of analysis. These relationships provide additional support for the integration of physical health metrics into interpretable machine learning models predicting risk of depression. Variables that were related to participant’s lifestyle also provided important information for predicting depression. Participants who screened positive for depression reported less daily sleep and more daily sedentary time than those who did not screen positive for depression. Prior work has shown that these factors are linked to negative mental health outcomes [5,42]. However, the current study expands upon previous work by showing that lifestyle factors may continue to play a significant role when analysed alongside many demographic, socioeconomic and physical health factors through the lens of interpretable ML. Thus, clinicians should not view lifestyle factors in isolation. Smoking status and diabetes status were also identified as significant factors associated with depressive symptoms. Smoking has been established as a behavioural risk factor for depression for some time now and diabetes is among the most prevalent chronic conditions that are known to accompany greater psychological distress [4,7]. The current results highlight the value of assessing behavioural and physical health conditions in tandem when predicting risk for depression. Moreover, these variables were identified across multiple analytical methods, strengthening confidence in the robustness of the findings.
This study is based on structured medical tabular data and the design of comparing the performance of traditional machine learning and deep learning models constitutes one of its core methodological contributions. Although the class-weight neural network outperformed the initial neural network, its overall predictive performance remained comparable to Logistic Regression and Support Vector Machine models. These findings demonstrate that increasing model complexity does not necessarily improve predictive performance when analysing structured tabular datasets [31]. The present findings suggest that traditional machine learning models may achieve comparable predictive performance while providing greater transparency and explainability, along with lower computational complexity. Another important contribution of this study lies in the application of interpretable ML techniques using a nationally representative population-based dataset. Unlike previous studies that have focused on specific clinical or regional populations [33,34], the present study demonstrates the usefulness of interpretable machine learning using a recent nationally representative population dataset. Feature importance analysis and logistic regression coefficients consistently identified incomepoverty ratio, age, body mass index, sleep duration and sedentary behaviour as the most influential predictors of depression. Using multiple explainability methods increased confidence in the robustness of the results and showed that the identified predictors remained consistent across different analytical approaches. Importantly, the consistency of these findings across multiple analytical approaches demonstrates that interpretable machine learning can provide transparent and reliable identification of depression risk factors without requiring highly complex deep learning architectures. Interpretable machine learning models can support clinicians and public health practitioners in understanding which factors contribute most to depression risk and how these factors jointly contribute to depression risk, thereby supporting more transparent and evidence-informed decision making.
Limitations and Future Research Directions
Several limitations should be considered when interpreting the findings of the present study.
First, the study utilised a cross-sectional research design based on data obtained from the NHANES 2021–2023 survey cycle. As a result, the observed relationships between predictor variables and depressive symptoms should not be interpreted as causal associations. Although variables such as socioeconomic status, body mass index, sedentary behaviour, smoking status and diabetes were associated with depression risk, the direction of these relationships cannot be established within the current study design. Depression may influence lifestyle and health behaviours in the same way that lifestyle and health factors may influence depression. Longitudinal studies would therefore be required to examine causal pathways and temporal relationships more effectively.
Second, depression status was determined using the Patient Health Questionnaire-9 (PHQ-9), a widely accepted and validated screening instrument. Although the PHQ-9 demonstrates strong psychometric properties and is frequently used in epidemiological research, it does not constitute a formal clinical diagnosis of major depressive disorder. Consequently, the outcome variable used in this study reflects depressive symptomatology rather than clinically confirmed psychiatric diagnoses.
Third, several potentially important psychosocial factors were not available within the analytical dataset used in the present study. Variables such as social support, relationship status, occupational stress, adverse childhood experiences, anxiety symptoms, traumatic life events and perceived stress have been shown to influence mental health outcomes in previous research. The absence of these variables may have contributed to the moderate predictive performance observed across machine learning and deep learning models.
Fourth, although multiple machine learning and deep learning approaches were evaluated, the predictive performance achieved by the models remained moderate. The highest ROCAUC value obtained was approximately 0.69, indicating that the selected demographic, socioeconomic, lifestyle and health-related variables capture only part of the complex mechanisms underlying depression. Mental health disorders are influenced by a broad range of biological, psychological, environmental and social factors that are difficult to fully represent within a single dataset.
Fifth, the study focused exclusively on data from the United States population. While NHANES provides a nationally representative sample, the findings may not be directly generalisable to populations with different healthcare systems, cultural contexts, socioeconomic structures, or mental health service provisions. Future studies should examine whether similar predictor patterns emerge in datasets obtained from other countries and healthcare settings.
Despite these limitations, the study provides several opportunities for future research. First, future investigations could incorporate longitudinal datasets to examine changes in depression risk over time and explore causal relationships between predictor variables and mental health outcomes. Longitudinal analyses may provide a more comprehensive understanding of how socioeconomic, lifestyle and health-related factors contribute to the development and progression of depressive symptoms.
Second, future research could integrate a broader range of psychosocial variables, including social isolation, employment status, family structure, stress exposure and psychological resilience. The inclusion of such variables may improve predictive performance and provide a more holistic understanding of depression risk.
Third, external validation using independent datasets would strengthen confidence in model generalisability. Replicating the present findings in datasets such as Understanding Society, the Health Survey for England, the UK Biobank, or other international health surveys could help determine the consistency of depression risk factors across different populations.
Fourth, future studies may benefit from evaluating additional explainable artificial intelligence techniques, including SHAP (Shapley Additive explanations), Local Interpretable Model- Agnostic Explanations (LIME) and other advanced explainability frameworks. Such approaches may provide more detailed insight into individual-level prediction mechanisms and support greater transparency in mental health decision-support systems. Future studies should also evaluate whether these interpretable machine learning models can be applied effectively in real-world clinical and public health settings.
Finally, future research should continue to investigate the balance between predictive performance and interpretability. Although increasingly complex artificial intelligence models have attracted considerable attention in healthcare research, the findings of the present study suggest that simpler and more transparent approaches may offer comparable practical value. Future research should continue to investigate when increased model complexity provides meaningful clinical benefit while maintaining transparency and interpretability in mental health prediction.
Conclusion
Depression continues to represent one of the most significant mental health challenges worldwide, affecting individuals across different age groups, socioeconomic backgrounds and health conditions. The growing availability of large-scale health datasets and advances in artificial intelligence have created new opportunities to explore factors associated with depression risk and to develop data-driven approaches for mental health assessment. In response to this need, the present study investigated the application of interpretable machine learning techniques for depression risk assessment using demographic, socioeconomic, lifestyle and healthrelated variables derived from the NHANES 2021–2023 dataset. Using a final analytical sample of 4,227 adults, the study combined exploratory statistical analysis, traditional machine learning algorithms, deep learning models and explainability techniques to examine factors associated with depressive symptoms. The findings demonstrated that depressive symptoms are influenced by multiple interconnected factors rather than a single dominant predictor. Significant differences were observed between depressed and non-depressed participants across several variables, including age, income-poverty ratio, body mass index, sleep duration, sedentary behaviour, smoking status and diabetes status. Among these factors, socioeconomic status emerged as one of the most influential predictors across multiple analytical approaches. Lower income-poverty ratios were consistently associated with elevated depression risk, highlighting the important relationship between social disadvantage and mental health outcomes. Age, body mass index, sleep duration and sedentary behaviour also demonstrated meaningful associations with depressive symptoms, suggesting that both socioeconomic and lifestyle-related factors contribute to depression risk within the population. In contrast, alcohol frequency showed limited predictive value in the present analysis, indicating that its contribution to depression risk may be more complex than simple measures of consumption frequency can capture.
The machine learning analyses revealed moderate predictive performance overall. Logistic Regression demonstrated the strongest ability to identify individuals experiencing depressive symptoms, while Random Forest achieved the highest discrimination performance. Deep learning models did not substantially outperform traditional machine learning approaches and the class-weighted neural network produced results that were broadly comparable to simpler methods. These findings suggest that increasing model complexity does not necessarily lead to improved performance when analysing structured population health data. From a practical perspective, interpretable models may offer comparable predictive utility while providing greater transparency and ease of implementation. The explainability analyses further strengthened the findings by identifying the variables that contributed most strongly to depression risk assessment. Incomepoverty ratio, age, body mass index, sleep duration and sedentary behaviour consistently emerged as influential predictors across statistical and machine learning analyses. The convergence of evidence across multiple analytical approaches increases confidence in the robustness of these findings and reinforces the value of interpretable machine learning in mental health research. In conclusion, this study demonstrates that interpretable machine learning can provide meaningful insight into factors associated with depressive symptoms while maintaining transparency in model decision-making. Although predictive performance remained moderate, the findings highlight the importance of socioeconomic conditions, lifestyle behaviours and health status in understanding depression risk. The results also suggest that simpler and more interpretable machine learning approaches may be preferable to more complex models when transparency and practical applicability are important considerations. As the adoption of machine learning in healthcare continues to expand, transparent, interpretable and clinically meaningful prediction models will remain essential for supporting evidence-based mental health assessment and decision making.
Acknowledgement
The author would like to thank the National Centre for Health Statistics (NCHS) for providing publicly available NHANES data used in this study.
References
- World Health Organization (2023) Depression. World Health Organization.
- Lorant V, D Deliège, Eaton W, Robert A, Philippot P, et al. (2003) Socioeconomic inequalities in depression: A meta-analysis. American Journal of Epidemiology 157(2): 98-112.
- Luppino FS, de Wit LM, Bouvy PF, Theo Stijnen, Cuijpers P, et al. (2010) Overweight, obesity, and depression: A systematic review and meta-analysis of longitudinal studies. Archives of General Psychiatry 67(3): 220-229.
- Fluharty M, Taylor AE, Grabski M, Marcus R Munafò (2017) The association of cigarette smoking with depression and anxiety: A systematic review. Nicotine & Tobacco Research 19(1): 3-13.
- Kandola A, Ashdown-Franks G, Hendrikse J, Sabiston CM, Stubbs B (2020) Physical activity and depression: Towards understanding the antidepressant mechanisms of physical activity. Neuroscience & Biobehavioural Reviews 107: 525-539.
- Patel V, Saxena S, Lund C, Thornicroft G, Baingana F, et al. (2018) The Lancet Commission on global mental health and sustainable development. The Lancet 392(10157): 1553-1598.
- Golden SH, Lazo M, Mercedes Carnethon, Bertoni AG, Schreiner PJ, et al. (2008) Examining a bidirectional association between depressive symptoms and diabetes. JAMA 299(23): 2751-2759.
- Baglioni C, Gemma Battagliese, Feige B, Kai Spiegelhalder, Nissen C, et al. (2011) Insomnia as a predictor of depression: A meta-analytic evaluation of longitudinal epidemiological studies. Journal of Affective Disorders 135(1-3): 10-19.
- Graziella Orrù, Monaro M, Conversano C, Gemignani A, Sartori G (2020) Machine learning in psychometrics and psychological research. Frontiers in Psychology 10: 2970.
- LeCun Y, Bengio Y, Hinton G (2015) Deep learning. Nature 521(7553): 436-444.
- Rudin C (2019) Stop explaining black box machine learning models for high stakes decisions and use interpretable models instead. Nature Machine Intelligence 1(5): 206-215.
- Engel GL (1977) The need for a new medical model: A challenge for biomedicine. Science 196(4286): 129-136.
- World Health Organization (2022) World mental health report: Transforming mental health for all. World Health Organization, Geneva, Switzerland.
- Patel V, Chisholm D, Parikh R, Charlson FJ, Degenhardt L, et al. (2016) Addressing the burden of mental, neurological, and substance use disorders: Key messages from disease control priorities, 3rd The Lancet 387(10028): 1672-1685.
- Dougall I, Vasiljevic M, Wright JD, Weick M (2024) How, when, and why is social class linked to mental health and wellbeing? A systematic meta-review. Social Science & Medicine 343: 116542.
- Salk RH, Hyde JS, Abramson LY (2017) Gender differences in depression in representative national samples: Meta-analyses of diagnoses and symptoms. Psychological Bulletin 143(8): 783-822.
- Fiske A, Wetherell JL, Gatz M (2009) Depression in older adults. Annual Review of Clinical Psychology 5: 363-389.
- Twenge JM, Cooper AB, Joiner TE, Duffy ME, Binau SG (2019) Age, period, and cohort trends in mood disorder indicators and suicide-related outcomes in a nationally representative dataset. Journal of Abnormal Psychology 128(3): 185-199.
- Marx W, Brenda W JH Penninx, Marco Solmi, Furukawa TA, Firth J, et al. (2023) Major depressive disorder. Nature Reviews Disease Primers 9(1): 44.
- Zhao Y, Yang L, Sahakian BJ, Langley C, Zhang W, et al. (2023) The brain structure, immunometabolism and genetic mechanisms underlying the association between lifestyle and depression. Nature Mental Health 1: 736-750.
- Shinnosuke Yasugaki, Okamura H, Kaneko A, Hayashi Y (2025) Bidirectional relationship between sleep and depression. Neuroscience Research 211: 57-64.
- Schuch FB, Davy Vancampfort, Firth J, Rosenbaum S, Ward PB, et al. (2018) Physical activity and incident depression: A meta-analysis of prospective cohort studies. American Journal of Psychiatry 175(7): 631-648.
- Hu Z, Cui E, Chen B, Zhang M (2025) Association between cigarette smoking and the risk of major psychiatric disorders: A systematic review and meta-analysis in depression, schizophrenia, and bipolar disorder. Frontiers in Medicine 12: 1529191.
- Boden JM, Fergusson DM (2011) Alcohol and depression. Addiction 106(5): 906-914.
- Berk M, Köhler-Forsberg O, Turner M, Brenda W JH Penninx, Wrobel A, et al. (2023) Comorbidity between major depressive disorder and physical diseases: A comprehensive review of epidemiology, mechanisms and management. World Psychiatry 22(3): 366-387.
- De Groot M (2023) Diabetes and depression: Strategies to address a common comorbidity within the primary care context. American Journal of Medicine Open 9: 100039.
- Adam M Chekroud, Bondar J, Delgadillo J, Doherty G, Wasil A, et al. (2021) The promise of machine learning in predicting treatment outcomes in psychiatry. World Psychiatry 20(2): 154-170.
- Ghassemi M, Oakden-Rayner L, Beam AL (2021) The false hope of current approaches to explainable artificial intelligence in health care. The Lancet Digital Health 3(11): e745-e750.
- Arun Thirunavukarasu, Jessica O'Logbon (2024) The potential and perils of generative artificial intelligence in psychiatry and psychology. Nature Mental Health 2(7): 745-746.
- Shickel B, Tighe PJ, Bihorac A, Rashidi P (2018) Deep learning in electronic health records: A systematic review. Journal of Biomedical Informatics 83: 168-185.
- Grinsztajn L, Oyallon E, Varoquaux G (2022) Why do tree-based models still outperform deep learning on typical tabular data? Advances in Neural Information Processing Systems (NeurIPS) 35: 507-520.
- Borisov V, Tobias Leemann, Kathrin Seßler, Haug J, Pawelczyk M, et al. (2024) Deep neural networks and tabular data: A survey. IEEE Transactions on Neural Networks and Learning Systems 35(6): 7499-7519.
- Xiao Y, Zhao Z, Su CG, Li J, Liu J (2025) An interpretable machine learning model for predicting depression in middle-aged and elderly cancer patients in China: A study based on the CHARLS cohort. BMC Psychiatry 25: 610.
- Jamali AA, Berger C, Spiteri RJ (2024) Identification of depression predictors from standard health surveys using machine learning. Current Research in Behavioural Sciences 7: 100157.
- Li E, Guo B, Ai F, Wen K, Tong Y, et al. (2026) Development and external validation of an interpretable machine learning-based prediction model for depressive symptoms in patients with obstructive sleep apnea: A multicentre study. Brain and Behaviour 16(4): e71399.
- Markus AF, Kors JA, Rijnbeek PR (2021) The role of explainability in creating trustworthy artificial intelligence for health care: A comprehensive survey of the terminology, design choices, and evaluation strategies. Journal of Biomedical Informatics 113: 103655.
- Antoniadi AM, Du Y, Guendouz Y, Wei L, Mazo C, et al. (2021) Current challenges and future opportunities for XAI in machine learning-based clinical decision support systems: A systematic review. Applied Sciences 11(11): 5088.
- Kroenke K, Spitzer RL, Williams JBW (2001) The PHQ-9: Validity of a brief depression severity measure. Journal of General Internal Medicine 16(9): 606-613.
- Manea L, Gilbody S, McMillan D (2012) Optimal cut-off score for diagnosing depression with the Patient Health Questionnaire (PHQ-9): A meta-analysis. Canadian Medical Association Journal 184(3): E191-E196.
- Chawla NV, Bowyer KW, Hall LO, Kegelmeyer WP (2002) SMOTE: Synthetic minority over-sampling technique. Journal of Artificial Intelligence Research 16: 321-357.
- Ettman CK, Abdalla SM, Cohen GH, Sampson L, Vivier PM, et al. (2020) Prevalence of depression symptoms in US adults before and during the COVID-19 pandemic. JAMA Network Open 3(9): e2019686.
- Walker MP (2017) Why we sleep: Unlocking the power of sleep and dreams. Scribner, New York, USA.
© 2026 Mizanur Rahman Md, This is an open access article distributed under the terms of the Creative Commons Attribution License , which permits unrestricted use, distribution, and build upon your work non-commercially.
Editor In Chief







.jpg)































Signup for Newsletter

Quick Links
 Editorial Board Registrations
 Submit your Article
 Best Paper of the Volume
 Reprints
 Refer a Friend
 Advertise With Us
Our Recent Edition

.jpg)



Top Editors




.jpg)

















.bmp)
.jpg)
.png)
.jpg)













.jpg)






.png)

.png)




.png)




Financial Support

Sponsors

Latest e-Books

Latest Video

 a Creative Commons Attribution 4.0 International License. Based on a work at www.crimsonpublishers.com.
Best viewed in
a Creative Commons Attribution 4.0 International License. Based on a work at www.crimsonpublishers.com.
Best viewed in 
 | Above IE 9.0 version