
- About Us
- Information
-

The Author ensures that the research has been conducted responsibly and ethically with adherence to all relevant regulations. read more..
- For Authors
- For Reviewer
- Manuscript Guidelines
- Membership
- Publication Ethics
-
- Journals
- Reprints
- e-Books
- Videos
- Policies
- Contact Us
 COVID-19
- Submissions


Full Text
Novel Research in Sciences
Investigation on the Effects of Hydrogen and Natural Gas Blending Flow Characteristics in Various Static Mixers
Yanfang Zhao1, Jun Zhao2, Yongzhen Liu1*, Kepu Zhang3, Liqian Zhao3 and Fuhua Dang3
1School of Vehicle and Mobility Tsinghua University, China
2China Petroleum and Natural Gas Research Institute, China
3China Petroleum and Natural Gas Pipeline Transportation Research Centre, China
*Corresponding author:Yongzhen Liu, School of Vehicle and Mobility Tsinghua University, Beijing, 100084, China
Submission: May 30, 2025;Published: June 16, 2025
.jpg)
Volume16 Issue 5June 16, 2025
Abstract
Hydrogen blending of natural gas is an effective way to achieve carbon neutrality. In order to evaluate the influence of different static mixers on the mixing performance of natural gas and hydrogen, numerical simulation methods were used to analyze in detail the effects of SMX type static mixers, LPD type static mixers and KSM type static mixers on the mixing uniformity, internal flow field structure and pressure loss of natural gas and hydrogen. The results show that in terms of blending uniformity, SMX static mixer>LPD static mixer>KSM static mixer. Based on flow characteristics, the spiral plate of the KSM static mixer reduces the time and opportunity for air flow to contact with each other, the two elliptical plates of the LPD static mixer promote the mixing of the mixed gas to generate eddy current and the SMX static mixer can realize the mixing in two dimensions: Flow direction and radial direction. For pressure loss, the pressure loss of the three static mixers increased with the increase of the number of mixing units and basically showed a linear increase and the pressure loss of the LPD static mixer was about twice that of the SMX static mixer and the KSM static mixer.
Keywords: Static mixer; Hydrogen natural gas blending; Hydrogen mixing element; Mixing uniformity; Flow characteristic
Nomenclature: A: Cross-sectional area of the pipeline; c: Volume fraction of each sampling point; : Volume average concentration at the static mixer outlet; D1: Inlet pipe diameters of natural gas, mm; D2: Inlet pipe diameters of hydrogen, mm; ΔP: Pressure loss; σ: Standard deviation; ζ: Concentration mixing influence factor
Introduction
Energy is an integral part of our daily lives and social development, with fossil fuels such as oil, gas and coal providing more than 80% of total global energy consumption [1,2]. In the case of the increasing energy crisis, the dual carbon goal of “carbon peak” in 2030 and “carbon neutrality” in 2060 is proposed to accelerate the transformation of the energy structure [3,4]. As an efficient zero-carbon clean energy with a wide range of applications, hydrogen energy is an important link between traditional fossil energy and renewable energy [5]. Hydrogen energy is a flexible energy carrier, which helps to integrate renewable energy in various energy utilization sectors such as power, heating, transportation and industrial sectors. It is regarded as the clean energy with the greatest development potential in the 21st century and will play an important role in the future energy supply [6,7]. Hydrogen storage and transportation is one of the important parts of hydrogen energy utilization and it is also one of the difficulties restricting the large-scale application of hydrogen energy. At present, the existing hydrogen storage and transportation technologies are mainly divided into three categories, namely, high-pressure gas, liquid and solid material hydrogen storage and transportation technologies. High-pressure gaseous hydrogen storage and transportation can be divided into pipeline hydrogen transport and long-tube trailer transport.
The specific hydrogen storage and transportation mode needs to be determined according to the use scenario, transportation distance and specific local conditions [8]. Under the premise of the demand for large-scale use of hydrogen energy, pipeline transportation has the advantages of large transport capacity, safety and reliability, unified management and good stability, and is the preferred choice for long-distance, large-scale and low-cost hydrogen transportation and also an important way to achieve large-scale resource allocation and energy interconnection [9]. The use of wind and light energy to produce electrical energy, and further the unstable electrical energy through the electrolytic water to produce relatively stable and reliable hydrogen energy. Hydrogen is incorporated into natural gas pipelines in a certain proportion and the use of natural gas pipeline networks to transport hydrogen to end users is one of the effective ways to help achieve large-scale use of hydrogen energy at this stage [10]. There are two main ways of mixing hydrogen and natural gas. One is to directly inject hydrogen into the natural gas transmission pipeline without other equipment and use the diffusion and fluid movement between gas molecules to realize the mixing of hydrogen and natural gas in the pipeline. T-shaped pipe is the most common type of this mixing model. Some studies have shown that it is difficult to achieve a completely uniform mixture of hydrogen and natural gas in this blending method and it is possible to mix evenly only after about 4000 times the diameter of the pipeline and the uniformity of the mixture is difficult to exceed 95% [11-13].
Another blending method is to achieve uniform mixing of hydrogen and natural gas through a static mixer. Static mixers are widely used in mixing, heat transfer and separation because of their simple structure, high safety and low energy consumption. The internal baffle or labyrinth of the static mixer can make the fluid continuously diverge, collide, rotate and confluence, so as to continuously improve the fluid turbulence, which is a kind of element added in the pipeline to promote mixing [14]. Static mixers have been around for hundreds of years and there are many kinds of them. According to the principle of mixing unit, it can be divided into three categories, which are “cutting”, “rotating” and “stirring” and three types of static mixers can achieve good mixing effect [15]. Several factors need to be considered in the design and selection of static mixers, including mixing medium, flow loss, operating conditions, etc. Considering the small viscosity of gases, common static mixers for mixing between gases include SMV static mixers, KSM static mixers, LPD static mixers and SMX static mixers [16].
Karoui & Lowry [17,18] carried out a study on the influence of the geometric structure of the SMV static mixer on flow field parameters and established the relationship between the length of the mixing unit, bending angle and other geometric parameters on the pressure drop at the inlet and outlet of the pipeline [19], the average turbulent kinetic energy of the pipeline and the pressure ratio of turbulent kinetic energy. Jildert et al. [20] used numerical simulation methods to analyze the flow in the SMX static mixer, and obtained the flow velocity, pressure drop, residence time distribution and heat transfer characteristics inside the mixer.
Liu Y & Baumann [21,22] studied the influence of SMX static mixer on the mixing uniformity of natural gas and hydrogen and quantitatively evaluated the relationship between the number of mixing units, operating conditions and mixing performance. Hossein et al. [23] compared the resistance coefficient of a fourblade LPD static mixer with other static mixers to analyze the influence of the number of mixing components on the resistance coefficient under different spacing ratios. Based on KSM static mixer, Kong & Zhuang [24,25] carried out a numerical simulation study on the mixing process of hydrogen and natural gas, quantified the mixing uniformity and optimized the mixing uniformity and pressure loss. Hosseini et al. [23] committed to the structural optimization design of static mixers and the study of flow field characteristics, developed a multi-spiral mixing unit static mixer through innovative design and three-dimensional modeling, providing certain technical support for the development of new and efficient static mixers in oil fields.
As for the mixing of hydrogen and natural gas, many studies have carried out certain work on different types of static mixers, but there are relatively few studies on the influence of different types of static mixers on the mixing process of hydrogen and natural gas, and relevant research work needs to be carried out. Based on the experimental data of SMX static mixer, the numerical method is verified in this paper. On this basis, the influence of SMX static mixer, LPD static mixer and KSM static mixer on the mixing flow of hydrogen and natural gas is analyzed by numerical simulation method. The mixing capacity of three static mixers was evaluated, and the flow field structure and pressure loss inside the mixing unit were obtained, which can provide reference for the selection of natural gas and hydrogen mixing schemes in different application environments.
Investigation Model
The fluid will produce different torsion, cutting and confluence and other movements through the different structure of the static mixer, which will have different effects on the mixing process of the fluid. According to the mixing unit form of static mixer, it can be divided into rotary type and grid type. Rotary static mixers achieve mixing mainly through fluid rotation. The internal structure of the mixer makes the fluid produce left and right rotation, and the two streams of fluid with different directions are fully mixed downstream of each mixing unit. Grid type mainly through fluid cutting to achieve mixing. When the two streams of fluid are in the grid type mixing unit, the fluid will be continuously cut by the baffle to achieve full mixing inside the mixing unit. The static mixers SMX, LPD and KSM are commonly used, and the geometric models of these three static mixers need to be established.
When the three static mixer models were established, the dimensions of hydrogen inlet pipe, natural gas inlet pipe and mixer diameter were kept consistent, and only the structure of the mixing unit inside the static mixer was changed, as shown in Figure 1. Natural gas is the active gas source, and hydrogen is the follow-up gas source, which is blended by the static mixer and then discharged. The static mixer is composed of three parts, the inlet section, the mixing section and the outlet section, the length of the three parts are 800mm, 1600mm, 1600mm, respectively, marked with L1, L2, L3.
The inlet section is mainly composed of natural gas and hydrogen inlet pipes. The diameter of natural gas inlet pipes D1=310mm and hydrogen inlet pipes D2=98mm. In order to achieve better mixing effect, hydrogen is injected into natural gas by convection injection. 5 rows of injection holes are arranged, each row is evenly arranged with 16 holes along the circumference, and the aperture is set to 20mm.
Figure 1:Static mixer geometry model.

For the SMX static mixer, the mixing unit consists of a cross X-type baffle plate, the baffle plate and the flow axial Angle is ±45°, the two mixing units are staggered 90°, the aspect ratio L/D=1, the crossrod thickness t=2mm. For the LPD static mixer, the mixing unit is composed of cross-arranged oval plates, and the fluid mixing process is also a segmentation process, which splits the fluid into multiple strands to increase the degree of fluid dispersion and improve the mixing uniformity. For the KSM type static mixer, a spiral plate is rotated 180° and the fluid is divided into two strands at the initial end of a mixing unit. The two parts of the fluid turn left and right under the action of the helical flow channel formed by the separator and flow downstream, and meet at the end of the KSM blending unit.
Numerical Simulation Methods and Validation
Numerical simulation methods
Figure 2:Computational domain mesh of static mixer.

For calculating domain mesh, the commercial software ANSYS MESH is used to generate the mesh. Due to the complex structure of the baffle inside the static mixer, in order to improve the quality of grid generation, it is necessary to divide the calculation domain into multiple regions and divide the grids of different scales for each region. In this paper, the calculation domain is divided into three areas: the inlet section, the mixing section and the outlet section. The combination of structured grid and unstructured grid is adopted to improve the grid quality, as shown in Figure 2. The mixing zone is the key to the mixing effect of the mixer. The mesh encryption of the numerical calculation zone of the mixing zone can improve the accuracy of the numerical calculation. The height of the grid in the first layer of the boundary layer from the wall is less than 6×10⁻⁵m to satisfy the first cell y+ from the solid wall less than 2.
Boundary condition
The commercial software of computational fluid dynamics ANSYS FLUENT 19.0 was used to solve the three-dimensional flow in the computational domain. This solver is based on finite volume method and can be used to solve the Reynolds Average Navier- Stokes (RANS) equation with a pressure-based, coupled SIMPLE (Semi-Implicit Method for Pressure-Linked Equations) algorithm. Both natural gas and hydrogen are gas states. Based on the energy equation, the Species Transport model is selected to add different component mixtures through component transport. The velocity inlet boundary condition of the hydrogen and natural gas inlet pipes is set, the wall is set as adiabatic no slip, the mixed gas outlet is set as the pressure outlet boundary condition, and the convergence residual of the governing equation is set as less than 10-6. Since the gas is less dense, the effect of gravity is negligible. For turbulence model, Realizable k-ε turbulence model is adopted. Compared with the Standard and RNG turbulence model, Realizable k-ε model is suitable for flows with strong rotation, and the turbulence model is in good agreement with the test results [25]. The whole flow field is initialized with the gas inlet parameters at the gas inlet.
Test apparatus
The static mixer is integrated in the flow follow-up air mixing device, which can monitor and adjust the two components of gas in real time to achieve the purpose of accurate and uniform mixing. Flow following hydrogen mixing equipment test equipment, as shown in Figure 3. The mixture of hydrogen and natural gas is flammable and explosive, and nitrogen is an inert gas with similar flow characteristics to natural gas. The influence of molecular weight difference on the mixing uniformity between gases can be ignored. In order to test safety, nitrogen is used to replace natural gas and hydrogen. Hydrogen and nitrogen are stored in the gas storage tank respectively. During the test operation, the pressure in the hydrogen storage tank is not less than 0.6MPa, and the pressure in the nitrogen storage tank is not less than 2.0MPa. The natural gas pipeline and hydrogen pipeline are respectively installed with filters, pressure regulating valves and flowmeters, so that the natural gas pressure and hydrogen pressure can reach the required value. The hydrogen flow rate can be controlled by a regulating valve to meet the mixture volume ratio, and a check valve prevents the mixture from flowing back into the hydrogen line.
Figure 3:Test device of static mixer.

After hydrogen and nitrogen are mixed in the SMX static mixer, gas is extracted at the downstream outlet A-A cross section, as shown in Figure 4. The sampling tube extends from the A-A section to the B-B section. The sampling bag is connected at the B-B section to collect the sample gas. The distance from the A-A section to the B-B section is greater than 4 times the diameter of the pipe. In order to obtain more accurate uniformity at the cross section of the outlet pipe of the mixer, 16 measuring points were set up on the A-A cross section for gas sampling. The sampling tubes were arranged uniformly along the ring, 60mm and 110mm from the center of the pipe, respectively, and the diameter of the sampling tubes was 4mm. In order to distinguish the gas mixture collected at different locations, sampling bags and sampling tubes are numbered. Before gas collection, it is necessary to empty the gas in the sampling tube and sampling bag, and use the gas chromatograph to measure the hydrogen content in the collected mixture.
Figure 4:Mixed gas collection arrangement.

Numerical validation
Evaluation of numerical simulation method based on SMX static mixer test data. Through the grid independence verification, the static mixer can meet the grid independence requirements when the numbers of mesh in the calculation domain reaches 16 million. Nitrogen was used for the test results, and nitrogen was also used for numerical simulation. The inlet conditions of nitrogen and hydrogen pipelines are the same as the experimental conditions. The inlet pressure of nitrogen is 1.0MPa and the inlet speed is 9.4m/s. The inlet pressure of hydrogen is 1.5MPa and the volume ratio of hydrogen is 17.5%.
Figure 5 shows the cloud map of hydrogen volume fraction distribution at the exit of the fourth mixing unit in the second mixing unit domain of the static mixer and the distribution of sampling points. When sampling points are selected at the exit section of the static mixer, they are consistent with the sampling tubes in the experimental test, that is, the sampling position and sampling area are consistent. In the cloud map of hydrogen volume fraction of the exit section of the mixer, a circular sampling section with a diameter of 4mm was intercepted at the sampling point, and the hydrogen volume fraction of the circular sampling section was calculated by using the surface average method.
Figure 5:Distribution of sampling points and hydrogen volume fraction at static mixer outlet.

Figure 6 plots the distribution of hydrogen volume fraction in the outlet section of the SMX static mixer pipeline and the comparison of test results, where the volume proportion of natural gas and hydrogen is 17.5%. Two mixing units and four mixing units are taken as examples for analysis and evaluation. After two mixing units, the volume fraction of hydrogen at the sampling points is around 17.5%. The average value of the volume fraction of hydrogen at all measuring points is 17.9% and the test result is 18.5%. The deviation between the value and the test result is 3.35%. After 4 mixing units, the mixing uniformity is obviously improved, and the hydrogen volume fraction of the sampling points is basically the same, and the deviation between the value and the test results is less than 2.0%, which is basically the same with the test results.
Figure 6:Comparison of hydrogen volume fraction distribution and experimental results at static mixer outlet.

Result and Discussion
Mixing uniformity of different static mixers
The evaluation of the mixing performance of the static mixer is mainly reflected by two parameters, one is the flow loss of the gas after flowing through the static mixer, and the other is the mixing uniformity of the gas at the exit section of the static mixer. Mixing uniformity reflects the mixing effect. The static mixer with superior performance can achieve better mixing uniformity under the condition of small flow loss. Fluid flow loss can be quantitatively measured by pressure drop. For mixing uniformity, the commonly used quantitative evaluation parameter is coefficient of variation (COV) [21], which is defined as equation (1).
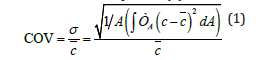
Where σ is the standard deviation of samples at all sampling points, c is the hydrogen volume fraction of each sampling point, c is the average hydrogen volume fraction at static mixers outlet, and A is the cross-sectional area of the pipeline. The COV value reflects the mixing effect, and the smaller the COV value is, the more uniform the mixing is.
In order to evaluate the mixing performance of SMX, LPD and KSM static mixers, hydrogen and natural gas were fed into different static mixers. The inlet pressure of natural gas was constant at 101325Pa, the inlet speed was constant at 10m/s, the inlet pressure of hydrogen was constant at 151325Pa, and the volume ratio of hydrogen was constant at 17.5%. The variation coefficients of hydrogen and natural gas through different static mixers were calculated, and the mixing uniformity was analyzed.
Figure 7 shows the distribution curve of variation coefficient of hydrogen and natural gas after each mixing unit of different static mixers. It can be known from the figure that the variation coefficient of the mixed gas passing through the three static mixers, SMX, LPD and KSM, shows a downward trend as a whole, and with the increase of the number of mixing units. It indicates that the mixing efficiency of a single downstream mixing unit is decreasing. In addition, for these three types of static mixers, it indicates that for mixing uniformity, SMX static mixer is the best, LPD static mixer is second, and KSM static mixer is the worst. After passing through four blending units, the coefficient of variation of the SMX static mixer was reduced from 10.1% to 0.91%, enabling efficient and uniform mixing of hydrogen and natural gas. The coefficient of variation of LPD static mixer was also greatly reduced from 35.9% to 3.68%. The coefficient of variation of KSM static mixer decreased from 62.7% to 6.93%, the mixing uniformity did not achieve the desired effect, and the number of mixing units should be further increased.
Figure 7:Comparison of mixing uniformity of different static mixers.

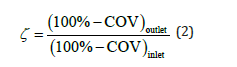
In order to further quantify the blending uniformity of the blending unit, the concentration mixing influence factor (ζ) was defined to quantitatively evaluate the blending unit uniformity. The concentration mixing influence factor is calculated from the coefficient of variation, and its definition is shown in (2). The larger the ζ, the better the blending effect of the blending unit.
Figure 8 describes the relationship between the concentration mixing influence factor and the number of mixing units of hydrogen and natural gas after three static mixers. The concentration mixing influence factor ζ reaches the maximum after the mixture gas passes through the first stage mixing unit. This indicates that the mixing capacity of the first stage blending unit is the strongest among the three static mixers. For the first-stage mixing unit, the concentration mixing factor of these three types of static mixers is ζ (SMX) > ζ (LPD) > ζ (KSM), indicating that the first-stage mixing unit of SMX static mixers has the strongest mixing capacity. At the outlet of the second-stage blending unit, the concentration mixing influence factor ξ decreases, which is mainly due to the high blending uniformity of the mixed gas after the first-stage blending unit. In the process of downstream flow, the mixing uniformity increases relatively slowly.
Figure 8:Mixing concentration factors of different types of mixers.

In the mixing process of the three static mixers, the SMX static mixer has the smallest concentration mixing influence factor, and it also has the smallest concentration mixing factor when passing through the third and fourth stage mixing units. This phenomenon does not indicate that the mixing uniformity of SMX static mixers is negative, mainly because SMX static mixers achieve a high mixing uniformity when passing through the first mixing unit, and its mixing uniformity increases relatively slowly when passing through the downstream mixing unit for further mixing. Flowing through the fourth mixing unit, the mixing capacity of the three static mixers is basically the same.
Internal flow field structure of different static mixers
Streamline distribution of natural gas and hydrogen in different types of static mixers is illustrated in Figure 9. Hydrogen enters the natural gas pipeline through the circumferential uniform injection hole of the premix section of the static mixer, and hydrogen enters the main gas pipeline mainly through the lower injection hole of the hydrogen pipeline. The pre-blending streamline distribution of the three static mixers in the inlet section is basically the same. In the mixing stage, the KSM static mixer spiral plate divides the mixed gas into two streams, and the two streams flow downstream along the spiral flow channel, which can only be mixed at the end of the mixing unit. As a result, the time and opportunity for air flow to contact with each other decreases when the air flow passes through the mixing stage, and the hydrogen flow line is not dispersed. When passing through the downstream mixing unit, its dispersion ability is very weak, and it does not disperse hydrogen and natural gas well, so the mixing efficiency is low. Compared with the KSM static mixer, the LPD static mixer has a great improvement. When the mixture of hydrogen and natural gas enters the mixing stage from the inlet section, the semi-elliptical plate of the first stage mixing unit blocks the flow of the mixture to the downstream, reduces the flow area, and promotes the mixture to be mixed at the baffle. In addition, the two elliptical plates are arranged at a certain Angle, so that the mixed gas will generate eddy currents when passing through the mixing unit, so the mixing efficiency is higher.
Figure 9:Streamline distribution of natural gas and hydrogen in different static mixers.

When natural gas and hydrogen pass through the downstream mixing unit in turn, they can fully contact and generate eddy currents to enhance turbulence and promote uniform gas mixing. Compared with the above two static mixers, SMX static mixer fully takes into account both the dispersion and rotation of the fluid. SMX mixing unit is formed by cross plates, which can play a positive role in cutting and dispersing the fluid. In the hydrogen and natural gas mixture flowing through the first stage mixing unit, the mixture gas is cut and dispersed by cross plates several times, increasing the convergence of hydrogen and natural gas. In addition, the mixing units are interlaced with each other at 90°, which causes the mixed gas to rotate at a certain Angle after flowing from the first stage to the second stage. Moreover, eddy current and radial flow are generated, which are mixed in the two dimensions of flow direction and radial direction, so the mixing effect is better.
The contours of hydrogen volume fraction distribution in different types of mixers were analyzed, as schematically in Figure 10. Plane1, Plane2, Plane3 and Plane4 are the pipe cross section positions from the first mixing unit to the end of the fourth mixing unit, respectively. The distribution of hydrogen in about 1/2 of the cross section of the KSM static mixer pipeline is relatively concentrated, forming two obvious areas of uneven concentration distribution, and the boundary line is basically consistent with the shape of the spiral plate of the mixing unit. This is mainly due to the fact that the spiral plate divides the fluid into two parts, mixing only in the end area of the mixer. Therefore, the two streams of fluid are relatively independent of each other, and the mixing effect is relatively poor. After four blending units, the coefficient of variation is only 6.8%, which does not meet the requirement of mixing uniformity.
Figure 10:Contours of hydrogen volume fraction distribution in different mixers.

The hydrogen concentration distribution in pipeline cross section of LPD static mixer is much better than that of KSM static mixer. This is mainly due to the fact that the semi-oval plate is similar to the opening of the valve, which reduces the flow area of the pipeline, prompting the mixture of hydrogen and natural gas to bypass the semi-oval plate to generate eddy currents and enhance mixing. Therefore, the hydrogen concentration distribution in the cross section of the LPD static mixer pipeline is similar to the vortex distribution with the vortex core in the center of the pipeline. After mixing with four mixing units, the coefficient of variation is 3.6%, and the mixing uniformity is greatly improved.
The distribution of hydrogen concentration in the cross section of the pipeline in the SMX static mixer is more uniform than that in the other two static mixers. Each mixing unit can greatly improve the uniformity of hydrogen concentration distribution. At the exit position of the first mixing unit, hydrogen is mainly distributed in the lower part, and the coefficient of variation of the whole cross section is reduced by about 10%. And its mixing uniformity is nearly 4 times that of the KSM mixing units. After the second mixing unit, the coefficient of variation is reduced to about 4%, which is equivalent to the mixing effect produced by 4 times the LPD mixing unit. After four mixing units, the coefficient of variation is directly reduced to less than 1%, which can be considered that hydrogen and natural gas have been basically mixed evenly. This can be attributed to the fact that multiple sets of cross plates in the SMX blending unit can play a positive role in cutting and dispersing. Hydrogen and natural gas are dispersed multiple times as they pass through each mixing unit, and the 90° rotation between the different mixers also enhances radial mixing.
Total pressure loss of different static mixers
Figure 11 illustrates the variation of pressure loss of hydrogen and natural gas mixture with the number of mixing units through three different types of static mixers. The pressure loss of the three static mixers increased with the increase of the number of mixing units, and basically showed a linear increase. The results show that in the same static mixer, the pressure drop caused by each mixing unit is basically the same. The SMX static mixer has a pressure loss of about 260Pa through each mixing unit and a total pressure drop of about 1000Pa of four mixing units. For the KSM static mixer, the pressure loss through each mixing unit is about 220Pa, and the pressure drop through 4 mixing units is about 960Pa. The pressure loss of the KSM and SMX static mixers is not much different, about 1% of the inlet pressure. However, LPD static mixer has great pressure loss. The pressure loss of gas through each LPD blending unit is more than 500Pa, and the pressure drop through four blending units is about 2300Pa, which is about twice the pressure loss of the other two static mixers.
Figure 11:Variation of pressure loss of different static mixers with mixing unit numbers.

According to the streamline distribution in the static mixer in Figure 9, the pressure loss of the KSM and SMX static mixers is almost the same, which may be because the mixed gas is less blocked by the mixing unit. KSM type mixing unit is streamlined, and the spiral plate only plays the role of dividing the fluid, and does not produce large flow resistance. Although the SMX static mixer has a baffle perpendicular to the flow direction, its baffle width is narrow and mainly plays the role of separating the fluid. After the mixed gas encounters the baffle, it can flow downstream from both sides of the baffle, so its resistance is relatively small. However, for the LPD blending unit, its upper and lower cross semielliptical baffle blocks almost all of its flow channels. When the gas mixture meets the elliptical baffle, it needs to flow around the baffle through the gap between the angles of the two baffles. Forcing the fluid to produce a vortex, the blockage degree is larger. Therefore, the flow loss of LPD static mixer is larger.
Conclusion and Perspective
In this paper, a comparative study on the performance of
different static mixers was carried out based on the flow disturbance
modes of different mixing units by numerical simulation. The
influence of static mixer structure on the performance of natural
gas and hydrogen mixing uniformity, internal flow field structure
and pressure loss was analyzed in detail.
A. The blending uniformity of SMX static mixer is the best,
followed by LPD static mixer and KSM static mixer. The mixing
capacity of an individual mixing unit can be quantified by the
concentration mixing factor, which is ζ (SMX) > ζ (LPD) > ζ
(KSM) for the three types of static mixers.
B. The KSM static mixer spiral plate divides the gas mixture into
two streams, which are mixed at the end of the mixing unit,
resulting in less contact between the streams. The two elliptic
plates of the LPD static mixer are arranged at a certain angle to
promote the mixing of the mixed gas at the baffle and generate
eddy current, which has a high mixing efficiency. The SMX
static mixer provides both dispersion and rotation of the fluid.
The cross plates can cut and disperse the fluid, and the mixing
units are staggered at 90°, which causes the airflow to rotate
at a certain angle, resulting in eddy and radial flow. Mixing is
carried out in two dimensions of flow direction and radius to
promote better mixing effect.
C. The pressure loss of the three static mixers increased with the
increase of the number of mixing units, and basically showed a
linear increase. The LPD static mixer has the greatest pressure
loss, about twice that of SMX static mixer and KSM static mixer.
In future, the authors are interested in experimental study and design optimization of different mixers. For example, the drilling design of the mixing unit separator. A jet is formed by drilling holes to improve mixing uniformity and reduce flow loss.
Acknowledgment
This work has been carried out with the supports of the Major Science and Technology Project of Inner Mongolia Autonomous Region of China (No.2023ZD0025) and the Foundation Key Laboratory of Automotive Safety and Energy of Tsinghua University of China (No. KFY2230). The authors would like to thank them for funding it and their permission to publish the paper, as well as Okay Energy Technology (Tianjin) Co., Ltd. for the experimental support. This work was also funded by China National Petroleum Sales Corporation and China National Petroleum Pipeline Engineering Co., LTD. We gratefully acknowledge the cash and in-kind support from all our research, government and industry participants.
Data Availability Statement
Some or all data, models, or code that support the findings of this study are available from the corresponding author upon reasonable request.
References
- Acar C, Dincer I (2020) The potential role of hydrogen as a sustainable transportation fuel to combat global warming. International Journal of Hydrogen Energy 45(5): 3396-3406.
- Midilli A, Ay M, Dincer I, Rosen MA (2005) On hydrogen and hydrogen energy strategies: I: Current status and needs. Renewable and sustainable energy reviews 9(3): 255-271.
- Gerboni R (2016) Introduction to hydrogen transportation. Compendium of Hydrogen Energy Woodhead Publishing, pp. 283-299.
- Witkowski A, Rusin A, Majkut M, Stolecka K (2018) Analysis of compression and transport of the methane/hydrogen mixture in existing natural gas pipelines. International Journal of Pressure Vessels and Piping 166: 24-34.
- Abe JO, Popoola API, Ajenifuja E, Popoola OM (2019) Hydrogen energy, economy and storage: Review and recommendation. International Journal of Hydrogen Energy 44(29): 15072-15086.
- International Energy Agency (2016) IEA. World Energy Outlook.
- Momirlan M, Veziroglu TN (2005) The properties of hydrogen as fuel tomorrow in sustainable energy system for a cleaner planet. Int J Hydrog Energy 30(7): 795-802.
- Qureshi F, Yusuf M, Khan MA, Hussameldin I, Bernard CE, et al. (2023) A State-of-the-art review on the latest trends in hydrogen production, storage, and transportation techniques. Fuel 340: 127574.
- Zou X, Qiu R, Yuan M, Meng Y, Liao Q, et al. (2021) Sustainable offshore oil and gas fields development: Techno-economic feasibility analysis of wind-hydrogen-natural gas nexus. Energy Reports 7: 4470-4482.
- Erdener BC, Sergi B, Guerra OJ, Aurelio LC, Kwabena P, et al. (2023) A review of technical and regulatory limits for hydrogen blending in natural gas pipelines. International Journal of Hydrogen Energy 48(14): 5595-5617.
- Wahl J, Kallo J (2020) Quantitative valuation of hydrogen blending in European gas grids and its impact on the combustion process of large-bore gas engines. International Journal of Hydrogen Energy 45(56): 32534-32546.
- Yue S, Jingfa L, Wangyi G, Zhao Y, Li J, et al. (2022) Prediction of mixing uniformity of hydrogen injection in natural gas pipeline based on a deep learning model. Energies 15(22): 8694.
- Melaina MW, Antonia O, Penev M (2013) Blending hydrogen into natural gas pipeline networks: A Review of key issues. Technical Report NREL/TP-5600-51995.
- Eames I, Austin M, Wojcik A (2022) Injection of gaseous hydrogen into a natural gas pipeline. International Journal of Hydrogen Energy 47(61): 25745-25754.
- Thakur RK, Vial C, Nigam KDP, Nauman EB, Djelveh G (2003) Static mixers in the process industries-A Review. Chemical Engineering Research and Design 81(7): 787-826.
- Quintino FM, Nascimento N, Fernandes EC (2021) Aspects of hydrogen and biomethane introduction in natural gas infrastructure and equipment. Hydrogen 2(3): 301-318.
- Karoui A, Hakenholz F, Le Sauze N, Costes J, Bertrand J (2019) Determination of the mixing performance of sulzer SMV static mixers by laser induced fluorescence. The Canadian Journal of Chemical Engineering 76(3): 522-526.
- Lowry E, Yuan Y, Krishnamoorthy G (2022) A new correlation for single-phase pressure loss through SMV static mixers at high Reynolds numbers. Chemical Engineering and Processing-Process Intensification 171: 108716.
- Habchi C, Ghanem A, Lemenand T, Della Valle D, Peerhossaini H (2019) Mixing performance in split-and-recombine milli-static mixers-A numerical analysis. Chemical Engineering Research and Design 142: 298-306.
- Jildert V, Rozendal PF, Hoogstraten HW, Beenackers AACM (2009) Three-dimensional numerical simulation of flow and heat transfer in the Sulzer SMX static mixer. J Chem Eng Sci 54(13-14): 2491-2500.
- Liu Y, Rao A, Ma F, Li X, Wang J, et al. (2023) Investigation on mixing characteristics of hydrogen and natural gas fuel based on SMX static mixer. Chemical Engineering Research and Design 197: 738-749.
- Baumann A, Jeelani SAK, Holenstein B, Stössel P, Windhab EJ (2012) Flow regimes and drop break-up in SMX and packed bed static mixers. Chemical Engineering Science 73: 354-365.
- Hosseini SM, Razzaghi K, Shahraki F (2019) Design and Characterization of a Low-pressure-drop Static Mixer. AIChE Journal 65(3): 1126-1133.
- Kong M, Feng S, Qi X, Chen C, Zhouxin P, et al. (2020) Investigation of mixing behavior of hydrogen blended to natural gas in gas network. Sustainability 13(8): 4255.
- Zhuang Z, Yan J, Sun C, Wang H, Wang Y, et al. (2020) The numerical simulation of a new double swirl static mixer for gas reactants mixing. Chinese Journal of Chemical Engineering 28(9): 2438-2446.
© 2025 Yongzhen Liu. This is an open access article distributed under the terms of the Creative Commons Attribution License , which permits unrestricted use, distribution, and build upon your work non-commercially.
Editor In Chief


.jpg)


Signup for Newsletter

Quick Links
 Editorial Board Registrations
 Submit your Article
 Refer a Friend
 Advertise With Us
Our Recent Edition

.jpg)


Top Editors


.jpg)


.bmp)
.jpg)
.png)
.jpg)


.jpg)


.png)

.png)


.png)


Financial Support

Sponsors

Latest e-Books

Latest Video

 a Creative Commons Attribution 4.0 International License. Based on a work at www.crimsonpublishers.com.
Best viewed in
a Creative Commons Attribution 4.0 International License. Based on a work at www.crimsonpublishers.com.
Best viewed in