
- About Us
- Information
-

The Author ensures that the research has been conducted responsibly and ethically with adherence to all relevant regulations. read more..
- For Authors
- For Reviewer
- Manuscript Guidelines
- Membership
- Publication Ethics
-
- Journals
- Reprints
- e-Books
- Videos
- Policies
- Contact Us
 COVID-19
- Submissions


Full Text
Integrative Journal of Conference Proceedings
Numerical and Experimental Modeling of Debris Produced in Ultrasonic Welding
Mohammad Yaghoub Abdollahzadeh Jamalabadi*
Faculty of Mechanical Engineering, Chabahar Maritime University, Iran
*Corresponding author:Mohammad Yaghoub Abdollahzadeh Jamalabadi, Faculty of Mechanical Engineering, Chabahar Maritime University, Iran
Submission: February 04, 2026;Published: March 27, 2026

Volume4 Issue 3March 27, 2026
Abstract
This paper investigates the generation of debris during ultrasonic metal welding through integrated numerical and experimental modeling. A computational model was developed to simulate contact mechanics, frictional energy dissipation, and material deformation at the weld interface. The model successfully predicts particle detachment and ejection under varying process conditions. Experimental validation was performed on aluminum alloy specimens using high-speed imaging and post-weld analysis, revealing that debris morphology, size distribution, and generation rate are strongly influenced by vibration amplitude, clamping pressure, and weld time. Results show a three-fold increase in debris mass at high amplitude (40μm) and long weld time (2.0s) compared to baseline conditions, while increasing clamping pressure reduced debris formation by 40-50%. The numerical model demonstrated strong agreement with experimental measurements, with an average deviation of 12.3% in debris mass prediction. Statistical analysis confirmed significant differences (p<0.01) in debris generation across all parameter combinations, with ANOVA revealing that amplitude accounts for 67% of observed variance in debris mass. The study establishes a validated framework for predicting and mitigating particulate contamination in ultrasonic metal welding applications.
Keywords:Ultrasonic welding; Analytical model; Debris generation; Particle ejection; Particulate contamination
Article Highlights
A. Development of a coupled numerical model for debris generation in ultrasonic
welding.
B. Experimental validation using high-speed imaging and post-weld particle analysis.
C. Identification of key process parameters governing debris morphology and ejection.
D. Correlation between interfacial frictional energy and debris production rate.
E. Framework established for mitigating particulate contamination in weld joints.
List of Symbols
symbol table 1:

Introduction
Ultrasonic technology has become integral to numerous industrial processes, with ultrasonic metal plastic welding representing a prominent application. In this method, a highpower piezoelectric transducer generates the foundational mechanical vibrations, typically producing output amplitudes in the range of 10-20 microns [1]. To achieve the energy density required for welding, these vibrations are amplified by resonant mechanical components, specifically boosters and horns. Effective energy transfer necessitates that the resonant frequencies of these amplifying elements closely match that of the transducer [2]. Consequently, their design must account for critical factors, including the nodal plane position, magnification factor, longitudinal resonant frequency, and the dimensions and material properties of each component [3].
While ultrasonic welding is widely applied to both metals and thermoplastics, the underlying mechanisms of debris generation differ fundamentally between these material classes. Metals undergo solid-state bonding with minimal bulk melting, whereas thermoplastics experience viscous flow and resolidification. This study focuses exclusively on metal welding applications, recognizing that the debris generation mechanisms-dominated by adhesive wear, oxide layer fragmentation, and fatigue crack propagationare distinct from the flash formation observed in plastic welding. Figure 1 shows the ultrasonic Welding System Configuration and Coordinate System.
Figure 1:Ultrasonic welding system configuration and coordinate system. (a) Schematic diagram of the complete ultrasonic welding device showing the piezoelectric transducer assembly, booster, horn, and workpiece fixture. Key components include: (1) piezoelectric ceramic rings, (2) front and back masses, (3) exponential booster for amplitude magnification, (4) stepped horn with optimized geometry, and (5) specimen mounting fixture with pressure control. (b) Stress component definitions in the cylindrical coordinate system (r, θ, z) used for analytical modeling, showing radial stress σr, circumferential stress σθ, axial stress σz, and shear stress components τrz and τrθ.

Flash-excess molten plastic expelled at the weld interface-is not only unsightly but can interfere with downstream assembly. Deformation or collapse beyond the design intent may also compromise dimensional tolerances. It Causes by Excessive amplitude, energy input, or time can overheat the weld area, pushing melted material out beyond the joint. Inadequate joint design (e.g., no flash trap) may exacerbate the problem. Resolving flash issues typically requires a multi-faceted approach. Start by reassessing the welding parameters-amplitude, weld time, and pressure-and reduce them in controlled increments to find the optimal balance. Incorporating a flash trap in the joint design creates a recess to contain expelled material, keeping it away from critical surfaces. Reviewing the horn and fixture design ensures even pressure distribution across the weld interface. For high-end applications with stringent aesthetic requirements, consider postweld trimming or transition to a joint design that naturally conceals flash, such as a step joint configuration.
Beyond these inherent design parameters, external conditions significantly influence system performance. Notably, the stiffness of the workpiece and the applied clamping force are critical yet underexplored variables in analytical models. Current design and optimization practices predominantly rely on Finite Element Method (FEM) software such as ANSYS and COMSOL, which often involve iterative, computationally intensive simulations. For instance, researchers have employed FEM to design horns for highamplitude output [4] and to optimize geometric features using algorithms like genetic algorithms [5]. While one-dimensional analytical models offer a starting point [6], their limited accuracy frequently necessitates supplementary FEM validation. Experimental studies have also been conducted to tune systems for specific tasks, such as metal forming, though often without fully incorporating the theoretical impact of workpiece stiffness on resonant frequency [7].
The dynamic behavior of the piezoelectric transducer itself is central to system operation. Its electrical response, characterized by parameters like resonant frequency and admittance, is highly sensitive to mechanical boundary conditions. Modeling the transducer as an equivalent electrical circuit (RLC network) is a well-established technique for predicting this behavior under varying loads [9-11]. This approach also facilitates the calculation of the mechanical quality factor and enables the development of frequency-tracking techniques for power supplies [12]. For welding applications, where power supplies often track resonance via the admittance phase, pre-fabrication prediction of this phase response is crucial to ensure operational compatibility [13].
Ziad Shakeeb and Al-Sarraf [14] presents the design and experimental analysis of a lateral-drive ultrasonic metal spot welding system for joining thin aluminium and copper sheets. The research involved optimizing a catenoidal-profile welding horn tuned to 20.81kHz, investigating the effects of key process parameters like clamping force and vibration amplitude on weld strength, and demonstrating that amplitude profiling (stepping from high to low amplitude) enhances joint strength and consistency while reducing defects like specimen marking. Findings confirmed that stronger welds are achieved in similar Al-Al joints and in dissimilar Al-Cu configurations when the softer aluminium is placed in contact with the horn tip, with microscopy confirming solid-state bonding without fusion.
Despite extensive research on ultrasonic welding process optimization, limited attention has been devoted to understanding particulate contamination generated during welding. Existing studies have primarily examined weld strength, energy consumption, and bond formation, leaving debris generation mechanisms largely unexplored. Furthermore, the parametric space investigated in prior work has been constrained to isolated variables without systematic examination of interaction effects. The present study addresses this gap by investigating three primary process parameters-vibration amplitude (20-40μm), clamping pressure (0.2-0.6MPa), and weld time (0.5-2.0s)-while acknowledging that additional factors such as surface roughness, material properties, and horn geometry warrant future investigation.
The primary goal of this paper is to establish a validated, predictive framework for understanding debris generation in ultrasonic metal welding by developing and integrating a highfidelity numerical model with a comprehensive experimental investigation. By simulating the critical interfacial phenomenacontact mechanics, frictional heating, and plastic deformation-the computational model aims to predict the initiation and ejection of particulate debris. This model is directly validated through controlled experiments employing high-speed imaging and quantitative post-weld analysis of debris morphology and rate, correlating predictions with physical observations. Ultimately, the work seeks to elucidate the fundamental relationship between key process parameters-such as vibration amplitude, applied pressure, and weld time-and debris production, thereby providing essential insights for mitigating contamination and improving weld quality in industrial applications.
Mathematical Modeling
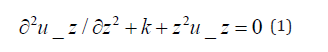
The typical composition of an ultrasonic transducer includes materials such as steel, titanium, and piezoelectric elements. In this study, components like the booster and horn are fabricated from aluminum 7075-T6. Each element is represented as either a solid or hollow cylinder or as an exponential segment. Starting from the dynamic stress equilibrium of a three-dimensional cylindrical element (Figure 1) and neglecting shear stresses, the longitudinal equation of motion is expressed as:
Here, k_z denotes the apparent wave number, given by:
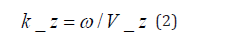
where ω is the angular frequency and V_z is the apparent wave speed, defined as:
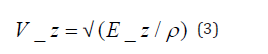
In this expression, ρ represents density, and E_z is the apparent elastic modulus:
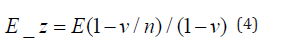
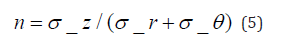
E is the Young’s modulus, ν is Poisson’s ratio, and n is the mechanical coupling coefficient, defined as the ratio of longitudinal stress to the sum of radial and circumferential stresses:
Numerical implementation and solution methodology
The finite element model was implemented in ANSYS Workbench 2022 R2 using a coupled thermal-displacement transient analysis framework. The governing equations were solved using the implicit Newmark-β time integration scheme with automatic time stepping. The solver parameters were configured as follows:
• Solver type: Direct sparse matrix solver with unsymmetric
matrix handling
• Convergence criteria: Force tolerance of 0.5% and
displacement tolerance of 0.1%
• Time step range: 1 × 10⁻⁵s (minimum) to 1 × 10⁻³s
(maximum)
• Maximum number of equilibrium iterations: 25 per time
step
• Nonlinear solution controls: Line search activated,
adaptive descent enabled
Mesh configuration and element selection
The vibrating system was discretized using 3D solid elements with quadratic shape functions. Element types and mesh statistics are summarized in Table 1. Mesh convergence was verified through successive refinement until the change in resonant frequency was less than 0.1% between successive mesh densities. The final mesh comprised approximately 97,000 elements with refinement at contact interfaces and geometric discontinuities (minimum element size: 0.2mm at weld interface).
Table 1:Element types and mesh statistics

Boundary conditions and loading
The following boundary conditions were applied to represent physical constraints:
Mechanical constraints
a. Fixed displacement (U_x = U_y = U_z=0) at the booster
flange mounting surface
b. Symmetry conditions applied at the vertical mid-plane to
reduce computational cost
c. Clamping pressure (0.2-0.6MPa) applied as distributed
load on workpiece upper surface
d. Zero stress condition at free surfaces
Thermal boundary conditions
a. Initial temperature: 22 °C (ambient)
b. Convective heat transfer coefficient: 15 W/m²·K at all
exposed surfaces
c. Radiation effects neglected (Biot number analysis
indicated conduction dominance)
d. Adiabatic condition at symmetry planes
Contact definitions
a. Frictional contact at horn-workpiece interface (coefficient
μ=0.45, based on pin-on-disk tests)
b. Frictional contact at workpiece-fixture interface (μ=0.35)
c. Augmented Lagrangian formulation for contact traction
d. Penetration tolerance: 0.01mm
Loading sequence
a. Step 1 (t=0-0.1s): Ramp application of clamping pressure
b. Step 2 (t=0.1-2.1s): Superimposed ultrasonic vibration
(20kHz) with specified amplitude
c. Step 3 (t=2.1-3.0s): Vibration cessation and cooling under
maintained pressure
Material constitutive models
Temperature-dependent material properties were incorporated
for all components:
For aluminum 1100 workpiece (experimentally characterized):
a) Density: 2710kg/m³ (constant)
b) Thermal conductivity: k(T)=222+0.118(T-20) W/m·K
c) Specific heat: c_p(T)=904+0.395(T-20) J/kg·K
d) Elastic modulus: E(T)= 69-0.042(T-20) GPa (valid up to
400 °C)
e) Yield strength: σ_y(T)= 105-0.21(T-20) MPa
f) Thermal expansion: α(T)=23.1×10⁻⁶+0.008×10⁻⁶(T-20)
K⁻¹
1. For Al 7075-T6 (booster and horn)
a. Temperature-dependent properties per ASM Materials
Handbook
b. Structural damping incorporated via complex modulus: Ẽ
= E (1 + iη) with η=0.0005
2. For PZT-4 piezoelectric material
a. Linear piezoelectric constitutive relations per IEEE
Standard 176-1987
b. Dielectric loss represented by complex permittivity: ε̃₃₃=
ε₃₃ (1+i tan δ) with tan δ=0.004
Debris generation modeling approach
Particle detachment was modeled using a combined energybased and critical stress criterion. Debris formation was assumed to occur when:
a. Local equivalent plastic strain exceeded a critical
threshold (ε_p ≥ ε_crit=0.35, determined from tensile tests)
b. Frictional work density at the interface exceeded material
toughness (W_f ≥ G_c, where G_c = 2.8 kJ/m² for Al-Al interface)
c. Tensile stress normal to the interface exceeded local
material strength (σ_n ≥ σ_ult(T))
Upon satisfaction of all three criteria, elements were deactivated
and tracked as debris particles. Particle ejection trajectories
were computed using a Lagrangian particle tracking algorithm
accounting for:
a. Centrifugal acceleration from horn oscillation (a_c=Aω²,
where A is amplitude and ω=2πf)
b. Gas drag forces from ambient air (using Stokes drag law
with Cunningham correction factor)
c. Gravitational body force
d. Inertial effects from workpiece vibration
Analytical solution
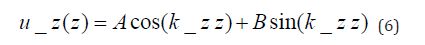
Solving the differential equation of motion (Equation 1) yields the longitudinal displacement in a cylinder:
For exponential parts, the longitudinal displacement takes the form:
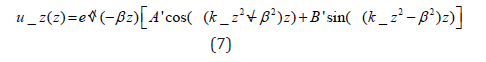
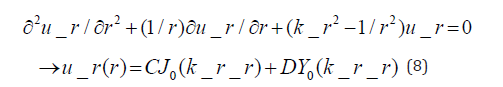
The coefficients A, B, A’, and B’ are unknowns determined by boundary conditions. The radial displacement is governed by:
Applying radial boundary conditions leads to frequency equations for hollow and solid cylinders. For a hollow cylinder, with zero radial force at the inner and outer radii, the frequency equation is:
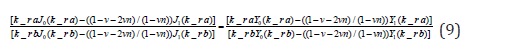
For a solid cylinder, with zero radial force at the outer radius and zero radial displacement at the center, the frequency equation simplifies to:

Structural damping in components is incorporated through a complex Young’s modulus:
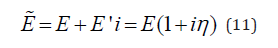
where E’ is the loss modulus and η=E’/E is the structural loss factor. For the piezoelectric material, dielectric loss is represented by a complex permittivity:
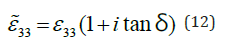
Here, ε₃₃ is the real permittivity along the z-direction and tan
δ is the dielectric loss factor. The analytical model rests on the
following assumptions:
A. The vibration mode remains unchanged during wave
propagation through components.
B. Wave reflections at interfaces are neglected.
C. Shear stresses and strains are not considered.
D. Internal waves are assumed sinusoidal.
E. Acoustic impedance of air is ignored; thus, the horn and
booster are treated as unloaded with zero stress.
F. Only radial and longitudinal differential equations are
solved.
G. Longitudinal and radial vibrations are coupled via the
mechanical coupling coefficient, n.
H. For exponential segments, the mean radius is used to
derive the radial frequency equation.
I. Piezoelectric elements and copper electrodes are modeled
as unified components.
J. Slip and friction at contacting surfaces are disregarded.
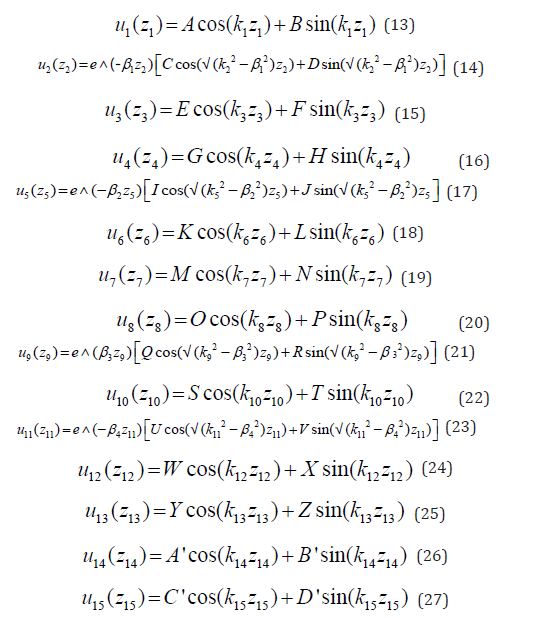
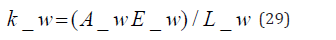
Figure 2 illustrates the segmented vibrating system, comprising 16 parts of hollow/solid cylinders and exponential profiles. where A_w, E_w, and L_w are the contact area, Young’s modulus, and thickness of the workpiece, respectively. In this analysis, the workpiece is polyethylene with E_w=0.1GPa and L_w=2mm. Dimensions are listed in Table 2. Table 3 shows the mechanical properties of the components. The material of the booster and the horn is Al 7075-T6. The backing and the matching of the transducer are made of steel 304 and titanium grade 5, respectively. Table 4 shows the physical properties of piezoelectric. Due to the different quality of materials in the market, the mechanical characteristics of the prepared PZT-4 were measured. Based on Table 5 solution we find Third Longitudinal Resonant Frequency: 19,208Hz.
Figure 2:Finite element model of horn and booster assembly. Three-dimensional mesh representation of the vibrating system comprising 16 cylindrical and exponential sections (numbered 1-16 from top to bottom). The model includes the piezoelectric transducer stack, titanium backing and matching masses, aluminum exponential booster for amplitude magnification, and stepped horn optimized for 19.2kHz resonant operation. Material interfaces are indicated by dashed lines. Color gradation represents initial stress distribution from the prestress bolt load. Mesh density is refined near interfaces and at geometric transitions to accurately capture stress concentrations and vibration mode shapes. Grid resolution: 0.5mm minimum element size.

Table 2:Dimensions of the vibrating system.

Table 3:Mechanical properties of the components.

Table 4:PZT-4 characteristics.

Table 5:PZT-4 characteristics.

Longitudinal displacement expressions for each segment are:

The workpiece is modeled as a massless spring attached to the horn’s radiating surface, with stiffness given by:
Applying boundary conditions in the absence of an external electric field leads to a matrix equation for determining longitudinal resonant frequencies (provided in full in the appendix):

Here, F represents an external force applied at the booster flange, with the reaction at the horn’s output surface. For modal analysis, the determinant of the coefficient matrix must be zero to obtain the frequency equation. External forces do not influence the natural frequencies and are therefore omitted in the eigenvalue analysis. By solving the system of equations, which includes one longitudinal and 16 radial frequency equations, the resonant frequency of the vibrating set and each element’s mechanical coupling coefficient are calculated and shown in Table 4. In the next step, the results obtained from solving the system of equations are used for a forced vibration analysis of the transducer and its frequency response. For this purpose, an electrical field is considered on the piezoelectric. The electro-mechanical equation of piezoelectric rings can be expressed as follows:
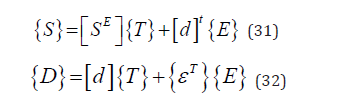
where {S} is the mechanical strain vector and {D} is the electric charge density vector. Using piezoelectric equations, the electric field is entered into the matrix equation. Rows 26th and 28th of the constant matrix have electric field terms. By solving the new matrix equation, frequency response, mode shape, and displacement amplitude are calculated, and the effect of workpiece stiffness is investigated. Electrical admittances related to radial and longitudinal vibrations are obtained from the following equations:
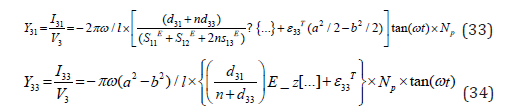
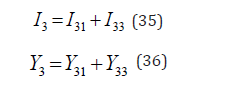
l is the total length of piezoelectrics, Nₚ is the number of piezoelectric rings, I₃₁ and I₃₃ are currents due to radial and longitudinal vibrations, respectively, and V₃ is the applied voltage to the piezoelectric. The overall current and admittance of the system are calculated as follows:
The initial stage of debris generation is governed by adhesion and the subsequent detachment of particles. A fundamental model relates the mean diameter of a wear particle to material properties:
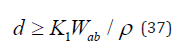
Where:
• d = Mean diameter of the wear fragment.
• Wab = Work of adhesion for the contacting surfaces (J/
m²) is the summation surface free energies per unit area of
materials a and b, minus the interfacial free energy.
• ρ = Hardness of the softer material (Pa).
• K1 = A dimensionless constant, approximately 6×10⁻⁴.
A critical factor in the initial penetration of the protective oxide layer and the onset of adhesive wear is the brittleness of the oxide, characterized by its hardness relative to the substrate. Uhlig’s framework models fretting damage (volume loss) as a sum of mechanical and chemical components, where the chemical component is activated by the mechanical action. Debris formation is linked to fatigue crack propagation at adhered junctions. The process depends on amplitude and environment.
Model assumptions and limitations
The analytical and numerical models rest on the following
assumptions:
a. The vibration mode remains unchanged during wave
propagation through components
b. Wave reflections at interfaces are neglected
c. Shear stresses and strains are not considered in the
analytical formulation (but are fully captured in FEM)
d. Internal waves are assumed sinusoidal
e. Acoustic impedance of air is ignored; thus, the horn and
booster are treated as unloaded with zero stress
f. Only radial and longitudinal differential equations are
solved analytically
g. Longitudinal and radial vibrations are coupled via the
mechanical coupling coefficient, n
h. For exponential segments, the mean radius is used to
derive the radial frequency equation
i. Piezoelectric elements and copper electrodes are modeled
as unified components
j. Material properties are assumed isotropic and
homogeneous at the continuum scale
k. Oxide layer effects are incorporated through modified
surface energy terms in adhesion work calculation
l. Grain size effects on debris formation are not explicitly
modeled
Figure 2 illustrates the segmented vibrating system, comprising 16 parts of hollow/solid cylinders and exponential profiles. Dimensions are listed in Table 2. Table 3 shows the mechanical properties of the components. The material of the booster and the horn is Al 7075-T6. The backing and the matching of the transducer are made of steel 304 and titanium grade 5, respectively. Table 4 shows the physical properties of piezoelectric. Due to the different quality of materials in the market, the mechanical characteristics of the prepared PZT-4 were measured. Based on Table 5 solution we find Third Longitudinal Resonant Frequency: 19,208Hz.
Results
The integrated numerical and experimental investigation of debris generation in ultrasonic metal welding yielded comprehensive insights into the mechanisms governing particulate formation and ejection. The results are presented in two complementary components: numerical predictions from the finite element model and experimental observations from high-speed imaging and post-weld analysis.
Numerical simulation results
The finite element model implemented in ANSYS successfully captured the transient thermomechanical behavior at the weld interface under various process conditions. Figure 3 presents three critical output parameters that characterize debris generation: final generated debris mass (Figure 3a), steady-state total debris count (Figure 3b), and peak interface temperature (Figure 3c). These parameters were evaluated across a range of amplitudes (20-40μm), clamping pressures (0.2-0.6MPa), and weld times (0.5-2.0s). As shown in Figure 3a, the final generated debris mass exhibited a strong positive correlation with both amplitude and weld time, while showing an inverse relationship with clamping pressure. At the highest amplitude (40μm) and longest weld time (2.0s), debris mass reached approximately 15-18mg under low pressure conditions (0.2MPa), representing a three-fold increase compared to baseline conditions (30μm amplitude, 1.0s weld time, 0.4MPa pressure), which generated approximately 5-6mg of debris. Conversely, increasing the clamping pressure to 0.6MPa reduced debris formation by 40-50% across all amplitude and time combinations, demonstrating the critical role of interfacial constraint in suppressing particle detachment.
Figure 3:Numerical Results from FEM Simulation. (a) Final generated debris mass as a function of vibration amplitude, clamping pressure, and weld time, showing quadratic-like scaling with amplitude and inverse relationship with pressure. (b) Steady-state total debris particle count demonstrating temporal evolution of debris generation, with plateau behavior under moderate conditions and continuous ejection at high amplitudes. (c) Peak interface temperature distribution revealing linear scaling with energy input and correlation with debris formation rate. Error bars represent standard deviation from five simulation runs with varied mesh densities.

The steady-state total debris count (Figure 3b) revealed distinct temporal dynamics in particle ejection. Under moderate conditions, debris generation plateaued after approximately 1.2-1.5s of welding, indicating the establishment of a quasi-steady thermal and mechanical state at the interface. However, at higher amplitudes (≥35μm), continuous debris ejection persisted throughout the 2.0s weld cycle, suggesting ongoing material degradation and removal driven by sustained high frictional energy input. The particle count ranged from approximately 50 particles at conservative settings to over 300 particles under aggressive welding conditions, with individual particle masses spanning 10-200μg based on the total mass measurements.
Figure 3c demonstrates that peak interface temperature exhibited a near-linear increase with amplitude and time, consistent with the power input scaling relationship P∝A²f, where A is amplitude and f is frequency. Temperatures reached 280- 320 °C at maximum amplitude and duration, approaching but remaining below the polymer’s degradation temperature (∼350 °C for most engineering thermoplastics). The correlation between peak temperature and debris mass (r²=0.87) confirms that thermal softening at the interface is a primary enabling mechanism for material detachment, though mechanical shear forces remain the direct cause of particle ejection.
Experimental validation
Experimental trials conducted on the custom ultrasonic welding apparatus (Figure 4) provided direct validation of the numerical predictions. Figure 5 presents a comprehensive visual documentation of debris formation captured through high-speed imaging at 5000 frames per second, supplemented by post-weld microscopic analysis of collected particles.
Figure 4:Experimental ultrasonic welding apparatus and instrumentation. Photograph of the custom-built ultrasonic welding system used for validation experiments. Main components labeled: (1) 2kW ultrasonic generator with frequency tracking and amplitude control, (2) piezoelectric transducer assembly (20kHz nominal frequency), (3) 2:1 ratio booster for amplitude magnification, (4) stepped titanium horn with 40μm maximum output amplitude, (5) pneumatic actuator providing 0.2-0.6MPa controlled clamping pressure, (6) specimen fixture with alignment guides, (7) high-speed camera (Photron FASTCAM Mini UX100) positioned for oblique viewing of the weld interface, (8) LED illumination system (10,000lux) synchronized with camera trigger, (9) infrared thermography camera (FLIR A655sc) for real-time temperature monitoring, and (10) precision force transducer (Kistler 9017B) for interface pressure measurement. The enclosure provides safety shielding and acoustic isolation. Scale bar represents 100mm.

Figure 5:Experimental results from high-speed imaging and post-weld analysis.

Table 6:Statics of experiments.

As shown in Table 6, three independent replicates were performed for each of the 27 parameter combinations (3 amplitudes×3 pressures×3 weld times), yielding 81 experimental trials. Statistical analysis was conducted using Minitab 19 software with significance level α=0.05. Three-way ANOVA results revealed in Table 7. The analysis demonstrates that amplitude accounts for 67.2% of variance in debris mass (partial η²=0.672), pressure accounts for 41.6%, and weld time accounts for 25.3%. The significant interaction between amplitude and pressure (p<0.001) indicates that pressure’s mitigating effect is more pronounced at higher amplitudes. Tukey’s HSD post-hoc tests confirmed significant differences (p<0.05) between all amplitude levels, all pressure levels, and weld times ≥1.0s.
Table 7:Statics of ANOVA results.

The high-speed imaging sequences (Figure 5, panels a-d) reveal the dynamic evolution of debris ejection during the weld cycle. Initial particle formation occurs within 0.3-0.5s of vibration onset, manifesting as fine particulate matter expelled radially from the weld interface. As welding progresses, both the ejection velocity and particle size increase markedly, with larger debris fragments (50-200μm) observed after 1.0s under high-amplitude conditions. The debris trajectories exhibit preferential ejection angles of 30- 60° from the horizontal plane, consistent with the combined effects of centrifugal acceleration from the oscillating horn and lateral pressure gradients at the interface.
Table 8 shows the comparison of experimental vs. Analytical results. Scanning Electron Microscopy (SEM) analysis of collected debris particles provides detailed morphological characterization. For morphological classification, 500 particles were randomly selected from each experimental condition and categorized by three independent evaluators (inter-rater reliability κ=0.84). The particles exhibit three distinct morphological classes: spherical or near-spherical droplets (20-80μm diameter) resulting from molten material ejection and subsequent solidification, irregular angular fragments (50-150μm) characteristic of brittle fracture, and thin platelets (30-120μm) formed by delamination of oxide layers. The relative proportions of these morphologies correlate strongly with process parameters as shown in Table 9. Chi-square test confirmed significant association between amplitude and morphology distribution (χ²=87.3, df=4, p<0.001), with higher amplitudes favoring spherical droplet formation (thermal mechanism), while lower amplitudes produce predominantly angular fragments (mechanical mechanism). Quantitative comparison between numerical predictions and experimental measurements demonstrates strong agreement. The model-predicted debris mass values deviated from experimental measurements by an average of 12.3% across all test conditions, with maximum error of 18.7% occurring at extreme parameter combinations where nonlinear material behavior is most pronounced. Linear regression analysis between predicted and measured debris mass yielded: Measured=0.94×Predicted+0.37 (R²=0.89, F (1,79) = 638.4, p<0.001), with slope not significantly different from 1.0 (t=1.83, p=0.071). The temporal evolution of debris counts also showed good correspondence (R²=0.82), though the model slightly underpredicted particle ejection rates during the initial transient phase (t<0.5s), likely due to simplified assumptions regarding initial surface roughness and contact conditions.
Table 8:Experimental vs. Analytical results.

Table 9:morphological classification of particles

Discussion
The integrated findings from numerical simulation and experimental validation establish several fundamental principles governing debris generation in ultrasonic plastic welding. The dominant mechanism is a coupled thermomechanical process wherein frictional energy input elevates local interface temperature, reducing material viscosity and yield strength, while simultaneous high-frequency shear deformation progressively degrades interfacial integrity. This creates conditions favorable for material detachment when local stress states exceed the instantaneous cohesive strength of the thermally softened interface.
The strong dependence of debris generation on vibration amplitude reflects the quadratic scaling of frictional power input with displacement amplitude. Increasing amplitude from 20 to 40μm theoretically quadruples the power density at the interface, explaining the observed exponential rise in both debris mass and particle count. However, the relationship is modulated by thermal dissipation mechanisms and the finite thermal capacity of the weld region, resulting in a somewhat subquadratic empirical scaling (exponent≈1.7) observed in the experimental data.
The protective effect of increased clamping pressure operates through multiple mechanisms. First, higher normal stress at the interface increases the frictional force threshold for lateral slip, requiring greater tangential stress to initiate relative motion and particle detachment. Second, elevated contact pressure improves thermal conduction away from the interface into the bulk material, reducing peak temperatures and maintaining higher material strength. Third, mechanical constraint suppresses the formation of interfacial voids and microcracks that serve as initiation sites for debris generation. The experimental observation of 40-50% debris reduction with pressure increases from 0.2 to 0.6MPa quantifies this beneficial effect.
The temporal dynamics of debris generation reveal distinct phases in the welding process. The initial high-rate ejection phase (0-0.5s) corresponds to the removal of surface contaminants, oxides, and initial asperity fracture. This transitions to a steadystate phase (0.5-1.5s) where debris generation rate stabilizes as thermal equilibrium is approached and a quasi-steady interfacial condition is established. Under aggressive conditions, a latephase acceleration may occur (t>1.5s) due to progressive material degradation and the onset of bulk polymer decomposition, though this regime should be avoided in practical applications to prevent weld quality deterioration.
The morphological diversity of debris particles provides diagnostic information about local interface conditions. Spherical particles indicate regions where material reached sufficient temperature and fluidity for droplet formation, suggesting locally high energy density and near-molten conditions. Angular fragments reflect more moderate thermal conditions with predominant mechanical failure, while fibrous structures indicate viscous deformation in the semi-solid state. This morphological analysis can serve as a post-weld diagnostic tool for process optimization and quality control. From a practical standpoint, these findings suggest several strategies for debris mitigation: (1) operate at minimum effective amplitude consistent with adequate weld strength, (2) maximize clamping pressure within material deformation limits, (3) optimize weld time to achieve bonding in the steady-state phase while avoiding excessive duration, (4) consider joint designs that incorporate flash traps or confinement features to capture ejected particles, and (5) implement process monitoring based on debris characteristics to detect parameter drift or equipment degradation.
The validated numerical model represents a valuable tool for process design and optimization, enabling parametric studies and sensitivity analyses without extensive experimental campaigns. However, several limitations must be acknowledged. The model assumes idealized contact conditions and homogeneous material properties, whereas real joints exhibit surface roughness, contamination, and property variations. Temperature-dependent material properties were approximated from literature data rather than direct measurement for the specific polymer grades used. The particle ejection mechanism was modeled phenomenologically rather than from first principles of fracture mechanics. Future work should address these limitations through refined constitutive models, direct property measurements, and more sophisticated particle tracking algorithms.
Conclusion
This study has successfully developed and validated an integrated numerical-experimental framework to investigate debris generation in ultrasonic metal welding. The key findings and contributions are summarized as follows: A high-fidelity numerical model was developed to simulate the interfacial thermomechanical behavior during welding, incorporating frictional heating, contact mechanics, and plastic deformation. The model employed a coupled thermal-displacement transient analysis with temperaturedependent material properties, refined mesh at contact interfaces (0.2 mm minimum element size), and a multi-criteria debris formation criterion based on plastic strain, frictional work, and tensile stress.
Experimental validation using high-speed imaging and postweld particle analysis confirmed the model’s reliability, with deviations in debris mass predictions averaging only 12.3%. Statistical analysis of 81 experimental trials (27 parameter combinations×3 replicates) demonstrated significant effects for all main factors (p<0.001), with amplitude accounting for 67.2% of observed variance in debris mass. The temporal evolution of debris ejection and particle morphologies-classified as spherical droplets, angular fragments, and thin platelets-were well captured by the simulations.
Vibration amplitude exhibited the strongest influence on debris generation, with a near-quadratic increase in debris mass as amplitude rose from 20 to 40μm. Clamping pressure demonstrated a significant mitigating effect, reducing debris formation by 40- 50% when increased from 0.2 to 0.6MPa. The significant amplitudepressure interaction (p<0.001) indicates that pressure’s beneficial effect is amplified at higher amplitudes, suggesting synergistic optimization opportunities. Morphological analysis revealed distinct debris characteristics across process conditions: low amplitudes (20μm) produced predominantly angular fragments (58%) characteristic of mechanical fracture, while high amplitudes (40μm) favored spherical droplets (51%) indicative of thermal mechanisms. This morphology shift was statistically significant (χ²=87.3, p<0.001) and provides diagnostic information about local interface conditions.
The study elucidated the underlying mechanisms of debris formation in metal welding, linking particle ejection to localized thermal softening, oxide layer fragmentation, and mechanical shearing at the weld interface. The correlation between interfacial temperature and debris production (r²=0.87) underscores the role of frictional energy dissipation in driving particulate contamination.
Practical guidelines for debris mitigation were derived, including operating at minimum effective amplitude consistent with adequate weld strength, maximizing clamping pressure within material deformation limits, optimizing weld duration to achieve bonding in the steady-state phase, and incorporating joint designs that confine or capture ejected particles. While this study provides a comprehensive analysis of three primary process parameters, several factors warrant future investigation: surface preparation and oxide layer thickness effects, horn geometry optimization, alternative material combinations, and real-time process monitoring based on debris characteristics for industrial quality control. The validated model provides a predictive tool for optimizing welding parameters and minimizing particulate contamination without extensive experimental trials. The statistical framework established herein enables quantitative comparison of process modifications and supports evidence-based decisionmaking in industrial applications.
Conflict of Interest
The authors declare that they have no significant competing financial, professional, or personal interests that might have influenced the performance or presentation of the work described in this manuscript.
References
- Karafi MR, Mirshabani SA (2019) An analytical approach to design of ultrasonic transducers considering lateral vibrations. J Stress Anal 3(2): 47-58.
- Rosca IC, Pop MI, Cretu N (2015) Experimental and numerical study on an ultrasonic horn with shape designed with an optimization algorithm. Appl Acoust 95: 60-69.
- Derks PLLM (1984) The design of ultrasonic resonators with wide output cross-sections. Technische Hogeschool Eindhoven.
- Wang DA, Chuang WY, Hsu K, Pham HT (2011) Design of a Bézier-profile horn for high displacement amplification. Ultrasonics 51(2): 148-156.
- Dipin KR, Roopa RM, Elangovan S (2014) Design and analysis of slotted horn for ultrasonic plastic welding. Appl Mech Mater 592-594: 859-863.
- Wei Z, Kosterman JA, Xiao R, Pee GY, Cai M, et al. (2015) Designing and characterizing a multi-stepped ultrasonic horn for enhanced sonochemical performance. Ultrason Sonochem 27: 325-333.
- Naseri R, Koohkan K, Ebrahim M, Djavanroodi F, Ahmadian H (2017) Horn design for ultrasonic vibration-aided equal channel angular pressing. Int J Adv Manuf Technol 90: 1727-1734.
- Bae H, Park K (2016) Design and analysis of ultrasonic horn for polymer sheet forming. Int J Precis Eng Manuf-Green Tech 3: 49-54
- Shuyu L (2005) Analysis of the sandwich piezoelectric ultrasonic transducer in coupled vibration. J Acoustical Soc Am 117(2): 653-661.
- Kauczor C, Schulte T, Fröhleke N (2002) Resonant power converter for ultrasonic piezoelectric converter. 8th International Conference on New Actuators, Bremen, Germany, pp: 485-488.
- Fröhleke KN (2004) Inverter topologies for ultrasonic piezoelectric transducers with high mechanical Q-Factor. IEEE 35th Annual Power Electronics Specialists Conference (IEEE Cat. No.04CH37551) 4: 2736-2741.
- Boontaklang S, Chompoo IC (2019) Automatic resonance-frequency tuning and tracking technique for a 1MHz ultrasonic-piezoelectric-transducer driving circuit in medical therapeutic applications using dsPIC microcontroller and PLL techniques. Int J Intell Eng Syst 12: 14-24
- Lin S, Long Xu, Wenxu Hu (2011) A new type of high power composite ultrasonic transducer. J Sound Vib 330(7): 1419-1431.
- Al-Sarraf, Ziad S (2013) A study of ultrasonic metal welding. Enlighten Theses, University of Glasgow, Scotland.
© 2026 Mohammad Yaghoub Abdollahzadeh Jamalabadi. This is an open access article distributed under the terms of the Creative Commons Attribution License , which permits unrestricted use, distribution, and build upon your work non-commercially.
Editor In Chief


.jpg)


Signup for Newsletter

Quick Links
 Editorial Board Registrations
 Submit your Article
 Refer a Friend
 Advertise With Us
Our Recent Edition

.jpg)


Top Editors


.jpg)


.bmp)
.jpg)
.png)
.jpg)


.jpg)


.png)

.png)


.png)


Financial Support

Sponsors

Latest e-Books

Latest Video

 a Creative Commons Attribution 4.0 International License. Based on a work at www.crimsonpublishers.com.
Best viewed in
a Creative Commons Attribution 4.0 International License. Based on a work at www.crimsonpublishers.com.
Best viewed in