- Submissions
Full Text
Examines in Marine Biology and Oceanography: Open Access
Experimental Study on the Settling Velocity of Coastal Mud in Quiescent Water: The Case of Huangmaohai Estuary, South China Sea
Dong XU*, Yuchuan BAI and Chunning JI
Tianjin University, China
*Corresponding author: Dong XU, State Key Laboratory of Hydraulic Engineering Simulation and Safety, Tianjin University, 92 Weijin Rd, Tianjin 300072, China
Submission: November 14, 2017; Published: February 21, 2018

ISSN: 2578-031X Volume1 Issue3
Abstract
A series of laboratory experiments were carried out to investigate the settling behavior of cohesive sediment/mud from Huangmaohai Estuary of the South China Sea. Based on the experimental observations and measurements, the influence of the flocculation phenomenon, tube geometries, initial mud concentration and salinities on the sediment settling velocities were investigated systematically. Experiments showed complex time-varying settling processes of the cohesive sediment in quiescent water, which were divided into two successive stages:
i) The stage of the flocculated sediment settling.
ii) The stage of sediment packing and consolidation.
During the transition between these two stages, there was an abrupt change of the settling velocity. Time-dependent settling velocity was then described with functions obtained from regression analysis, which showed a linearly decreasing settling velocity during the first stage and an exponential decreasing trend during the second stage. The influence of tube diameter variation was negligible on the mud settling process, while the tube length had significant influence on the transition pattern between two stages. Mud concentration played an important role in the flocculation formulation, and finally dominated the settling velocity of the cohesive sediment. It led to a distinguished peak value of the settling velocity corresponding to an initial sediment concentration of 20kg/m3. Salinity also exhibited obvious impact at the beginning stage of the settling, which presented a lowest settling velocity corresponding to a salinity of 15% for 50kg/m3 mud samples.
Keywords: Coastal mud; Settling velocity; Flocculation
Introduction
The settling and erosion feature of the bottom sediment in coastal areas has long been an interest for numerous scientists and engineers with motivations ranging from coastal engineering applications, to long-term environmental and ecological problems [1,2]. From the aspect of engineering, the hydraulic feature of the bottom sediment under the action of currents and waves is usually a main concern during the design of harbors and navigation waterways [3], planning of waterway dredging schemes, as well as siting of water intakes for coastal power plants [4-6]. For instance, a total amount of about 57*106m3 of fine sediment has to be dredged in the Yangtze Estuary during the 3rd phase (2006-2008) of the Deep-Water Channel Project in China due to siltation requirement [7]. With the ever-developing advancement of hydrodynamics and computational mathematics, great progress has been made in understanding the flow conditions in coastal environment, and two or three dimensional flow simulations were extensively put to use [8-10]. However, the modeling of the sediment transport remains a challenge regarding the reliability of the simulation output [4,11]. Therefore, the mechanical behavior of the bottom sediment, especially the cohesive sediment or mud, need to be further studied. From the environmental aspect, many pollutants, such as heavy metals, pesticides, and nutrients are easily absorbed by sediment in coastal areas [7,12-15] thus these sediment serve as carriers for the transportation of both the pollutants and the nutrients. This will eventually affects the living and growth of the bentonic organisms[16] . In this context, research on coastal sediment behavior is of great importance both environmentally and ecologically.
It has been greatly accepted that the settling behavior of coastal sediment plays a crucial role in the seabed evolution, sediment suspension and deposition in navigational channels [17] . The settling velocity of the sediment is one of the most important parameters required during the modeling of the sediment transport [18]. However, the settling veloty is extremely difficult to determine for cohesive sediment/mud, which is the common composition in most coastal areas of the world. The lack of understanding on coastal mud behavior is mainly owing to the diversity of its physical and chemical properties. Particle size grading and water content are usually believed to be the two major attributes dominating the mechanical behaviors of the coastal mud [19], including the settling velocity and the incipient motion under the action of currents and waves. However, there are still many other factors may complicate coastal mud behaviors. For instance, when the flocculation concentration approached, the turbulence- induced aggregation and flocculation breakage may alter the settling velocity of mud. This has been widely verified by both laboratory experiments [20] and field surveys [21], and successfully simulated by some mathematical models [22]. Furthermore, the existence of benthic organisms or communities can also add to the uncertainty of coastal mud settling, resuspension and transport[15,16,23] . The salinity of water [24], flow shearing conditions [25] or even temperature [26] may have influence on the flocculation formation and consequently the settling velocty of the cohesive sediment. Spatial and temporal variation in cohesive sedimentMaterials settling velocities were widely demonstrated [27]. Considering the diversity of coastal mud properties, the knowledge of the above mentioned factors, including their association with the generation, transport, and dewatering of fluid muds, remains incomplete[28] . More laboratory and field measurements of coastal mud settling from diverse areas are still necessary to get to a further and comprehensive understanding. The present research focuses on a systematically investigation on the settling behavior of the cohesive coastal sediment/mud from Huangmaohai Estuary, South China Sea through a series of laboratory experiments. During these experiments, the time varying sediment settling velocity were measured and analyzed and the influence of the tube geometry, mud concentration and water salinity on the settling velocities were also systematically investigated.
Materials
Figure 1: Location of mud sample in Huangmaohai Estuary, South China Sea.

Figure 2: Particle grading curve of the mud sample used in the experiments.

Mud samples were taken from the coastal area of Huangmaohai Estuary of the South China Sea, which is a bell-mouthed bay on the west of Pearl River Estuary, China, (Figure 1). A grab dragged by steel wires was used to take the mud sample from the seafloor. The grab has jaws that will close when they hit the sea floor, which makes it very effective for taking muddy materials. The core of the sample with a volume of around 0.5m3 was taken and kept undisturbed to make it close to its original field status. (Figure 1) The gradation of the mud sample was tested with a laser particle size analyzer and the results were shown Figure 2. The median size is 0.007mm, which shall be classified as "silt” according to the Wentworth scale (or Udden-Wentworth) used in the United States[29] and "medium silt” according to the ISO 14688-1 [3]. According to the grading curve, the content of the silty sand with a medium diameter between 0.005mm and 0.05mm is around 50% and the clay content with a medium diameter between 0.002mm and 0.005mm is around 25%. The rest 25% are colloidal particles with diameter smaller than 0.002mm. The sample is mainly clay mud with trace amount of organic matters from the cultch (Figure 2).
Measurement Methods and Experimental Cases
The experiments were carried out with a series of transparent Lucite tubes (or settling column) with diameters ranging from 3.0cm to 8.6cm and tube heights ranging from 30cm to 200cm. Scale indicators were prepared and attached to each tube from the top to the bottom to read the mud level with a reading accuracy of 0.1mm. The density of the original mud, ρo, was measured with volumetric method and the sediment concentration, Co, were computed as:

where ρw and ρs are the densities of the water and the sediment, which are 1000kg/m3 and 2650kg/m3 respectively. At the beginning of the experiments, the mass of the field mud was computed according the tube volume and the objective sediment concentration. Then the mud was prepared and weighted with a balance. The mud was then put into a bucket, together with water to achieve the designed volume. The mud and water were stirred for 3 minutes in a bucket by hand to destroy the aggregation and flocculation structures. When finished, the fully mixed fluid was quickly poured into the tubes and a timer was started at the same time. The mud levels were read at certain time intervals. At the beginning of the experiment (around the first one hour), the time interval of mud level reading was 2 minutes. With the decrease in settling velocity, the time interval of mud level reading was increased to 5 minutes, 10 minutes, 20 minutes or even as long as several hours for some cases. Water temperature was also measured at certain time intervals. It was within 22 oC to 25 oC throughout all of the experiments owing to the air conditioning in the laboratory. Although it was reported that water temperature may have influence on the settling velocity of cohesive mud [26,30] this influence was ignored in our experiments because the temperature fluctuation was of fairly small magnitude. The experiments were categorized into four different cases: case I-IV, in order to compare the results in a straightforward way, (Table 1).
Table 1: Configuration of all experimental cases.

Experimental Results
Case I: Long time sediment settling in a 200cm-long tube
Figure 3: Schematic of cohesive sediment settling
A. Initial status
B. An interface developed
C. Two interfaces, a-a and b-b developed
D. Both interfaces descended with time
E. Two interfaces merged into one interface
F. Slow settling of the finial interface
a) Settling of sediment particles.
b) Group settling of flocculated sediments.
c) Packing and consolidation of sediments.

In order to investigate the long time sediment settling behaviour, mud settling was conducted in a 200cm-long tube for over 14 days. The initial mud concentration was 50kg/m3. The overall sediment settling process observed in the experiment can be basically described in the schematics shown in Figure 3. At the beginning, the fluid inside the entire tube was heavily turbid, (Figure 3A). After about 2 minutes, an interface developed from inside the tube and the fluid stratified into two layers: a lightly turbid layer on the top and a heavily turbid layer at the bottom (Figure 3B). With the settling of the interface, the turbidity of the top layer decreased and there was another interface developed on the top (Figure 3C& 3D). The second interface, b-b was not as clear as the first interface (a-a) and the settling velocity of the second interface was much lower, which led to a combination of the two interfaces finally (Figure 3E). The combined interface deposited slowly to form consolidated mud at the bottom of the tube (Figure 3F). The settling process indicated in Figure 3A-3F was dominated by three major mechanisms: sediment particle settling, flocculation and sediment packing (Figure 3a-3c). At the beginning of the experiment, sediments settled downwards as individual particles because they are mechanically well-dispersed during preparation.The settling velocity at this stage can be estimated with the Stokes flow theory and coarser particles settled faster compared to finer ones. However, this status cannot maintain for a long time because the flocculation developed rapidly. The flocculated sediments usually present in the form of interconnected clusters, blocks or networks with equivalent diameters much larger than individual particle [25,31] (Figure 3b). Figure 3c shows the packing of the sediment when most the particles settled to the bottom. This process was very slow and it finally led to a consolidated status of bottom sediment [32,33]. Notice that all of these three mechanisms co-existed throughout the experiment, but with different proportion during different stages. For instance, the settling of the flocculated sediment dominated the most of the deposition process inside the tube, while the dispersed particle settling process and the sediment packing mechanisms were only significant at the beginning and the final stage of the experiment. Because the dispersed particles settling process lasted just several minutes, it was quite short when compared with the flocculation settling process and the sediment packing and consolidation stage. Therefore, mainly the latter two stages will be discussed in the following sections (Figure 3).
The settling process of the fully mixed sediments in a 200cm- long tube is shown in Figure 4. Notice that only the lower mud interface level was recorded, namely interface a-a in Figure 3C, because the upper interface, interface b-b was not clear enough for an accurate reading. The mud interface descended very fast from the beginning of the experiment and over 80% of the entire settling process occurred within the beginning 10hours; (Figure 4a). The average mud interface settling velocity was 0.4cm/min for the first 1 hour of the experiment and it decreased to 0.25cm/min and 0.15cm/min after 4 hours and 10 hours, respectively. There are two possible mechanisms may interpret this tendency of time decreasing settling velocity: firstly, the flocculation structures of the cohesive sediments have different sizes, consequently those with larger equivalent diameters fall faster, leaving the smaller ones on the top showing the interface we observed. In this case, the flocculation size is spatially varying [22] and shall be nonuniform along the tube height. Another possible cause is that the flocculation structures are temporally varying [34] and developing into stronger networks or more complex fractural shapes [20,35] The existence of such shapes leads to a decrease in the settling velocity. However, notice must be paid to the fact such inferences or hypothesizes have not been fully verified in the present study and observation with high-power microscopes is possible to interpret this process by looking into the micro-scale flocculation structures [30,36,37]. After 10 hours from the beginning of the experiment, the sediment settling finally changed into a status of particle packing and consolidation. The settling velocity dropped dramatically to 3*10-4cm/min, which was over 1000 times slower than the flocculated settling within the beginning hours. After around 2 weeks, the settling process almost finished and the sediments turned into a relatively consolidated bed. At this stage, the settled bed exhibited solid phase properties and the bottom mud was supposed to gain certain strength to resist flow shearing [33,38,39]. Small magnitude of unevenness of the mud interface was observed close to the tube wall. During the settling, the mud concentration was increasing with time, as well as the mud density, which grew from 1031kg/m3 to 1280kg/m3. The time-varying mud interface settling process was also expressed in a logarithmic coordinates for the time duration, (Figure 4b). An interesting phenomenon observed was that there was an abrupt change of the settling velocity at around 600 minutes after the start of the experiment. This is the very key time separating the flocculated sediment settling stage from the final consolidation stage, which in return implies that the second hypothesis on the non-uniform settling of flocculated sediment should be more reasonable because if the non-uniformity of settling velocity was due to the flocculation size effect, the settling process should be smoother and the abrupt changing of the mud level may not appear (Figure 4).
Figure 4: Settling process of sediments in a 200cm-long tube indicated with mud interface level and mud density. The initial mud concentration was 50kg/m3. (Mud density was estimated according to the initial density and the transient mud height).

Figure 5: History of settling velocity of the mud interface in a 200cm-long tube with initial mud concentration of 50kg/m3.
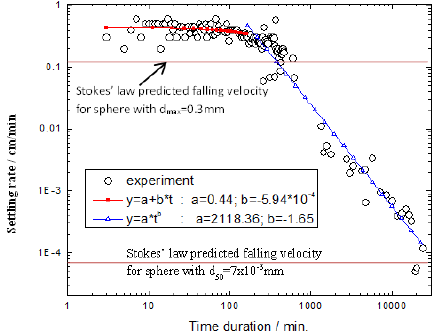
The time-varying settling velocity of the mud interface is shown in Figure 5. Due to the unavoidable reading error, the data show a certain noises. These scatters were not smoothed to keep the confidence of the original measurement. It can be seen from the figure that the settling velocity has decreased with time, which is the same as described in the discussions for (Figure 4,, the history of the settling velocity can be divided into two stages: the flocculation settling stage and the consolidation stage, which were separated at a time of around 600minutes. According to the data regression results shown in Figure 5, the settling velocity has a linearly decreasing relationship with time during the first stage and a nonlinear relationship during the second stage, which can be expressed with:

where c1,c2,c3,c4 is the settling velocity; are experimental coefficients and tc is the critical time for switching between two different settling stages. In this experiment, c1 = 0.44; c2 = -94× 10-4; c3 = 2118.36; c4=-1.65 and tc = 600min(Figure 5).
The settling velocity of individual sediment particles can be predicted with the Stokes' law when the sediment is fine and particle Reynolds number Re<<1. According to the Stokes' law, the settling velocity of a sphere, Sr, can be calculated by:

where Sr is the particles’ settling velocity; g is the gravitational acceleration; μ is the dynamic viscosity of the fluid; ρp is the mass density of the particles, and ρf is the mass density of the fluid. All of the above variables have SI units. Here we take g =9.81m/s2; for sediment particles, ρp =2650kg/m3; and for water at temperature 20 0C, μ =1.002x10⁻³Ns/m2 and ρf =1000kg/m3. Therefore, the settling velocities of the particle with an median diameter d50=7x10⁻³mm, the largest diameter of dmax =0.3mm and the smallest diameter of dmin =10-4mm are: Srd50=7.33x10⁻⁵cm/min; =1.35x10⁻¹cm/min; =1.5x10⁻⁸cm/min (4).
According to the calculation results shown in Equation(4,, the settling velocities measured in the experiment were much higher than the one calculated for the sphere with a diameter d50=7*10' 3mm or even dmax=0.3mm. The flocculation greatly augmented the equivalent diameter of the sediment and accelerated the settling [20,22,24] . At the settling velocity of 0.4cm/min, the equivalent diameter (assuming that flocculations are roughly spherical [24] computed using Stokes' theory is 0.517mm, which is 74 times of the median diameter d50. From this point of view, one flocculation cluster or block may have 743= 405224 sediment particles from a rough estimate. Considering that the flocculation structure may not have a spherical shape [35], more particles may be required to achieve the final group settling velocity. Therefore, it makes sense to estimate that each flocculation cluster shall be composed of sediment particles with a number at the order of one million (106,.
Case II: Tube effect on sediment settling
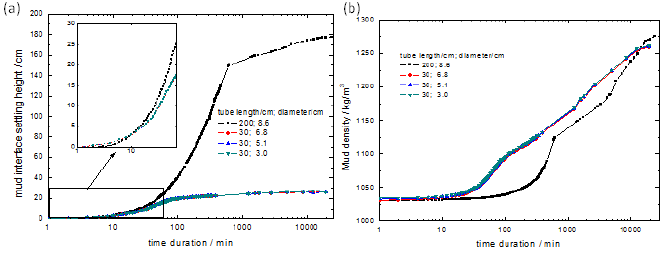
In order to investigate the influence of the tube/settling column geometry on the sediment settling process, laboratory experiments were carried out in 4 tubes with different lengths (L, in cm) and diameters (Φ, in cm): L200 Φ8.6, L30 Φ6.8, L30 Φ5.1 and L30 Φ3.0. The time histories of the mud interface level and the mud density are shown in Figure 6. The tube walls has enforced non-slip (or nearly non-slip) boundaries for the fluid, which may have introduced upward dragging on the sediment particles or the mud interface of the flocculated sediment. Besides, tube diameter may suppress the development of large flocculation structures. Experimental measurements show that the tube diameter variation from 3.0cm to 8.6cm has little influence on the settling process of the cohesive mud, (Figure 6). This implies that even for the tube with a diameter as small as 3.0cm, the tube diameter is large enough compared with the size of flocculation structures and the boundary effect from the tube wall on settling process is negligible. However, (Figure 6) also shows that the length of the tube exhibited significant influence on the settling process of the cohesive sediment. The settling velocity of the mud interface decreases much faster in the 30cm-long tubes compared with the 200cm-long tube. Another interesting phenomenon is that the experiment in the 200cm-long tube showed an abrupt change of mud interface settling velocity which never appeared in the 30cm-long tubes; (Figure 6a). As mentioned above, this abrupt change corresponds to the transition from the stage of the flocculated settling to the stage of sediment packing and consolidation. The smoothness of the settling curve in the 30cm-long tubes implies that the packing and consolidation process occurred at the same time of flocculation settling. Consequently, there was no obvious transition between these two settling stages. Another inference based on this is that the longer the tube, the sharper of the transition between different settling stages. In most of the coastal environments, for instance the navigational waterways, the water depth usually ranges from 10m to 30m. The storm surge induced sediment suspension should settle to seabed with a clear distinction between the settling stage and the consolidation stage because the water depth is much larger than 200cm. This feature shall be fully considered for the modeling and computing of seabed evolution after storm surge. The mud density history is shown in Figure 6b. It shows that mud density increases faster in the 30cm-long compared with the 200cm-long tube for most of the settling process. However, after a sufficiently long time, the final density in the 200cm-long tube tends to exhibit higher packed density, which implies that the water pressure upon the mud interface may play a role on promoting the consolidation process of the settled bed [32,39]. It is worth noting that although the tube length has significant influence on the mud settling process, it shows little influence on the highest settling velocity of the mud interface, which usually appears within the beginning 60minutes, (Figure 6a). Therefore, 30cm-long tubes will be used for all of the following experimental cases to obtain the highest settling velocity (Figure 6).
Figure 6: Settling process of mud in various tubes:
a) Time history of the mud interface settling height.
b) Mud density history.
Case III: Initial mud concentration influence on sediment settling
Mud concentration plays an important role in the flocculation formulation, which finally dominates the settling velocity of the cohesive sediment [20,40,41]. In order to systematically investigate this influence, 15 mud samples with different initial concentrations, ranging from 1kg/m3 to 500kg/m3, were prepared and experiments were carried out in the 30cm-long tubes. The settling process is shown in Figure 7. The settling behaviors can be basically classified into three groups according to the feature of the mud interface history in Figure 7a Group I includes the initial mud concentration of 20kg/m3 and 500kg/m3; Group II includes the initial mud concentration ranging from 20kg/m3 to 100kg/m3 and Group III includes the initial mud concentration equal or lower than 10kg/ m3. The settling velocities in Group I are much lower than that of Group II mainly because of the high concentration feature of the mud mixture, which brings forward the transition from the flocculation settling stage to the packing and consolidation process. Mud mixtures with such high concentrations can usually be found near seabed [42] or after sediment re-suspension during very strong storm surges [43,44]. Group II covers the mud concentration of most of the coastal engineering applications [3,31,45,46,]. The muds with initial concentration ranging from 20kg/m3 to 100kg/ m3 show similar settling processes, which have a smooth transition between the two different settling stages. Flocculation plays an important role during the settling in this group. For settling in Group III, the flocculation of the sediment particles seems difficult to form because of the extremely low sediment concentration and the mixture kept turbid for a quite long time after the beginning of the experiment. No clear mud interface was observed until the final stage (Figure 7b-7c). According to the experimental observation, mud concentration is an important factor determining both the formation of flocculation and the visibility of the mud interface at the top (Figure 7).
Figure 7: The settling process of sediment with different initial concentrations:
a) Time history of mud interface level.
b) Snapshot of the experiment at t=240min, the initial mud concentrations from the left to the right are 100kg/m3, 90kg/m3, 80kg/m3, 70kg/ m3, 60kg/m3, 50kg/m3, 40kg/m3, 30kg/m3, 20kg/m3, 10kg/m3, 6kg/m3, 3kg/m3 and 1kg/m3 respectively.
c) Snapshot of the experiment at t=1800min.
d) The initial mud concentrations are the same as.
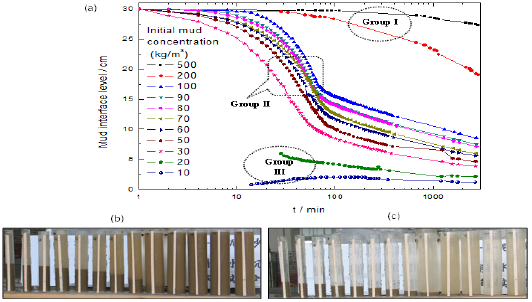
Table 2: The highest settling velocity of mud with different initial concentrations.
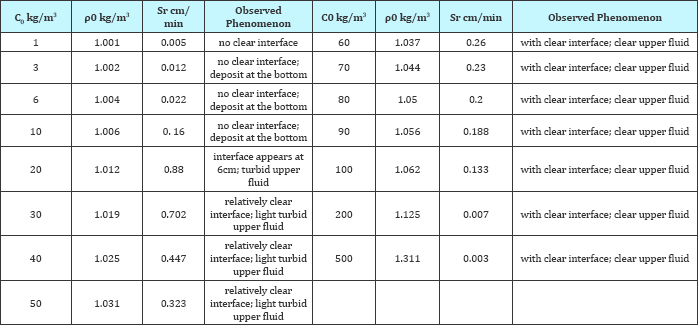
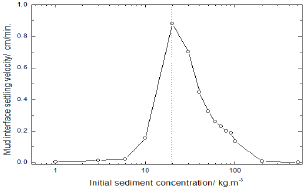
During the experiments, the highest settling velocity, Sr, of the mud with different initial concentrations, C0, or initial mud density, ρ0, was calculated, see Table 2. The visibility of the mud interface and the turbidity of the fluid upon the interface observed during experiments were also described Table 2. Experimental results show that the mud interface settling velocity does not change monotonously with the mud concentration, see Figure 8. There is an obvious peak value of the settling velocity corresponding to an initial sediment concentration of 20kg/m3. For the mud concentration lower than 20kg/m3, the particles were too sparse to form large flocculation structures and particles settled slowly and individually. On the contrary, in experiments with higher concentrations, the flocculation structures were densely distributed and the network were too strong to let the sediment settle down quickly. The peak value of the settling velocity represents a balance between these two mechanisms. Note that for the measurement data for mud concentration lower than 10kg/m3, the mud interface didn't appear at the beginning stage of the experiment and the settling velocities were calculated from the appearance of a later readable mud interfaces. Because of the low concentration, the collision of the particles was rare and the settling was dominated by Brownian movement and single particle settling motion. The flocculation failed to form at the beginning of the experiment. In the experiments with initial sediment concentration between 10kg/m3 and 100kg/m3, the highest settling velocities of the mud interfaces ranged from 0.2cm/min to 0.9cm/min. For other cases with lower or higher initial sediment concentrations, the settling velocity was 10-100 times lower. Therefore, the sediment concentration is a key factor affecting the settling velocity of the cohesive sediment (Figure 8).
Figure 8: Influence of initial sediment concentration on the highest mud interface settling velocity.
The influence of salinity on the settling of cohesive sediment has long been identified [24] and such influence has wide applications in water treatment industry [47]. The saline matter dissolved in water provides icons promoting the formation of flocculation structures and consequently increase the settling velocity of the sediment. On average, seawater in the world's oceans has a salinity of about 3.5% (35g/L). This means that every kilogram (roughly one litre by volume) of seawater has approximately 35g of dissolved salts (predominantly sodium (Na+) and chloride (Cl-) ions. To investigate the influence of salinity on the settling velocity quantitatively, experiments were carried out under the same initial mud concentration (50kg/m3) but with different salinities. The water salinity was adjusted with salt (NaCl) to 13 different values ranging from 0 to 100% (mass percentage). The time history of the sediment settling is shown with the mud density in Figure 9a. It shows that the general settling tendencies under different salinities are quite similar. This is due to the fact that for mud with initial concentration of 50kg/m3, flocculation formed even with zero salinity. Although the salinity didn't show significant influence on the final settling of the mud (Figure 9c), it exhibited obvious influences at the beginning stage of the settling process (Figure 9b). Such influences include the turbidity of the upper fluid, the clarity of the mud interface and the sediment settling velocity as well. As shown in Figure 9b, for sediments with salinity higher than 20%, the experiments exhibited an easily recognizable mud interface with a clear fluid upon, which means the ions provided by the salt greatly enhanced the formation of flocculation [24,47] (Figure 9). The highest settling velocity, Sr, of the mud with different salinities, Cs was shown in Table 3, as well as descriptions on the visibility of the mud interface and the turbidity of the fluid upon. Notice that the settling velocities have relatively larger reading errors for the cases with salinities less than 10% because the mud interface was relatively obscure under the weak flocculation effect at the beginning stage of the settling (Table 3).
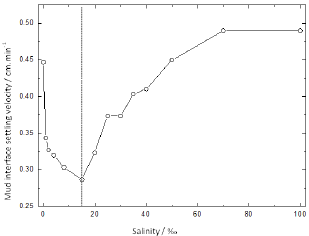
The salinity can change the settling velocity (highest value in time history) of the mud interface by a magnitude of nearly 2 times (Figure 10). The interesting phenomenon is that the mud interface settling velocity does not change monotonously with the salinity, which is quite similar as the influence from the mud concentration shown in Figure 8. There is a lowest value of the settling velocity corresponding to a salinity of 15%. For salinities higher than 15%, the increase in salinity tends to increase the mud interface settling velocity. This part agrees with the commonsense reasoning based on the fact that ions provided by salt promote the flocculation formation [47]. The settling velocity reached a peak value of 4.9cm/min at a salinity of 70% and further increase in salinity didn’t cause increase in settling velocity any more. However, for the experiment with salinities ranging from 0 to 15%, the increase in salinities tends to decrease the interface settling velocity. The decrease in settling velocity with increasing salinity is quite interesting because it implies that the role of added ions on settling of cohesive sediment should be much more complex than our original understandings. Our preliminary inference here is that for experiments with salinities lower than 15%, the flocculation effect is not intensive enough to capture all sediment particles into the flocculation cluster and coarser particles tends to settle firstly with a relatively high velocity, leaving part of the finer sediments on the top. With the increase in salinity, the cohesive sediments have to take time to form stronger flocculation clusters at the very beginning of the experiment [48]. On the other hand, the salinity promotes flocculation and accelerates the settling. The counterbalance between these two mechanisms leads to the appearance of a valley value at salinity of 15%. Of course, this is only a rough deduction and the fundamental mechanism need to be further investigated and hopefully, verified with experimental observations under microscopes. Another fact to be noticed here is that only one kind of substance (NaCl) was used to provide salinity and ions, and the mud is also specific regarding its grain sizes and chemical components. Much more experiments shall be carried out to reproduce such phenomenon (Figure 10).
Figure 9: The settling process of sediment with different salinities and the same initial mud concentration (50kg/m3) (a) time history of mud density; (b) snapshot of the experiment at t=120min, the salinities from the left to the right are 100%, 70%, 50%, 40%, 35%, 30%, 25%, 20%, 15%, 8%, 4%, 2%, 1% and 0% respectively, the mark* represent the average seawater salinity; (c) snapshot of the experiment at t=2400min, the salinities are the same as (b).
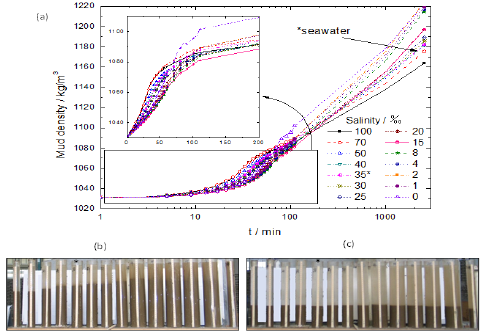
Table 3: The highest settling velocity of mud with different salinities.

Figure 10: Influence of salinity on the highest mud interface settling velocity.
Conclusion
In order to investigate the settling of the cohesive sediment in stationary water, a series of laboratory experiments were carried out. The cohesive sediment/mud was sampled from the coastal area of Huangmaohai Estuary of South China Sea and settling processes were observed in settling tubes/columns with the recorded time varying positions of the mud interfaces. Based on the interface, the settling velocities and the mud densities for each case were calculated and analyzed. The influence from the flocculation phenomenon, the tube geometries, the initial mud concentration and the salinities of the water were investigated systematically [49]. The settling processes of the cohesive sediment in quiescent water showed complex time-varying phenomena during the laboratory experiments, which were divided into two stages: the stage of the settling of the flocculated sediment and the stage of the sediment packing and consolidation. Flocculation effect accelerated the sediment settling by an order of 1,000 compared with the settling velocity of individual sediment particles predicted with the Stokes' law. For sediment with initial concentration of 50kg/m3, the settling velocity of the mud interface reached as high as 0.4cm/min. However, the settling velocity dropped dramatically to 3x10⁻⁴cm/min during the final consolidation stage. There is an abrupt change on the mud interface settling curve, which implies a transition between these two stages [50]. Time-dependent settling velocity was described with simple functions based on regression analysis, which shows a linearly decreasing settling velocity with time during the first stage and an exponential decreasing rate during the second stage.
The tube diameter variation from 3.0cm to 8.6cm has little influence on the settling process of the cohesive mud. However, the length of the tube exhibited significant influence, except for the beginning stage of the experiment. Experiments in tubes with a length of 30cm showed much smoother transitions between the two settling stages compared with the experiments in a 200cm- long tube, which implied the packing and consolidation process occurred at the same time of flocculation structure settling. Mud concentration plays an important role in the flocculation formulation, which finally dominating the settling velocity of the cohesive sediment. There is a clear peak value of the settling velocity corresponding to an initial sediment concentration of 20kg/m3. Salinity exhibited obvious influences at the beginning stage of the settling process, which include the turbidity of the upper fluid, the clarity of the mud interface and the sediment settling velocity There is a lowest value of the settling velocity corresponding to a salinity of 15% for mud with an initial concentration of 50kg/m3.
Acknowledgement
We thank the support by the National Natural Science Foundation of China (Grant no. 51009105), the Science Fund for Creative Research Groups of the National Natural Science Foundation of China (Grant no.51021004), the Natural Science Foundation of Tianjin (Grant no. 12JCQNJC05600) and the Open Research Funds from State Key Laboratory of Hydraulic Engineering Simulation and Safety (2012).
References
- Berlamont J, Ockenden M, Toorman E, Winterwerp J (1993) The Characterization of Cohesive Sediment Properties. Coastal Engineering 21(1-3): 105-128.
- 2. Gao S, Jia J (2002) Modeling suspended sediment distribution in continental shelf upwelling/downwelling settings. Geo-Marine Letters 22(4): 218-226.
- Dean R, Dalrymple R (2002) Coastal Processes with Engineering Applications. In: Dean R, Dalrymple R (Eds.), Coastal Processes with Engineering Applications. Cambridge University Press, UK.
- Lumborg U, Pejrup M (2005) Modelling of cohesive sediment transport in a tidal lagoon-an annual budget. Marine Geology 218(1-4): 1-16.
- Xu D, Huang BS, Qiu J, Huang D (2006) Experimental study on the hydraulic characteristics of sea bottom mud in Taishan Nuclear Power Project, Guangdong, China.
- Xu D, Bai Y, Ma J, Tan Y (2011) Numerical investigation of longterm platform dynamics and stability of river meandering on fluvial floodplains. Geomorphology 132(3): 195-207.
- Zhu YH, Lu JY, Liao HZ, Wang JS, Fan BL, et al. (2008) Research on cohesive sediment erosion by flow: An overview. Science in China Series E-Technological Sciences 51(11): 2001-2012.
- Bowles FA, Faas RW, Vogt PR, Sawyer WB, Stephens K, et al. (2003) Sediment properties, flow characteristics, and depositional environment of submarine mudflows, Bear Island Fan. Marine Geology 197(1-4): 6374.
- Etemad-Shahidi A, Shahkolahi A, Liu WC (2010) Modeling of Hydrodynamics and Cohesive Sediment Processes in an Estuarine System: Study Case in Danshui River. Environmental Modeling & Assessment 15(4): 261-271.
- Ou J, Ma JR, Zhang XN (2010) Study on 2D Flow and Sediment Numerical Model under the Influence of Building Bridges in Fluid Mud Area. Proceedings of the 4th International Yellow River Forum on Ecological Civilization and River Ethics 4: 233-242.
- Sumer BM (2007) Mathematical modelling of scour: A review. Journal of Hydraulic Research 45(6): 723-735.
- Krestenitis YN, Kombiadou KD, Savvidis YG (2007) Modelling the cohesive sediment transport in the marine environment: the case of Thermaikos Gulf. Ocean Science 3(1): 91-104.
- Liu WC, Hsu MH, Kuo AY (2002) Modelling of hydrodynamics and cohesive sediment transport in Tanshui River estuarine system, Taiwan. Marine Pollution Bulletin 44(10): 1076-1088.
- Schratzberger M, Rees HL, Boyd SE (2000) Effects of simulated deposition of dredged material on structure of nematode assemblages- the role of burial. Marine Biology 136(3): 519-530.
- Widdows J, Brinsley M (2002) Impact of biotic and abiotic processes on sediment dynamics and the consequences to the structure and functioning of the intertidal zone. Journal of Sea Research 48(2): 143156.
- Paterson DM, Black KS (1999) Water flow, sediment dynamics and benthic biology. Advances in Ecological Research 29(29): 155-193.
- Calliari LJ, Winterwerp JC, Fernandes E, Cuchiara D, Vinzon SB, et al. (2009) Fine grain sediment transport and deposition in the Patos Lagoon-Cassino beach sedimentary system. Continental Shelf Research 29(3): 515-529.
- Kleinhans MG, Grasmeijer BT (2006) Bed load transport on the shoreface by currents and waves. Coastal Engineering 53(12): 983-996.
- Aberle J, Nikora V, Walters R (2004) Effects of bed material properties on cohesive sediment erosion. Marine Geology 207(1-4): 83-93.
- Manning AJ, Baugh JV, Spearman JR, Whitehouse RJS (2010) Flocculation settling characteristics of mud: sand mixtures. Ocean Dynamics 60(2): 237-253.
- Sun HY, Perkins RG, Watson J, Player MA, Paterson DM, et al. (2004) Observations of coastal sediment erosion using in-line holography Journal of Optics a-Pure and Applied Optics 6(7): 703-710.
- Winterwerp JC (2002) On the flocculation and settling velocity of estuarine mud. Continental Shelf Research 22(9): 1339-1360.
- Willows RI, Widdows J, Wood RG (1998) Influence of an infaunal bivalve on the erosion of an intertidal cohesive sediment: A flume and modeling study. Limnology and Oceanography 43(6): 1332-1343.
- Kumar RG, Strom KB, Keyvani A (2010) Floc properties and settling velocity of San Jacinto Estuary mud under variable shear and salinity conditions. Continental Shelf Research 30(20): 2067-2081.
- Manning A, Dyer K (1999) A laboratory examination of floc characteristics with regard to turbulent shearing. Marine Geology, 160(1-2): 147-170.
- Lau Y (1994) Temperature effect on settling velocity and deposition of cohesive sediments. Journal of Hydraulic Research 32(1): 41-51.
- Dickhudt PJ, Friedrichs CT, Schaffner LC, Sanford LP (2009) Spatial and temporal variation in cohesive sediment erodibility in the York River estuary, eastern USA: A biologically influenced equilibrium modified by seasonal deposition. Marine Geology 267(3): 128-140.
- Mehta AJ (1989) On estuarine cohesive sediment suspension behavior Journal of Geophysical Research 94(C10): 14303-14314.
- Krumbein WC, Sloss LL (1963) Stratigraphy and Sedimentation. In: Krumbein WC, Sloss LL (Eds.), Stratigraphy and Sedimentation. Freeman, California, USA.
- Paterson DM, Tolhurst TJ, Kelly JA, Honeywill C, de Deckere E, et al. (2000) Variations in sediment properties, Skeffling mudflat, Humber Estuary, UK. Continental Shelf Research 20(10-11): 1373-1396.
- Winterwerp JC, de Graaf RF, Groeneweg J, Luijendijk AP (2007) Modelling of wave damping at Guyana mud coast. Coastal Engineering 54(3): 249-261.
- Merckelbach LM, Kranenburg C, Winturwerp JC (2002) Strength modelling of consolidating mud beds. Fine Sediment Dynamics in the Marine Environment 5: 359-373.
- Tomas J (2004) Fundamentals of cohesive powder consolidation and flow. Granular Matter 6(2-3): 75-86.
- Son M, Hsu TJ (2011) The effects of flocculation and bed erodibility on modeling cohesive sediment resuspension. Journal of Geophysical Research 116(C3): C03021.
- Maggi F (2007) Variable fractal dimension: A major control for floc structure and flocculation kinematics of suspended cohesive sediment. Journal of Geophysical Research 112(C7).
- Fennessy M, Dyer K, Huntley D (1994) INSSEV: An instrument to measure the size and settling velocity of flocs in situ. Marine Geology 117(1-4): 107-117.
- Schettini CAF, de Almeida DC, Siegle E, de Alencar ACB (2010) A snapshot of suspended sediment and fluid mud occurrence in a mixed-energy embayment, Tijucas Bay, Brazil. Geo-Marine Letters 30(1): 47-62.
- Krone RB (1999) Effects of bed structure on erosion of cohesive sediments. Journal of Hydraulic Engineering-Asce 125(12): 1297-1301.
- Merckelbach LM, Sills GC, Kranenburg C (2000) Laboratory experiments on consolidation and strength of bottom mud. Proceeding in Marine Science 3: 201-213.
- Holland KT, Vinzon SB, Calliari LJ (2009) A field study of coastal dynamics on a muddy coast offshore of Cassino beach, Brazil, Continental Shelf Research 29(3): 503-514.
- Krishnappan BG, Marsalek J (2002) Modelling of flocculation and transport of cohesive sediment from an on-stream stormwater detention pond. Water Research 36(15): 3849-3859.
- NG ON, Zhang XY (2007) Mass transport in water waves over a thin layer of soft viscoelastic mud. Journal of Fluid Mechanics 573: 105-130.
- Fujiwara O, Kamataki T (2007) Identification of tsunami deposits considering the tsunami waveform: An example of subaqueous tsunami deposits in Holocene shallow bay on southern Boso Peninsula, Central Japan. Sedimentary Geology 200(3-4): 295-313.
- Zimmerman JR, Bricker JD, Jones C, Dacunto PJ, Street RL, et al. (2008) The stability of marine sediments at a tidal basin in San Francisco Bay amended with activated carbon for sequestration of organic contaminants. Water Research 42(15): 4133-4145.
- Giardino A, Ibrahim E, Adam S, Toorman EA, Monbaliu J (2009) Hydrodynamics and Cohesive Sediment Transport in the IJzer Estuary, Belgium: Case Study. Journal of Waterway Port Coastal and Ocean Engineering-Asce 135(4): 176-184.
- Sanchez M, Levacher D (2008) Erosion of a mud from the Loire estuary by a flow. Bulletin of Engineering Geology and the Environment 67(4): 597-605.
- Montomery J (1985) Water treatment principles and design, John Wiley and Sons, USA.
- Hoyal D, Sheets BA (2009) Morphodynamic evolution of experimental cohesive deltas. Journal of Geophysical Research-Earth Surface 114(F2).
- Li J, Zhang C (1998) Sediment resuspension and implications for turbidity maximum in the Changjiang Estuary. Marine Geology 148(3- 4): 117-124.
- Wang Y, Gao S, Jia J (2006) High-resolution data collection for analysis of sediment dynamic processes associated with combined current-wave action over intertidal flats. Chinese Science Bulletin 51(7): 866-877.
© 2018 Dong XU, et al. This is an open access article distributed under the terms of the Creative Commons Attribution License , which permits unrestricted use, distribution, and build upon your work non-commercially.
 a Creative Commons Attribution 4.0 International License. Based on a work at www.crimsonpublishers.com.
Best viewed in


.jpg)


 Editorial Board Registrations
 Submit your Article
 Refer a Friend
 Advertise With Us
.jpg)


.jpg)


.bmp)
.jpg)
.png)
.jpg)


.png)

.png)


.png)


