

- About Us
- Information
-

The Author ensures that the research has been conducted responsibly and ethically with adherence to all relevant regulations. read more..
- For Authors
- For Reviewer
- Manuscript Guidelines
- Membership
- Publication Ethics
-
- Journals
- Reprints
- e-Books
- Videos
- Policies
- Contact Us
 COVID-19
- Submissions



Full Text
Environmental Analysis & Ecology Studies
Multi-Element Characteristics and Inter-Site Differences in Urban Surface Dust in Belgorod, Russia
Lihua Huang and Fedor Lisetskii*
Institute of Earth Sciences, Belgorod State National Research University, Russia
*Corresponding author:Fedor Lisetskii, Institute of Earth Sciences, Belgorod State National Research University, 85 Pobedy Street, Belgorod, Belgorod Oblast, 308015, Russia
Submission: October 01, 2026; Published: October 13, 2026

ISSN 2578-0336 Volume14 Issue 1
Abstract
In cities where industrial facilities, railways, and roads are interspersed, whether dust within the same environmental group has a similar elemental composition is a key question for defining monitoring units and selecting elements of interest. This study examined 12 elements at 16 sampling sites in Belgorod, Russia, using a local forest soil reference, hierarchical clustering, and Spearman rank correlation to analyze inter-site differences in multiple elements and their relationships with proximity to transport infrastructure. Cu and Zn exceeded the selected reference at all 16 sites, Pb exceeded the reference at 13 of the 14 sites with valid observations, and As exceeded the reference at only four sites. S12 had the highest concentrations of Zn, As, and Ba, whereas the correlations of Zn with As and Ba across sites were close to zero, indicating that local co-occurrence of high concentrations and overall covariation are not equivalent. Clustering identified a combination of relatively high Cu and As levels spanning thermal power plant, railway station, and industrial-traffic areas. The clustering results showed that multi-element similarity did not correspond one-to-one with the five environmental groups. Cu and As showed a relatively strong positive correlation (ρ=0.827, p<0.05), whereas railway distance was negatively correlated with Pb (ρ=-0.582, p<0.05). This study provides a basis for site selection and the choice of monitoring indicators for local environmental monitoring.
Keywords:Urban surface dust; Elemental composition; Hierarchical clustering; Spearman correlation
Introduction
Urban surface dust comprises both natural mineral particles and particles generated by human activities, and its elemental composition is influenced by material inputs, surface retention, and redistribution. Studies of solid atmospheric deposition in cities have emphasized the transfer of particulate matter to surface systems [1]; tire and brake wear, road materials, adjacent soils, and other local inputs can all influence the chemical composition of dust [2]. Therefore, dust geochemical studies need to consider both elemental concentrations and the environmental context of the particles carrying these elements.
Previous studies have provided evidence for processes associated with traffic-related elements: tire wear can release Zn into the environment [3], brake wear can generate particles containing Cu and Fe [4], and railway activities can contribute Fe, Mn, and Cu to nearby airborne particulate matter [5]. Recent reviews of non-exhaust particulate matter and studies of road and rail brake dust further show that the elemental composition of wear particles is influenced by materials and operating conditions, and that different traffic-related processes may have overlapping elemental characteristics [6,7].
Studies of road or urban dust in Tyumen and Moscow, Russia, have linked elemental composition to traffic load, potential sources, and spatial differences [8,9]. Previous research in Belgorod compared elemental concentrations in surface materials near industrial facilities, transport infrastructure, and preschool facilities, and discussed the effects of different assessment benchmarks [10]. Building on this work, the present study further addresses two questions: whether sites near similar types of facilities have similar elemental assemblages, and whether the co-occurrence of high concentrations of multiple elements at an individual site is also reflected in covariation across the entire set of sites. A study of urban mosses in Gubakha provides a related example of combining elemental measurements with spatial analysis to examine surrounding activities [11].
This study examines surface dust material from 16 sampling sites by sequentially comparing reference ratios, multi-element similarity, and element-element and distance-element relationships, with a focus on assessing the correspondence between chemical similarity and field-based environmental grouping.
Material and Methods
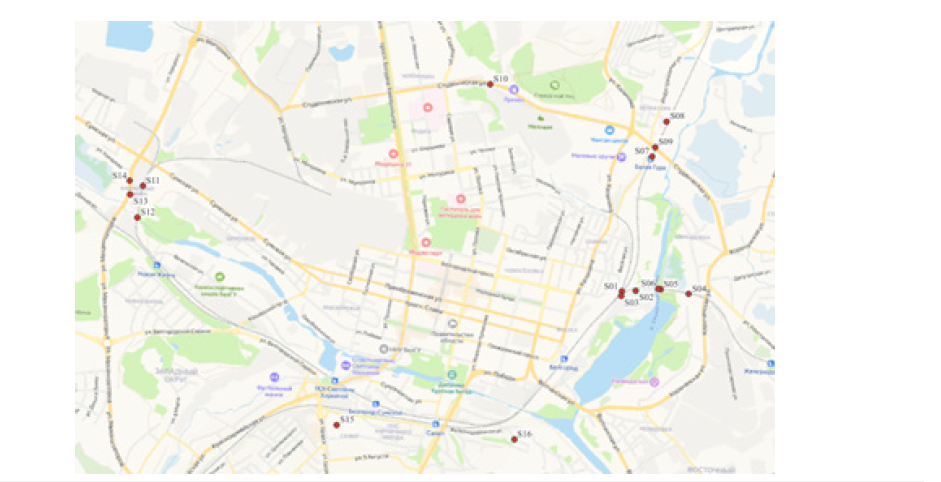
The study area is located in Belgorod, Russia. It is a multifunctional city with approximately 12,500 active enterprises and organizations, including industrial facilities that periodically come under the scrutiny of environmental regulatory bodies due to risks posed to air, water, or soil. For our study, a spatial sampling scheme for urban dust (on solid substrates) was established in an area where industrial facilities, railways, roads, and residential zones are interspersed. The analysis included 16 samples of urban surface dust, designated S01-S16 (Figure 1). Five descriptive environmental groups were defined according to the surrounding facilities: Group A comprised sites near the thermal power plant and industrial railways (S01-S06); Group B covered the road-rail junction area near Belaya Gora railway station (S07-S09); Group C consisted of a road site used by vehicles serving a chalk quarry (S10); Group D covered the Mekhanizatorov industrial and traffic area (S11-S14); and Group E represented the southern residential and traffic environment (S15-S16), including two spatially separated sites near Kindergartens No. 17 and No. 3. Across all sampling sites, the shortest horizontal distances to the defined railway and urban road centerlines ranged from 0.07 to 345.95m and from 1.77 to 390.10m, respectively; S10 was 345.95m from the railway and 1.77m from the urban road.
Figure 1:Distribution of urban surface dust sampling sites in Belgorod.
X-ray fluorescence spectrometry was used to determine the total contents of elements and metal oxides in powdered samples. Twelve common parameters were selected: Pb, Zn, Co, Cu, Mn, V, Cr, Fe, Ni, As, Sr, and Ba. All reported concentrations were converted to mg/kg. Where Fe₂O₃ was reported as a mass percentage, its value was first multiplied by 10000 and then by 0.699 to obtain elemental Fe; MnO values were converted to mg/kg and then multiplied by 0.774 to obtain elemental Mn. The coefficient of variation for each element was calculated as CV=standard deviation/mean × 100%.
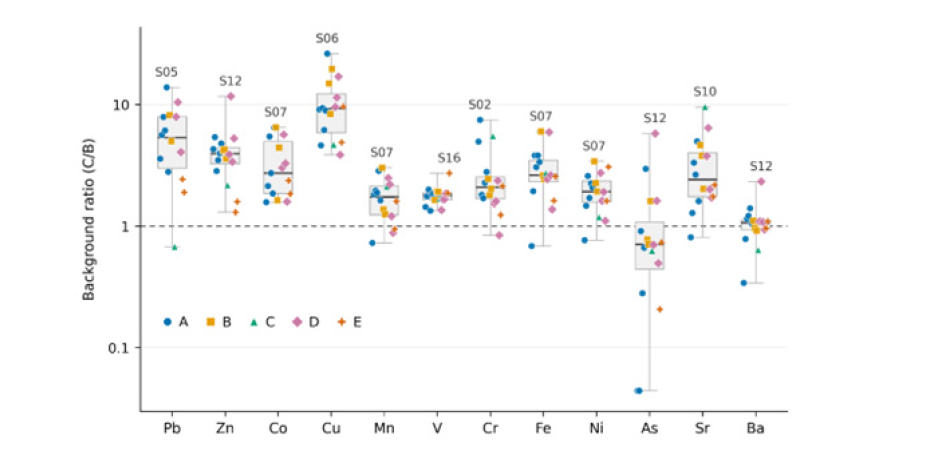
The reference concentrations, B, were consistently taken from the local forest soil values published by Lisetskii et al. [10]. This soil reference originated from the 0-10cm layer of Greyic Phaeozems in a primary forest within an urban protected area, with the sampling location situated between four old oak trees. The dimensionless ratio C/B was calculated by dividing the sample concentration, C, by the corresponding B; C/B>1 indicates only that the concentration exceeds this specific reference. Figure 2 uses a logarithmic vertical axis; the boxes span the 25th-75th percentiles, the central lines indicate the medians, the whiskers extend to the minimum and maximum valid observations, and the individual points represent the sampling sites.
Figure 2:Element concentration ratios relative to the local forest soil reference. The vertical axis is logarithmic, and the dashed line denotes C/B=1. Boxes indicate the interquartile range, center lines indicate the median, and whiskers indicate the minimum and maximum valid observations. Symbols represent environmental groups, and labels identify the sampling site with the highest value for each element.
Valid elemental concentrations were log₁₀-transformed and then standardized to Z-scores using the element-wise means and population standard deviations of the log-transformed values. For each pair of sites, squared differences in standardized values were summed across elements with valid measurements at both sites. This sum was multiplied by the ratio of the total number of elements to the number of jointly available elements, and its square root was used as the distance between the sites. Hierarchical clustering was performed using average linkage, and the heatmap was displayed with optimal leaf ordering.
Traffic proximity was described by the shortest horizontal distances from each sampling site to the defined railway and urban road centerlines. Distances derived from OpenStreetMap linear features in the accompanying GIS records were used; the record date was September 18, 2026. The original coordinates were treated as WGS84 coordinates, and the shortest point-to-segment distances were calculated in a local plane with its origin at 50.60 °N, 36.59 °E. Relationships between elements and between distances and elements were assessed using Spearman rank correlations based on pairwise valid observations. P values for the 66 inter-element correlations were adjusted using the Benjamini-Hochberg procedure [12].
Result
The degree of variability differed among the 12 elements. As had the highest CV of all elements, at 126.3%, with a mean of 15.33mg/kg and a median of 9.55mg/kg. The CVs of Sr, Cr, and Pb were 69.0%, 67.0%, and 63.1%, respectively, while those of Cu, Zn, and Co were 58.4%, 56.5%, and 54.3%, respectively. V had the lowest CV, at 18.0%. These results indicate that variation among sampling sites was element-specific.
Relative to the local reference, Cu and Pb had the highest median C/B values, at 9.24 and 5.34, respectively; the corresponding values for Zn, Co, Fe, Sr, and Cr were 3.94, 2.74, 2.62, 2.42, and 2.09, respectively (Figure 2). All 16 valid observations for Cu, Zn, and V and all 15 valid observations for Co exceeded their respective reference values. In contrast, the median C/B for As was 0.71, with only four sites, S06, S09, S12, and S13, exceeding the reference. Thus, relative to the selected reference, elevated Cu and Zn concentrations occurred throughout the set of sampling sites, whereas high As concentrations were mainly confined to a few sites.
The highest concentrations of individual elements occurred at different sites. Pb at S05 was 133.20mg/kg, and Cu at S06 was 84.68mg/kg, corresponding to reference ratios of 13.83 and 26.22, respectively. S12 had the highest concentrations of Zn, As, and Ba simultaneously, at 498.40, 77.90, and 1011.40mg/kg, respectively. S02 had the highest Cr concentration, at 327.10mg/kg; S07 had the highest Co, Mn, Fe, and Ni concentrations; and S16 had the highest V concentration, at 84.20mg/kg. At S10, Sr was 519.02mg/kg and Cr was 240.48mg/kg, whereas Pb was only 6.51mg/kg, showing an elemental composition distinct from those of the sites described above.
Hierarchical clustering showed that sites with similar chemical compositions could belong to different environmental groups, while differences also occurred within the same group (Figure 3). S09 and S13 formed a closely associated pair and subsequently clustered with S06. The three sites belonged to groups B, D, and A, respectively, and shared relatively high Cu and As concentrations. S01 and S02 in group A formed another branch, characterized by relatively high Cr and low As concentrations. S14 and S15 belonged to groups D and E, respectively, and had relatively low concentrations of several elements within this dataset.
Figure 3:Multi-element dendrogram and heatmap for the 16 sampling sites. Red and blue indicate values above and below the mean log-transformed concentration of the respective element. Gray × symbols indicate values below the detection limit.
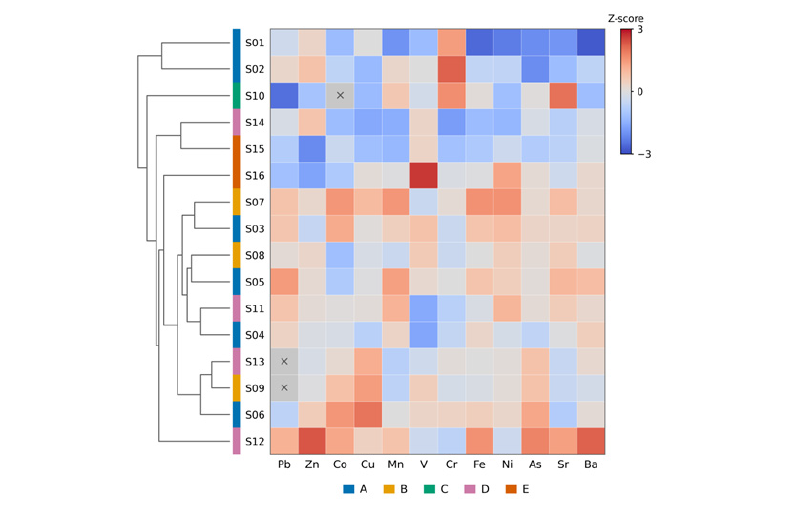
S12 had elevated values for Zn, As, Ba, and several other variables, whereas S10 was characterized by higher Sr and Cr and lower Pb and some other elements. Within group E, S16 differed from S15 in having a relatively high V concentration. Of the 66 inter-element tests, 20 pairs yielded unadjusted p<0.05, and all were positively correlated; eight pairs yielded q<0.05 after BH correction. Cu-As showed the strongest correlation (ρ=0.827, p=0.000164, q=0.010824). Other relatively strong correlations included Mn-Fe (ρ=0.783), Fe-Ba (ρ=0.753), Mn-Sr (ρ=0.753), Pb-Ba (ρ=0.745), Co- As (ρ=0.720), Fe-Sr (ρ=0.709), and Co-Cu (ρ=0.689) (Figure 4).
Figure 4:Spearman rank correlations between elements and between traffic distances and element concentrations. Cell values are ρ; *indicates p<0.05. Railway and Urban Road denote the shortest horizontal distances to railway and urban road centerlines, respectively.
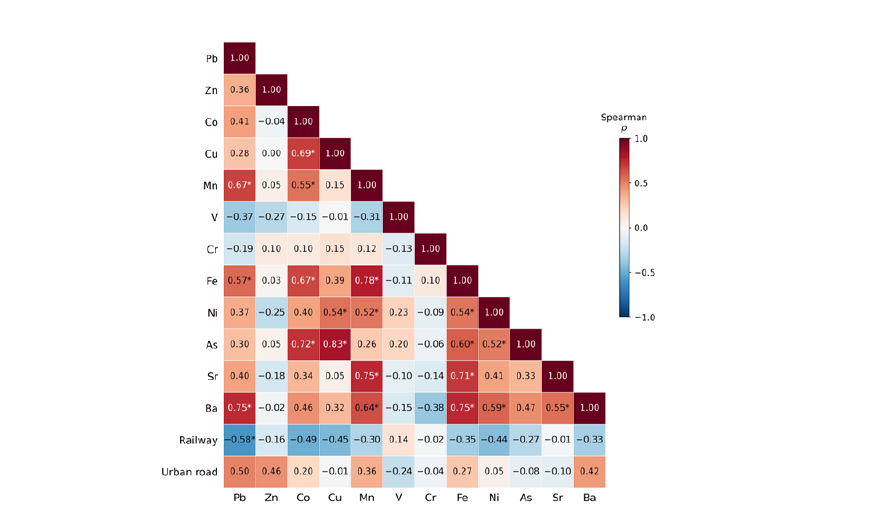
Distances from sampling sites to railways ranged from 0.07 to 345.95m, and distances to roads ranged from 1.77 to 390.10m. Among the 24 distance-element tests, only the correlation between railway distance and Pb yielded p<0.05 (ρ=−0.582, p=0.0314). Across the 14 sampling sites with valid Pb data, higher Pb concentrations generally tended to occur closer to railways. For example, S05 and S12, which were close to railways, had higher Pb concentrations, whereas S10, S15, and S16, which were farther from railways, had lower Pb concentrations. Railway distance was also negatively correlated with Co and Cu, while road distance was positively correlated with Pb and Zn; these correlations did not attain the p<0.05 level.
Discussion
Relative to the selected soil reference, Cu and Zn were elevated at all 16 sites, and Pb was elevated at 13 of the 14 sites with valid observations; As exceeded the reference only at S06, S09, S12, and S13. Within the current set of sites, the former pattern suggests that attention should be given to accumulation conditions shared by multiple locations, whereas the latter is more useful for guiding denser sampling at and around local high-concentration sites.
The co-occurrence of high Zn, As, and Ba concentrations at S12, high Cu at S06, high Co, Mn, Fe, and Ni at S07, and high Cr at S02 indicates that different sites have distinct elemental assemblages. In the clustering analysis, S09, S13, and S06 clustered together across environmental groups B, D, and A, whereas compositional differences also occurred within individual environmental groups. This indicates that classification by nearby facilities cannot fully capture the multi-element similarity among sites. Road dust can be influenced by the mixing of multiple inputs [2].
Studies of tire, brake, and railway wear provide evidence for potential input processes for elements such as Zn, Cu, Fe, and Mn [3-5], and recent reviews and studies of road and rail brake dust also show overlapping elemental characteristics among different wear materials [6,7]. The strong Cu-As correlation indicates similar rank-order variation in these two elements across the current sites. Correlations among Mn, Fe, Sr, and Ba may also reflect the mixing of various mineral-bearing particulate components. Zn, As, and Ba all reached their highest concentrations in this dataset at S12, but the rank correlations of Zn with As and Ba across all sites were both close to zero. This indicates that the co-occurrence of multiple elements at an individual site cannot be directly equated with covariation across the entire set of sites.
The Sr concentration at S10 was 519.02mg/kg, the highest value, while Cr was relatively high and Pb relatively low, giving this site an elemental assemblage distinct from those at other industrial- traffic sites. Research has shown that Sr²⁺ can be incorporated into the crystal structure of calcite [13]. S10 is located on a road used by vehicles serving the chalk quarry; the input of Sr-bearing carbonate particles into dust during extraction and transport is a possible explanation for its elevated Sr concentration. The negative association between railway distance and Pb suggests that areas near railways warrant particular attention in subsequent monitoring. Proximity to railways may also covary with industrial facilities, surface materials, and historical contamination. Giordano et al. [14] in their study of the fine fraction of urban dust and Pb isotopes, showed that resuspension of contaminated soils can contribute to the redistribution of potentially toxic elements in dust [14].
Thus, technogenic dust in urban ecosystems is a significant source of pedogenic processes in cities, not only in quantitative terms, but also due to the special association of chemical elements that come from the atmosphere [15].
Conclusion
Differences in elemental concentrations among the investigated sites were element-specific. Cu, Zn, and Pb exceeded the selected forest soil reference at many sites, whereas relatively high As concentrations were concentrated at a small number of sites, indicating that widespread exceedance of the reference and localized high concentrations need to be identified separately.
Multi-element similarity did not show a one-to-one correspondence with the five environmental groups. Cu and As showed a significant positive correlation across sites. Railway distance showed a significant negative correlation with Pb.
References
- Goncharov NV, Prokofieva TV (2025) Ecological role of solid atmospheric deposition in urban ecosystems. In: Shoba SA, Kovaleva NO, Stolpnikova EM (Eds.), The role of soils in the biosphere and human life: Proceedings of the II International Scientific Conference. MAKS Press, Moscow, Russia, pp. 97-99.
- Wagner S, Funk CW, Müller K, Raithel DJ (2024) The chemical composition and sources of road dust, and of tire and road wear particles-A Review. Sci Total Environ 926: 171694.
- Councell TB, Duckenfield KU, Landa ER, Callender E (2004) Tire-wear particles as a source of zinc to the environment. Environ Sci Technol 38(15): 4206-4214.
- Wahlström J, Olander L, Olofsson U (2010) Size, shape, and elemental composition of airborne wear particles from disc brake materials. Tribol Lett 38(1): 15-24.
- Gehrig R, Hill M, Lienemann P, Zwicky CN, Bukowiecki N, et al. (2007) Contribution of railway traffic to local PM10 concentrations in Switzerland. Atmos Environ 41(5): 923-933.
- Fussell JC, Franklin M, Green DC, Gustafsson M, Harrison RM, et al. (2022) A review of road traffic-derived non-exhaust particles: Emissions, physicochemical characteristics, health risks, and mitigation measures. Environ Sci Technol 56(11): 6813-6835.
- Di Martino E, Massimi L, Zara A, Winkler A, Spagnuolo L, et al. (2026) Brake dust from vehicular and rail traffic: Assessment of elemental profiles, magnetic susceptibility, dispersion, contributions to soil contamination and health risks. Atmosphere 17(1): 114.
- Moskovchenko D, Pozhitkov R, Ukarkhanova D (2022) Geochemistry of street dust in Tyumen, Russia: Influence of traffic load. Environ Sci Pollut Res 29: 31180-31197.
- Ivaneev AI, Brzhezinskiy AS, Karandashev VK, Ermolin MS, Fedotov PS (2023) Assessment of sources, environmental, ecological, and health risks of potentially toxic elements in urban dust of Moscow megacity, Russia. Chemosphere 321: 138142.
- Lisetskii F, Pizhevskii N, Morabandza KB (2024) Features of heavy metal pollution of urban areas with special environmental risks. Environ Anal Eco Stud 12(3): 1451-1457.
- Gatina EL, Zinicovscaia I, Sannikov PY, Chetyrkina VV, Bronnikova PV, et al. (2026) Accumulation of potentially toxic elements from atmospheric deposition in mosses of the town of Gubakha. Geographical Bulletin 2(77): 117-132.
- Benjamini Y, Hochberg Y (1995) Controlling the false discovery rate: A practical and powerful approach to multiple testing. J R Stat Soc Series B 57(1): 289-300.
- Knight AW, Harvey JA, Shohel M, Lu P, Cummings D, et al. (2023) The combined effects of Mg²⁺ and Sr²⁺ incorporation during CaCO₃ precipitation and crystal growth. Geochim Cosmochim Acta 345: 16-33.
- Giordano A, Malandrino M, Ajmone MF, Padoan E (2024) Potentially toxic elements and lead isotopic signatures in the 10μm fraction of urban dust: Environmental risk enhanced by resuspension of contaminated soils. Environ Res 242: 117664.
- Lisetskii F (2022) Biogeochemical features of soil formation without parent rock in natural conditions and in an urban environment. IOP Conf Ser: Earth Environ Sci 1010: 012018.
© 2026 © Fedor Lisetskii This is an open access article distributed under the terms of the Creative Commons Attribution License , which permits unrestricted use, distribution, and build upon your work non-commercially.
Editor In Chief







.jpg)































Signup for Newsletter

Quick Links
 Editorial Board Registrations
 Submit your Article
 Best Paper of the Volume
 Reprints
 Refer a Friend
 Advertise With Us
Our Recent Edition





Top Editors




.jpg)

















.bmp)
.jpg)
.png)
.jpg)













.jpg)






.png)

.png)




.png)




Financial Support

Sponsors

Latest e-Books

Latest Video

 a Creative Commons Attribution 4.0 International License. Based on a work at www.crimsonpublishers.com.
Best viewed in

 | Above IE 9.0 version