
- About Us
- Information
-

The Author ensures that the research has been conducted responsibly and ethically with adherence to all relevant regulations. read more..
- For Authors
- For Reviewer
- Manuscript Guidelines
- Membership
- Publication Ethics
-
- Journals
- Reprints
- e-Books
- Videos
- Policies
- Contact Us
 COVID-19
- Submissions


Full Text
Degenerative Intellectual & Developmental Disabilities
Barriers to the Disabled Students’ Inclusion in Learning and Research Opportunities in Higher Educational Institutions in Kenya
Muhammad Qasim Rana1, Angela Lee1, Ruth Nduta Wanjau2, Lekan Damilola Ojo3*, Margaret K Mwenje4, Jackson W Muthengia5, Florence A Miima6 and Gabriel W Mwenjeri7
1 School of Construction, Surveying and Engineering, University of the Built Environment, UK
2 Department of Chemistry, Kenyatta University, Kenya
3 Department of Building and Real Estate, Hong Kong Polytechnic University, Hong Kong
4 Department of Social Sciences, Karatina University, Kenya
5 Department of Chemistry, University of Embu, Kenya
6 Department of Educational Communication and Technology, Kenyatta University, Kenya
7 Department of Agricultural Economics, Kenyatta University, Kenya
*Corresponding author: Lekan Damilola Ojo, Department of Building and Real Estate, Hong Kong Polytechnic University, Hung Hom, Hong Kong
Submission: January 08, 2026; Published: January 27, 2026
Volume2 Issue2 January 27, 2026
Abstract
The pursuit of disabled students’ inclusion in higher education remains a significant global concern, particularly in developing nations where systemic and institutional barriers persist. In Kenya, despite progressive legislative and policy frameworks promoting inclusive education, universities continue to encounter structural, financial and attitudinal challenges that hinder equal participation in learning and research for disabled students. This study aims to identify, analyze and prioritize the barriers, including physical, attitudinal, curriculum, political, communication, societal, financial, knowledge and institutional, affecting disabled students’ inclusion in learning and research opportunities in Kenyan higher education institutions. Employing quantitative research design, data was gathered through structured questionnaires distributed among disabled students in institutions of higher learning. The data were analyzed using the Fuzzy Synthetic Evaluation (FSE) approach, which integrates fuzzy logic with descriptive statistics to objectively determine the weight, level of agreement and internal consistency of the identified barriers. Among the nine barriers, financial constraints emerged as the most severe impediment, followed by knowledge and training barriers and institutional structures. The findings underscore that resource scarcity, insufficient professional development and weak administrative enforcement remain the foremost obstacles to achieving genuine inclusion in selected universities in Kenya. The study contributes theoretically by advancing the application of the FSE model within inclusion research, offering a rigorous, data-driven framework for understanding multidimensional social barriers.
Keywords:Fuzzy logic; Rigorous; Knowledge; FSE model; Mobility impairments; Exceedingly low
Introduction
According to the World Health Organization [1], about 1.3 billion people, equated to approximately 16% of the global population, are living with some form of disability. This marks a notable increase of 10% from the 1970s estimate [2], a rise that can be attributed to global population aging, the growing burden of non-communicable diseases and advancements in data collection and assessment techniques. Women, for instance, are more likely than men to experience disabilities, with nearly 20% of the global female population affected [3]. In nations where life expectancy exceeds 70 years, individuals typically spend around 11.5% of their lives with some level of disability [4]. Among males, the highest disability risk occurs in early adulthood (ages 20-29) and in old age (70+), whereas for females, the risk peaks during adolescence (15-19) and again in older age (60+) [5]. In Europe, disability affects 33% of individuals aged 16 and older, translating to around 101 million people [6]. Asia houses the largest number of disabled people, accounting for nearly 700 million individuals [7], driven largely by demographic aging and chronic health conditions. In North America, about 15% of the population, approximately 87 million people, live with disabilities [1]. In the United States alone, 28.7% of adults have some form of disability, and the highest rates (38.7%) are observed among American Indian/Alaska Native and multiracial groups [8]. In Latin America, around 15% of the population live with disabilities [1]. Meanwhile, the disability prevalence stands at approximately 4 million in Australia [1], out of which about 1.4 million people experience severe disability [9]. As of [10], Africa’s population is estimated at 1.55 billion, with approximately 15-16% of individuals with disability [1,10]. Within Sub-Saharan Africa, disability tends to be more in rural regions, where access to healthcare services is limited. Women in these areas face higher disability rates than men, influenced by insufficient maternal health services and domestic violence [11]. In Kenya, data from the 2019 National Census indicates that about 900,000 individuals have a disability, with higher rates reported among women [12]. However, figures from the 2009 census reported a significantly higher disability prevalence of about 4.44 million people, suggesting that the recent lower figures may reflect differences in measurement approaches rather than an actual decline [13]. The most prevalent types of disabilities in Kenya include mobility impairments (42%), visual impairments (36.4%) and cognitive disabilities that stand at 23% [14].
Despite widespread international commitments to the United Nations Convention on the Rights of Persons with Disabilities (CRPD) which mandates equal access to education for all individuals irrespective of their abilities, disabled people consistently encounter significant barriers within educational settings [1]. In the low- and middle-income countries, the promise of inclusive education remains largely unfulfilled due to deep-rooted barriers [11]. Globally, participation in higher education among individuals with disabilities remains critically low, with less than 10% reaching this academic level. In Latin America, the enrollment figures are especially modest, ranging between 2% and 5% [15]. The enrollment of disabled students in higher education institutions in Kenya remains exceedingly low, ranging between 1-3% [16]. While Kenya has taken progressive legislative steps, such as enacting the Persons with Disabilities Act (2003, revised 2025) and embedding provisions for equality in its 2010 Constitution, the lived realities of learners with disabilities in educational institutions expose persistent exclusion and underrepresentation, [17]. Despite the effort to advance inclusive society in the Kenyan educational sector, only 20% of public universities meet accessibility criteria [17]. Employment outcomes remain discouraging, as 4% of public agencies comply with the mandated 5% disabled employment quota and the unemployment rate among graduates with disabilities stands at a staggering 70% [17]. This underrepresentation underscores the systemic challenges that continue to impede equal access and participation. The barriers to inclusion are multifaceted, intersecting across physical, institutional, economic, and political domains [18-21]. This study therefore seeks to critically examine the key barriers that inhibit the full inclusion of disabled students in selected universities in Kenya. By highlighting these barriers, this study aims to inform targeted reforms and practical interventions that move beyond superficial commitments toward the realization of genuinely inclusive, equitable and empowering educational environments. Understanding these challenges is crucial for advocating for policy changes and amendment that align educational practices with principles empowering educational experiences for learners with disabilities.
Literature Review
Previous studies on barriers to the disabled people inclusion
Inclusive education is a fundamental human right and a cornerstone for achieving equitable development [15]. Despite global commitments to the United Nations Convention on the Rights of Persons with Disabilities (CRPD), which mandates equal access to education for all individuals regardless of ability [22], persons with disabilities continue to face significant barriers in educational settings. In developing countries, these barriers continue to limit participation of disabled learners, perpetuating cycles of exclusion and limited employment opportunities. Many educational buildings were constructed without considering the diverse needs of individuals with mobility impairments, visual impairments, or other physical disabilities [19] highlight that inadequate facilities and learning materials significantly impede inclusion. Many university buildings lack ramps or elevators, making navigation difficult for students with mobility impairments. The lack of Braille texts, large-print versions, audiobooks, or digitally accessible documents can severely limit a student’s ability to learn [23]. For students with visual impairments, unclear or missing directional signs could make navigating complex academic environments challenging [24]. Disabled students often face a bureaucratic, lengthy and emotionally taxing procedure to request and receive necessary physical accommodation [25,26]. The cumulative effect of these architectural flaws creates a sense of exclusion, limiting independent movement and participation in campus life beyond the classroom [19]. Beyond the tangible constraints of physical infrastructure, attitudinal barriers represent a profound and often more insidious challenge to the inclusion of individuals with disabilities in educational institutions. These barriers stem from negative perceptions, stereotypes and biases that shape how disability is understood and responded to [27]. Unlike physical obstacles that can be addressed through construction or modification, attitudinal barriers are often invisible yet deeply impactful [28]. According to [29], educators’ biases about the capabilities of disabled students often result in reduced academic opportunities. Disabled students may find it challenging to form friendships, participate in group activities, or feel a sense of belonging if their peers hold discriminatory views or are unwilling to interact with them [30]. Some parents of children with disabilities may hold overprotective attitudes, limiting their child’s independence and opportunities for integration [31-34] note that people often perceive disabled students as less competent, leading to dismissive or patronizing interactions.
An overly rigid or standardized curriculum, coupled with inflexible teaching methodologies, can inadvertently exclude students who require varied approaches to absorb and demonstrate their understanding [35]. Without a curriculum that is inherently flexible and responsive to these varied learning profiles, disabled students may struggle to fully comprehend material or effectively convey their knowledge [20]. According to [36], teachers often lack training in differentiated instruction, a key component of inclusive education. As a result, many teachers report feeling unprepared to modify lessons or assessments for disabled students [37]. The rigidity in traditional curricula can be problematic for students who learn at different rates [36]. While many nations have ratified international conventions advocating disability rights, the actual implementation at national and institutional levels frequently falls short [38]. Bureaucratic barriers often manifest complex administrative processes often impede access to education for disabled students [39]. In many countries, disability inclusion is treated as a peripheral issue, resulting in underfunded programs and slow policy execution [38,40]. Some laws lack enforceable mandates or fail to specify mechanisms for accountability and redress [41]. Inclusive education in national strategies may rarely be integrated into curriculum reform or teacher training policies [42]. Without targeted projects that focus on capacity building, infrastructure upgrades, curriculum adaptation and awareness campaigns, progress towards genuine inclusion remains slow [28]. Communication barriers arise when the methods, formats and channels of communication within learning environments are not accessible to all learners, leading to misunderstandings, exclusion from information and limited participation [43]. According to [44], the absence of tailored study materials contributes to lower academic engagement among disabled students. In higher education systems, students report that most course readings are in inaccessible formats, e.g., scanned PDFs or image-based content that screen readers cannot process, leading to loss of study time [45]. Without professional interpreters for the deaf and hardof- hearing, these students may be unable to fully comprehend lectures, participate in discussions, or engage with instructors and peers in real-time [46]. A study by [46] highlights that the high cost and time-intensive production of braille textbooks limit their availability, leaving visually impaired students reliant on oral instruction or inaccessible print materials.
A significant barrier is the pervasive lack of individualization in how educational systems and society approach disability at large [47]. Rather than recognizing the unique strengths, needs and learning styles of each student with a disability, there is often a tendency to categorize and generalize [48]. When the public, including parents and community members, lacks accurate information, it can foster misconceptions, fear and discomfort around disability [49], which are often shaped by limited knowledge [50]. Therefore, schools or workplaces require deliberate efforts to promote social integration, such as structured peer interaction programs [51]. The absence of genuine social connections can severely impact a student’s sense of belonging, self-esteem and overall well-being, potentially undermining their academic success and future integration into society [52]. Hence, awareness-raising among students to foster a culture of empathy, respect and genuine acceptance within the educational community that challenges prevailing societal biases is essential [53]. The economic burden associated with disability can also create a cycle of disadvantages, making it exceptionally challenging for disabled students to thrive academically [38]. Raising a child with a disability often incurs substantial additional costs, including specialized medical care, therapies, adaptive equipment, transportation and personal assistance [54]. Economic pressure can directly impact a child’s ability to access quality education, as families may struggle to afford school fees, or supplementary educational materials, especially in low-income settings [55]. The study of [56] highlights that the price of advanced assistive technologies, such as powered wheelchairs or augmentative communication devices is high. Even when partially subsidized, the expenses for maintenance, upgrades and specialized training for users and support staff add to the financial burden [19,57]. Hence, without sustained financial investment, institutions struggle to make necessary adaptations, which can compromise the quality of education for disabled students [38]. Effective inclusion of disabled students in educational settings requires well-informed and adequately trained educator [58].
Many teachers, particularly those trained in traditional pedagogical models, have not received adequate preparation to work with disabled students in mainstream settings [59]. For example, a teacher might not understand the specific communication needs of a student with autism, the impact of chronic health condition on attendance and energy levels, or the nuances of a specific learning disability that affects reading comprehension [60]. The lack of individualized knowledge can lead to inappropriate expectations, ineffective instructional strategies, and a failure to provide the precise support required for the student to succeed, ultimately hindering their academic progress and overall inclusion [61]. This lack of foundational training often leaves them feeling unprepared and overwhelmed by the diverse learning profiles present in inclusive classrooms [62]. Professional development opportunities, when available, may be infrequent, generic, or fail to address the practical skills needed for differentiated instruction, behavior management, or the use of assistive technologies for students with varying disabilities [56]. The absence of clear policies or centralized support systems can lead to inconsistent practices and reliance on personal judgment, which may not align with best practices in inclusive education [63]. Institutional barriers can significantly impede the ability of educational systems to provide equitable and inclusive education, particularly for students with special needs [21]. The lack of commitment can manifest in various ways, such as prioritizing cost-cutting over accessibility improvements or failing to integrate disabled people into the institution’s core mission and strategic planning [57]. Without a strong institutional ethos that values diversity and actively champions the rights and needs of all learners, efforts towards inclusion often remain superficial and ineffective [53]. Many countries and institutions have adopted legislation and guidelines aimed at promoting disabled students’ inclusion, but these often remain unenforced or are implemented inconsistently [18,64]. Similarly, while broader national laws may exist, individual institutions require detailed internal policies to guide their practices for disabled students [54,64].
Materials and Methods
Research design
This study utilized a quantitative research design to investigate the primary barriers hindering the inclusion of disabled students in selected universities in Kenya. A survey methodology was employed to gather structured and quantifiable data from a broad sample of respondents representing multiple universities. This method was particularly effective for identifying patterns, ranking the identified barriers and prioritizing their significance. Furthermore, the design facilitated the collection of empirical data suitable for analysis using Fuzzy Synthetic Evaluation (FSE) techniques, which offer an objective and systematic approach for interpreting complex, multidimensional information.
Questionnaire development and data collection
The questionnaire for this study was designed following an extensive review of existing literature on barriers to disabled students’ inclusion in higher education. From this review, thirtytwo distinct barriers were identified and grouped into nine major categories informed by prior research: physical (architectural), attitudinal, curriculum-related, communication, social, knowledge and training, institutional, financial and political/regulatory. Each item was rated on a five-point Likert scale ranging from 1 (strongly disagree) to 5 (strongly agree). To ensure the instrument’s clarity, relevance and contextual appropriateness, a pilot test was done among disabled students in universities that did not participate in the actual study. Additionally, seven experts in the subject matter also assessed content and face validity of the questionnaire. Their feedback informed minor revisions aimed at refining the language and removing potential ambiguities. Ethical approval for the study was obtained prior to data collection. Research permit was also obtained from National Commission for Science, Technology and Innovation (NACOSTI). Participants received detailed information outlining the study’s objectives, voluntary nature, confidentiality assurances and data protection procedures. Informed consent was secured before the commencement of the survey, and respondents were assured that their identities would remain anonymous and that the data would be used exclusively for academic purposes. Data collection was carried out between August and October 2025 through online methods across five public and private universities in Kenya. The survey specifically targeted disabled students to capture authentic perspectives and lived experiences regarding inclusive education policies. Recruitment was facilitated through multiple channels, including university disability support offices and academic research networks, to enhance reach and maximize participation.
Sampling strategy
To achieve representativeness, a purposive sampling technique was used. This method was suitable because it ensured participation from individuals with knowledge or experience of disabled students inclusion challenges in Kenyan higher education settings. Using Yamane’s formula at a 5% margin of error, the required sample size from population of 166 disabled students was calculated to be 117. A total of 94 responses were received, out of which 86 were valid and used for analysis, resulting in 73.5% of the computed sample size. The number of data collected satisfied central limit theorem recommending minimum of 30 sample size for data analysis. Additionally, the amount of data collected is sufficient for the intended statistical, i.e., FSE. The target group of respondents-disabled students-is a unique population to obtain large quantity of data for statistical analysis.
Methods of data analysis
The collected data was analyzed through a combination of descriptive statistics and fuzzy logic-based methodologies. Descriptive statistics, including frequency and percentage distributions, were used to summarize participants’ demographic and background characteristics. The internal reliability of the questionnaire was assessed using Cronbach’s alpha, while mean scores for each variable were computed in SPSS (Version 27). Subsequently, the FSE model was employed to measure the level of agreement among respondents regarding the identified barriers. Rooted in fuzzy set theory, the FSE approach is particularly effective for addressing uncertainty and subjectivity inherent in human judgments. It provides a structured and objective method for ranking complex social issues such as disabled students’ inclusion.
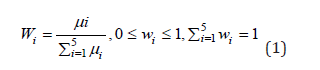
The FSE process involved four key stages: (i) constructing the evaluation index system based on the nine barrier categories; (ii) determining mean scores and Weights (W) for each variable to reflect their relative significance; (iii) formulating Membership Functions (MF) for each variable to quantify the extent to which they align with specific severity levels; and (iv) computing agreement indices to rank the barriers by their overall impact on disabled students inclusion. Formally, the evaluation index system was defined as U=(u1, u2, u3, u4, u5), representing the five causal domains, with sub-items within each domain denoted as u1= (u11, u12, ..., u1n). A rating scale V=(1, 2, 3, 4, 5) was established. In the second stage, item Weights (W) were calculated based on component factors and mean values (μ) according to the sequence of the rating scale, as specified by the relevant equations (1).
In the third stage of the FSE procedure, a Membership Function (MF) was developed for each variable associated with the identified causal factors. This process was based on the analysis of responses obtained through the five-point Likert scale. The membership function for each variable (denoted as mx) was computed using a predetermined equation that incorporated the percentage of respondents selecting each rating level (from 1 to 5). In this context, Pimx/Vi represents the proportion of responses that fall within a specific rating category for a given variable, while the expression Pimx/Vi illustrates the relationship between the response distribution and its corresponding scale value. This stage was crucial in transforming survey responses into quantitative fuzzy values, thereby offering a more refined representation of the relative significance of each variable.

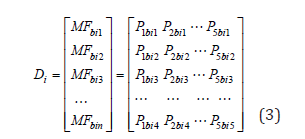
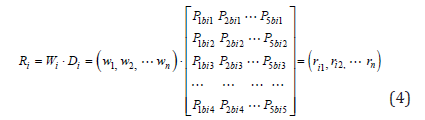
The comprehensive fuzzy value for each factor group was determined by constructing a fuzzy matrix (Ri) that incorporated the distinct membership functions corresponding to each item within that factor. The overall fuzzy vector (Di), representing the aggregate significance of the factor, was then derived by integrating this matrix with the respective weight indices. These calculations were performed using established fuzzy logic equations, as expressed in Equations (4) and (5), which define the relationships between Di and Ri.
The final step involved calculating the agreement index by multiplying the grade levels (V=1, 2, 3, 4, 5) with the fuzzy evaluation matrix (Ri). This enabled the ranking of the nine identified barriers based on their perceived levels of significance. This systematic and evidence-based method provided a clear assessment of the challenges facing the disabled students’ inclusion in learning and research opportunities in Kenyan higher education institutions.

Result
Table 1 summarizes the socio-demographic and institutional profile of the respondents, showing a broadly diverse cohort of disabled students across five Kenyan universities. The sample is majority male (58.1%), with females representing 37.2% and 4.7% preferring not to state gender. Age is concentrated among young adults: the largest group is 20-24 years (41.9%), followed by those aged 40 and above (18.6%) and smaller proportions in the less than 20, 25-29 and 30-39 bands. This age distribution indicates that the study captured the core undergraduate population as well as a notable older cohort, which can provide insight into both entrylevel and more mature student experiences. Postgraduate students constitute the largest single group (32%), while first- to fourth-year undergraduates are also well represented (first year 18.6%; second year 20.9%; third year 9.3%; fourth year 18.6%). Institutionally, responses were drawn from Kenyatta University (55.8%), substantive representation from University of Embu (27.9%) and smaller contributions from Karatina University, Masinde Muiiro and Zetech. The lower number of disabled students in some universities is because of structural barriers, whereby the Kenya Universities and College Central Placement Service (KUCCPS) usually place limited number of disabled students in those universities. The Table also shows a range of disability types among respondents: mobility impairments (32.6%) and visual impairments (30.2%) are the most common, with smaller numbers reporting multiple disabilities, emotional/behavioral conditions, intellectual or chronic health conditions, autism spectrum disorders and speech/ language impairments. This mix underscores that the barriers explored in the study must be interpreted as affecting students with diverse and sometimes overlapping needs, reinforcing the study’s focus on multi-dimensional, flexible inclusion rather than singleissue remedies. Table 2 illustrates the availability of disabilityfriendly infrastructure across the surveyed Kenyan universities. A majority of the respondents reported the presence of ramps (67.4%) and elevators in their institutions (60.5%), indicating partial compliance with accessibility standards for students with mobility impairments. However, only 44.2% confirmed to having wide doorways and 20.9% were provided with tactile pathways for visually impaired users, demonstrating limited attention to inclusive spatial navigation. In terms of learning and living environments, only 32.6% of respondents indicated the existence of inclusive dormitories and quiet study rooms, while 30.2% acknowledged the presence of disability resource centers and flexible exam rooms. E-learning platforms were reported by 41.9% of respondents, but only 4.7% confirmed that institutional websites were WCAGcompliant, highlighting major gaps in digital accessibility. Other essential facilities such as Braille signage (14%), auditory cues (9.3%) and hearing loops (7%) were scarcely available, signaling severe barriers for students with sensory disabilities. The inconsistency in infrastructural provisions suggests that Kenyan universities still operate below the universal design standards required for full participation of disabled students.
Table 1:Background information of respondents.

Table 2:Background information of respondents.

Table 3 reveals varying levels of awareness of respondents regarding key disability-inclusive policies in Kenya. The most widely recognized policy is the Persons with Disabilities Act [59], with 39.5% of respondents indicating familiarity. This suggests that the Act, being the oldest and most established legislative framework, has had greater visibility and institutional integration over time. Following this, 23.3% of the respondents reported awareness of the National Disability Inclusion Policy [17], a relatively recent policy. A notable 20.9% of respondents demonstrated awareness of both the [17,59] Policy, indicating a growing but still limited understanding of the evolving legal landscape. Interestingly, only 9.3% of students were familiar with Building an Inclusive Kenya, a strategic initiative that appears to have minimal reach or recognition among the target population. Equally, just 9.3% of respondents were aware of all three policies, underscoring a critical gap in comprehensive policy literacy. Table 4 provides insight into undisclosed disabilities among students and the reasons behind their decision not to disclose. A few of the respondents (14%) indicated that they had undisclosed disabilities, including hypermetropia, skin conditions, non-severe polio, mild autism, emotional and behavioral disabilities and amelia. This low frequency suggests that nondisclosure is not concentrated around a particular disability type but rather reflects individual circumstances and perceptions. The reasons for non-disclosure, however, reveal deeper systemic and psychological barriers. The most cited reason was concern about career progression, mentioned by 53.5% of respondents. Privacy or personal choice and lack of workplace or institutional support were both indicated by 44.2%, suggesting that some students prefer to keep their disability status confidential or feel unsupported by their institutions. Stigma and stereotypes were reported by 41.9%, and fear of discrimination and uncertainty about how to disclose were each indicated by 39.5% of respondents. These findings underscore the need for universities to foster an environment where students feel safe to disclose their disabilities without fear of negative consequences.
Table 3:Awareness of disability inclusive policies.

Table 4:Types of undisclosed disabilities of the respondents and reasons for not disclosing.

The descriptive analysis in Table 5 shows the nine groups of barriers hindering the inclusion of disabled students in learning and research opportunities in higher education institutions. Each barrier category consists of several specific items with corresponding codes for easy representation. In the overall opinions of the respondents, the most critical issue for physical (architectural) barriers is the lack of adequate facilities (PAB1, M=3.14), indicating that infrastructural limitations such as ramps, elevators and accessible restrooms remain a key concern. Within the attitudinal barriers, misconceptions about disabilities (ATB5, M=3.26) stand out as the most significant. The curriculum barriers are most influenced by types of course and instructors (CUB3, M=3.28), meanwhile in the political (regulatory) barriers, bureaucratic barriers (PRB1, M=3.09) are the most critical, reflecting the inadequacy or weak enforcement of disability-related policies and institutional accountability. Among communication barriers, limited availability of sign language interpreters and braille materials (COB2, M=3.19) ranks highest, meanwhile, the societal barriers are led by peer exclusion (SOB4, M=3.16), revealing persistent social isolation and exclusionary norms that affect students’ sense of belonging. For financial barriers, financial difficulty of families with children with disabilities (FIB1, M=3.93) is the most notable, underscoring the economic burden and lack of adequate funding support. Within the knowledge and training barriers, insufficient training and professional development for educators (KTB1, M=3.72) emerges as the most critical, indicating that many staff members lack the skills and knowledge to support inclusive learning environments. Lastly, regarding institutional barriers, lack of enforcement of relevant policies (INB2, M=3.35) represents the most impactful factor. Overall, the findings reveal that the most pressing challenges to inclusion are rooted not only in financial and infrastructural constraints but also in institutional readiness, staff training, and the broader cultural attitudes.
Table 5:Background information of respondents.

Mean, weighting, internal consistency and membership functions
Table 6 presents the computed mean scores, weight values, group means, internal reliability and fuzzy Membership Functions (MFs) for the nine categories of barriers. Attitudinal barriers also recorded the highest group mean of 14.44 and reliability α=0.878, reflecting persistent negative attitudes and stereotypes toward disability among peers and faculty, though with more variability across individual items. The knowledge and training barriers emerged with a group mean of 14.28 and a reliability coefficient (α=0.961). The fifth-element membership value (0.349, KTB1) is notably high, showing that respondents overwhelmingly perceive inadequate staff training and professional development as belonging to the most severe barrier level. Following closely are institutional barriers, with a group mean of 13.15 and α=0.961, indicating excellent internal consistency and strong respondent agreement. The high fifth-level MF values (0.302 for INB2 and INB3) suggest that weak policy enforcement, poor administrative coordination and insufficient leadership commitment represent systemic impediments to inclusion. The financial barrier group (group mean=11.70, α=0.904) also stands out due to the high mean scores (FIB1-FIB3≈3.9), indicating consensus that financial hardship among disabled students and their families is a major constraint to equitable participation. Meanwhile, societal barriers (group mean=11.93, α=0.876) and communication barriers (group mean=9.05, α=0.798) exhibit strong internal consistency but moderate membership values, suggesting that social exclusion and limited access to accessible communication resources persist across campuses. Conversely, curriculum barriers (group mean=9.68, α=0.873) and physical barriers (group mean=8.93, α=0.819) rank lowest, though they remain important areas of concern. Overall, the Cronbach’s alpha values (α≈0.80–0.96) across most groups confirm high internal reliability, while the fuzzy membership patterns show strong alignment between respondents’ perceptions and the severity hierarchy of barriers.
Table 6:Mean score, internal consistency and membership functions of disabled students’ inclusion in Kenyan higher education institutions. Note: Wv=Weighting of each barrier, Wv=Weighting of group of barriers.

Agreement index on the barriers
Table 7 presents the agreement index for nine categories of barriers to disabled students’ inclusion in learning and research opportunities in higher education institutions. The most critical barrier identified was financial constraints (FIB), with an agreement index of 3.900, indicating strong consensus among respondents that economic limitations, such as the cost of assistive technologies and lack of funding, pose the greatest challenge to inclusion. This was followed by Knowledge and Training Barriers (KTB), with an index of 3.575, reflecting concerns about insufficient staff training and awareness in handling diverse learning needs. Institutional Barriers (INB) ranked third at 3.348, suggesting that weak administrative structures and limited leadership commitment significantly hinder inclusive practices. Curriculum Barriers (CUB) came fourth with an index of 3.226, highlighting the rigidity of course content and teaching methods that fail to accommodate varied learning styles. Communication Barriers (COB) followed closely at 3.057, pointing to issues such as inaccessible learning materials and lack of interpreters. Political and Regulatory Barriers (PRB) were ranked sixth with an index of 3.021, indicating that bureaucratic inefficiencies and weak enforcement of disability policies continue to obstruct progress. Societal Barriers (SOB) scored 2.991, reflecting the impact of peer exclusion and prevailing social misconceptions. Physical (architectural) Barriers (PAB) were rated eighth at 2.981, suggesting that infrastructural limitations, while still relevant, are perceived as less severe than other systemic issues. Lastly, Attitudinal Barriers (ATB) received the lowest agreement index of 2.908, indicating that although negative perceptions and stereotypes persist, they are considered less obstructive compared to financial, institutional and trainingrelated challenges. Overall, the findings emphasize that resource scarcity, professional capacity and institutional readiness are the most pressing concerns in achieving genuine disabled students’ inclusion in Kenyan universities.
Table 7:Agreement index of barriers to disabled students’ inclusion in learning and research opportunities.

Discussion
Financial barriers
The FSE results identify Financial Barriers (FIB) as the most significant obstacle to disabled students’ inclusion in learning and research opportunities in Kenyan higher education institutions, with the highest agreement index (3.90). The findings reveal that both students with disabilities (FIB1 and FIB2) and institutions (FIB3) face severe financial challenges that limit access, participation and equity. In Kenya, where universities operate under constrained financial conditions, inclusion-related costs-such as sign language interpretation, Braille transcription and assistive technologiesare rarely prioritized in institutional budgets. These findings correspond with [19], who found that insufficient funding in Spanish universities reduced both academic performance and the sense of belonging among disabled students. Likewise, [65] concluded that inadequate funding was the single greatest constraint preventing South African universities from implementing inclusive education frameworks effectively. These global parallels affirm that financial inadequacy is a universal challenge in realizing inclusive higher education. Overall, the dominance of financial barriers underscores that economic constraints remain the most influential determinant of exclusion of disabled students in learning and research opportunities in universities.
Knowledge and training barriers
The FSE analysis ranks Knowledge and Training Barriers (KTB) as the second most significant challenge to disabled students’ inclusion in Kenyan higher education institutions, with an agreement index of 3.575 (Table 7). The mean values recorded for this group, KTB1 (3.72), KTB2 (3.56), KTB3 (3.49) and KTB4 (3.51), all exceed the midpoint of the scale, indicating strong respondent agreement that inadequate training and professional knowledge among educators remain major impediments see (Table 5). The results revealed that educators and administrators in Kenyan universities often lack sufficient training to effectively support disabled students. These findings align with the observations of [58] who reported that teacher competence and preparedness are decisive factors in achieving meaningful inclusion. The absence of structured training for lecturers (KTB1) on inclusive education in Kenya exacerbates this barrier. Many faculty members continue to employ traditional teaching methods that fail to accommodate students with sensory, physical, or learning impairments. In reality, the traditional method cannot provide a practical means to enable disabled students engage in research opportunities easily. This outcome mirrors evidence from Australia, where [66] found that teachers’ limited training exposure constrained the implementation of inclusive practices.
Institutional barriers
According to the FSE analysis, institutional barriers rank third in significance (Table 7). The findings reveal enduring challenges related to policy implementation, governance structures and administrative responsiveness. Participants highlighted that the absence of well-defined institutional policies, limited leadership commitment and inadequate monitoring mechanisms continue to undermine inclusive education practices across universities. These findings are consistent with [39], who reported that bureaucratic rigidity and fragmented administrative accountability remain barriers to accessibility within U.K. universities. Comparable evidence from the Kenyan context by [67], points to weak institutional coordination and poor follow-up on policy execution as key contributors to limited accessibility outcomes. Conclusively, the FSE results emphasize that structural and administrative inefficiencies remain among the most persistent challenges to equitable inclusion of disabled students in learning and research opportunities in Kenyan universities.
Curriculum barriers
The FSE results rank Curriculum Barriers (CUB) as the fourth most significant challenge to disabled students’ inclusion in learning and research opportunities in Kenyan higher education institutions (Table 7). This study highlighted that the rigidity of course content, uniform assessment criteria and limited flexibility in teaching approaches reduce opportunities for meaningful participation of disabled students. In many universities, the curriculum continues to be designed with a one-size-fits-all approach, offering little accommodation for diverse learning needs. This rigidity is particularly evident in technical and laboratory-based courses, where adaptive learning materials and inclusive instructional design are rarely applied. Globally, similar outcomes have been reported. [35] argue that inclusive education requires curriculum transformation rather than adaptation, while [61] found that in Spanish universities, the dominance of standardized syllabi often marginalizes disabled students.
Communication barriers
Communication barriers ranked as the fifth group of barriers to disabled students’ inclusion in the FSE results (Table 7). The research identified that the lack of sign language interpreters, limited Braille or audio-transcribed materials and inaccessible digital platforms severely restrict participation in both academic and social contexts. The findings illustrate that communication barriers are among the systemic challenges to disabled students’ inclusion in learning and research opportunities in Kenyan higher education. [68] Similarly observed that students with visual and hearing impairments often experience marginalization were information delivery lacks inclusiveness. Similarly, a recent study by [69] at rural South African universities found that entrenched societal attitudes and limited community awareness significantly hinder the full participation of disabled students. Despite efforts by some Kenyan institutions to provide disability support services, communication accessibility remains inconsistent. Many universities lack standardized communication protocols or fail to integrate assistive technology into learning systems. Consequently, disabled students often rely on peers or ad hoc institutional interventions to access learning materials. In essence, communication exclusion translates directly into academic learning and research opportunities exclusion.
Policy barriers
Political and regulatory barriers ranked sixth in the FSE results (Table 7). In particular, bureaucratic inefficiency (PRB1) and policy implementation gaps (PRB2) emerged as the most pressing challenges. Respondents expressed concern that while Kenya has enacted progressive disability legislation, such as the Persons with Disabilities Act (2003, revised 2025) and the National Disability Inclusion Policy (2024), implementation remains inconsistent and poorly monitored. This outcome is consistent with recent findings showing that when legal frameworks exist without robust enforcement, much of the declared commitment to inclusion becomes nominal. A study by [70] in Southeast Asia found that ambiguous legislation and weak monitoring systems rendered inclusive education policies largely ineffective. In the Kenyan context, the pattern is echoed by [68], who highlight that while inclusive education policies exist across universities, the day-to-day execution remains inconsistent due to weak institutional tracking and follow-up.
Societal barriers
The FSE results identify Societal Barriers (SOB) as the seventhranked obstacle to disabled students’ inclusion in learning and research opportunities in Kenyan higher education institutions (Table 7). This finding highlighted that pervasive societal stigma continues to shape the experiences of disabled students. Many learners reported feeling underestimated or excluded due to enduring stereotypes that equate disability with dependency or incapacity. Comparable evidence from other contexts reinforces this pattern. In South Africa, Mashiyi, Meda and [69] noted that negative community attitudes and inadequate advocacy programs hinder the social inclusion of disabled students in higher education. While legislative and institutional reforms are necessary, they cannot succeed in isolation from broader societal change.
Physical (architectural) barriers
Physical or architectural barriers ranked eighth in the FSE results (Table 7). The rank confirms some universities have made commendable structural improvements (Table 2), while some physically restrictive and poorly adapted for disabled students. Still exist [71] observed that many Kenyan public universities have not yet aligned their construction policies with universal design standards, resulting in partial or symbolic compliance. Globally, these findings correspond with those of [19], who reported that universities in Spain often focus on minimal legal compliance rather than holistic accessibility, creating learning environments that are formally open but practically exclusionary. Although infrastructural improvements have been made in select universities, progress is uneven and often limited.
Attitudinal barriers
Attitudinal barriers, which represent a deeply ingrained and multifaceted challenge, occupy the ninth and lowest rank in the FSE results (Table 7). These findings reflect that subtle prejudice; misconceptions and low expectations directed toward disabled students within university environments is low compared to other groups of barriers. Although attitudinal barriers ranked the least in the FSE results, there may be indication of some unwholesome attitudes to disabled students. Based on the 12 respondents who indicated undisclosed disabilities and the more than 30 students who expressed fear of discrimination or stigma if they disclosed additional disabilities (Table 4), it can be deduced that concerns about disclosure may remain significant.
Recommendations and Implications
Recommendations
Drawing from the study’s findings, higher education institutions in Kenya should prioritize expanding and stabilizing financial support mechanisms, including scholarships, inclusive bursaries and funding for assistive technologies, to lessen the economic strain faced by disabled students. Universities, in collaboration with the Ministry of Education and private partners, should establish dedicated inclusion funds and integrate disability-related expenses into their regular budgets. Simultaneously, continuous professional development for academic and administrative staff must be institutionalized to enhance understanding of inclusive pedagogy, accessibility frameworks and assistive technology use. Furthermore, institutional and policy reforms are critical to bridge the gap between national disability legislation and actual implementation in universities. Institutions should develop and enforce inclusion policies that emphasize accountability, transparency and measurable outcomes, supported by active disability support offices and clear monitoring frameworks. Finally, universities should strengthen communication, curriculum and physical accessibility systems to guarantee equal participation. Sign language interpretation, captioning, accessible digital platforms and Braille or audio materials should be standard features of teaching and administration. Curriculum reform should embed Universal Design for Learning principles to allow flexibility in teaching and assessment, while awareness and advocacy programs must address persistent attitudinal and societal biases. Regular accessibility audits of lecture halls, libraries and hostels are also essential to ensure compliance with universal design standards. Together, these coordinated interventions will enable Kenyan universities to move from policy aspiration to practical realization of inclusive, equitable and accessible higher education for all learners.
Theoretical contributions
This study advances theoretical understanding of disabled students’ inclusion in higher education by extending the application of the FSE approach to the Kenyan context which provides a robust, data-driven framework for quantifying the relative significance and interdependence of multiple barriers to inclusion. Through the identification of weighted barriers and agreement indices, the research reveals that inclusion operates as a dynamic system influenced by multiple overlapping forces rather than a single determinant. The study also enriches theoretical discourse by linking the Fuzzy framework to inclusion research, thereby filling a methodological gap in higher education studies within Sub-Saharan Africa [72]. By demonstrating how fuzzy logic can be applied to rank, interpret and visualize human perceptions of exclusion, the research contributes to the evolution of analytical models that bridge social science and computational reasoning. Theoretically, it underscores that inclusive education is not only a moral or legislative pursuit but a quantifiable dimension of institutional equity, requiring evidence-based strategies that integrate social and structural reforms [73].
Managerial implications
Disabled students’ inclusion should be elevated from a peripheral concern to a core strategic priority within Kenyan higher education institutions [74,75]. University administrators and policymakers must embed inclusion objectives into institutional missions, strategic plans and budgeting frameworks. Continuous professional development for staff should be institutionalized, and performance evaluations should reward inclusive practices and innovations in teaching and administration. Comprehensive monitoring and evaluation mechanisms grounded in FSE principles should be developed by universities for effective implementations. Regular assessments of institutional progress can provide evidence-based feedback for management, enabling adaptive policy responses and resource reallocation where necessary. Additionally, inclusion efforts must extend beyond compliance to embrace collaboration and innovation. Universities should partner with Disabled Persons’ Organizations (DPOs), Non-Governmental Organizations (NGOs) and the private sector to enhance service delivery, share expertise and mobilize resources [76]. Strategically, sustained inclusion will position Kenyan universities as regional leaders in accessible and equitable higher education, aligned with both national development agendas and global disabled students’ inclusion frameworks.
Conclusion
The inclusion of disabled people in higher education continues to pose a major global challenge. Despite the progress achieved through international frameworks such as the United Nations Convention on the Rights of Persons with Disabilities (CRPD) and Sustainable Development Goal 4 (SDG 4), many universities still struggle with institutional, structural and social barriers that impede equal participation. Issues such as inaccessible facilities, insufficient staff preparation, weak institutional governance and entrenched social attitudes persist, undermining efforts to achieve inclusive education. In Kenya, the situation mirrors these global patterns [77]. Although national policies and legal frameworks supporting inclusion exist, their implementation within universities remains fragmented and inconsistent. Consequently, this study sought to identify and analyze the key barriers hindering disabled students’ inclusion in Kenyan higher education institutions, using a systematic and evidence-based approach. Employing the FSE method, the study examined nine categories of barriers: financial, knowledge and training, institutional, policy and regulatory, curriculum, communication, societal, physical (architectural) and attitudinal barriers. The integration of fuzzy logic with descriptive analysis provided a structured framework for assessing both the degree of significance and the consensus among respondents regarding each barrier. The findings revealed that financial barriers ranked as the most critical obstacle (agreement index=3.900), followed by knowledge and training barriers (3.575) and institutional barriers (3.348). These results highlight the centrality of inadequate funding, limited staff competence and weak institutional structures in perpetuating exclusion. Midranked barriers such as policy and regulatory (3.021), curriculum (3.226) and communication barriers (3.057) further hinder inclusive practices, while societal, physical and attitudinal barriers continue to reinforce inequality through cultural misconceptions, infrastructural limitations and low disability awareness. awareness of disability rights [78]. Future research should broaden this inquiry through comparative and longitudinal studies that examine the long-term impact of inclusion initiatives and the evolving role of assistive technologies in transforming higher education. In conclusion, this study demonstrates that achieving meaningful disabled students’ inclusion in Kenyan higher education requires a systemic and multidimensional approach. Universities must prioritize sustainable financing, professional capacity development and policy enforcement as the foundation of inclusive reform. Efforts must also extend beyond physical accessibility to address deeper cultural and attitudinal transformations that shape institutional behavior and campus life. By adopting the recommendations outlined in this study, Kenyan universities can move toward genuine educational equity.
Author Contributions
Conceptualization, M.Q.R. and A.L.; methodology, M.Q.R. and A.L.; software, L.D.O.; validation, M.Q.R., A.L., R. N. W., M. K. M., and J. W. M.; formal analysis, L.D.O.; investigation, M.Q.R., A.L., R. N. W., M. K. M., J. W. M., and L. D. O.; resources, M.Q.R., A.L., R. N. W., M. K. M., J. W. M., and L. D. O.; data curation, M.Q.R., A.L., and R. N. W.; writing-original draft preparation, L.D.O.; writing-review and editing, M.Q.R., A.L., and R.N.W.; visualization, M.Q.R., A.L., R. N. W., M. K. M., and J. W. M.; supervision, M.Q.R., A.L., and M. K. M.; project administration, M.Q.R., A.L., R. N. W., M. K. M., J. W. M., and L. D. O.; funding acquisition, M.Q.R.
Funding
This research was funded by British Council, grant number DIP2024-019” and “The APC was funded by British Council.
Institutional Review Board Statement
The study was conducted in accordance with the Declaration of Helsinki and approved by the Ethics Committee of University of Built Environment, UK and National Commission for Science, Technology and Innovation (NACOSTI) on 15 May 2025 and 1 August 2025, respectively.
Informed Consent Statement
Informed consent was obtained from all participants involved in the study.
Data Availability Statement
The data used and/or analyzed during the study are available from the corresponding authors on reasonable request.
Disability Language/Terminology Positionality Statement
The authorship team comprises researchers and educators with both prior and ongoing research interests in equity, gender equality and disabled students’ inclusion. The participants in our study exhibit a strong preference for identity-first language. Consequently, we have decided to employ identity-first language consistently throughout the manuscript. We acknowledge the voluntary contributions of the study participants and express our respect for their diverse opinions, beliefs and experiences. We endeavored to ensure that all study participants were treated with appropriate consideration, dignity, equality, fairness and autonomy and we sought their informed consent prior to their participation in the study. These factors influenced our worldviews, shaped our understanding of others’ perspectives, guided how we conducted our study and determined how we engaged with study participants.”
References
- World Health Organization (2023) Global report on health equity for persons with disabilities.
- Kaye HS (1996) Trends in disability rates in the United States, 1970-1994 (No. 17). US Department of Education, National Institute on Disability and Rehabilitation Research (NIDRR).
- Wheaton FV, Crimmins EM (2016) Female disability disadvantage: A global perspective on sex differences in physical function and disability. Ageing & Society 36(6): 1136-1156.
- Disabled World (2025) Disability statistics: Information, charts, graphs and tables.
- World Health Organization (2025) Global report on disability.
- Eurostat (2025) Population with disability.
- World Health Organization (2021) Disability and health in Asia.
- Centers for Disease Control and Prevention (2025) Disability and health overview.
- Australian Bureau of Statistics (2019) Disability, ageing and carers, Australia: Summary of findings.
- World Population Review (2025) Africa population 2025.
- World Bank (2022a) Disability inclusion in Sub-Saharan Africa.
- Kenya Disability Resource (2022) Disability in Kenya: Facts and figures.
- Mobility International USA (2023) Disability in Kenya: Data and challenges.
- United Nations Population Fund Kenya (2023) Disability prevalence and types in Kenya.
- United Nations Educational, Scientific and Cultural Organization (2020) Global education monitoring report 2020: Inclusion and education.
- United Nations Development Programme (2024) Disability inclusion in Kenyan higher education.
- National Council for Persons with Disabilities (2024) Annual report on disability inclusion in Kenya.
- Degener T (2017) 10 years of convention on the rights of persons with disabilities. Netherlands Quarterly of Human Rights 35(3): 152-157.
- Moriña A, Morgado B (2018) University surroundings and infrastructures that are accessible and inclusive for all: listening to students with disabilities. Journal of Further and Higher Education 42(1): 13-23.
- Mugambi MM (2017) Approaches to inclusive education and implications for curriculum theory and practice. International Journal of Humanities Social Sciences and Education 10(4): 92-106.
- Williams JL, Pazey B, Shelby L, Yates JR (2013) The enemy among us: Do school administrators perceive students with disabilities as a threat? NASSP Bulletin, 97(2): 139-165.
- MacKay D (2006) The United Nations Convention on the rights of persons with disabilities. Syracuse J Int'l L & Com 34: 323.
- Nganji JT, Brayshaw M (2015) Personalizing learning materials for students with multiple disabilities in virtual learning environments. Science and Information Conference pp. 69-76.
- Arditi A (2017) Rethinking ADA signage standards for low-vision accessibility. Journal of Vision 17(5): 8-18.
- Toutain C (2019) Barriers to accommodations for students with disabilities in higher education: A literature review. Journal of Postsecondary Education and Disability 32(3): 297-310.
- Marshak L, Van Wieren T, Ferrell DR, Swiss L, Dugan C (2010) Exploring barriers to college student use of disability services and accommodations. Journal of Postsecondary Education and disability 22(3): 151-165.
- Lalvani P, Broderick AA, Fine M, Jacobowitz T, Michelli N (2015) Teacher education, in exclusion, and the implicit ideology of separate but equal: An invitation to a dialogue. Education, Citizenship and Social Justice 10(2): 168-183.
- Sharma N, Yadav VP, Sharma A (2021) Attitudes and empathy of youth towards physically disabled persons. Heliyon 7(8): e07852.
- Avramidis E, Norwich B (2003) Promoting inclusive education: A review of literature on teachers’ attitudes towards integration and inclusion. Learning to read critically in teaching and learning. London: Sage pp. 201-222.
- Lindsay S, McPherson AC (2012) Experiences of social exclusion and bullying at school among children and youth with cerebral palsy. Disability and Rehabilitation 34(2): 101-109.
- Holmbeck GN, Johnson SZ, Wills KE, McKernon W, Rose B, et al. (2002) Observed and perceived parental overprotection in relation to psychosocial adjustment in preadolescents with a physical disability: The mediational role of behavioral autonomy. Journal of Consulting and Clinical Psychology 70(1): 96-110.
- Gasteiger-Klicpera B, Klicpera C, Gebhardt M, Schwab S (2013) Attitudes and experiences of parents regarding inclusive and special school education for children with learning and intellectual disabilities. International Journal of Inclusive Education 17(7): 663-681.
- Shpigelman CN, Mor S, Sachs D, Schreuer N (2022) Supporting the development of students with disabilities in higher education: Access, stigma, identity, and power. Studies in Higher Education 47(9): 1776-1791.
- Smart J (2018) Disability definitions, diagnoses and practice implications: An introduction for counselors. Routledge (1st edn), England, p. 438.
- Ainscow M, Miles S (2008) Making education for all inclusive: Where next? Prospects 38(1): 15-34.
- Chu MW, Craig HL, Yeworiew LB, Xu Y (2020) Teachers’ unpreparedness to accommodate student needs. Canadian Journal of School Psychology 35(3): 210-224.
- Scruggs TE, Mastropieri MA (2017) Making inclusion work with co-teaching. Teaching Exceptional Children 49(4): 284-293.
- World Bank (2022b) Disabled students’ inclusion and accountability framework.
- Fitzgerald H (2018) Disability and barriers to inclusion. In the Palgrave handbook of paralympic studies. London: Palgrave Macmillan UK, pp. 55-70.
- Kozimjonov A, Dybina OV, Dorofeeva GA, Talantbekov TT (2025) The inclusion of people with disabilities in higher education. University 4.0 and educational technology for sustainable development: Best practices and perspectives in Russia and Central Asia. Springer Nature, Singapore, pp. 105-113.
- Lang R, Kett M, Groce N, Trani JF (2011) Implementing the United Nations convention on the rights of persons with disabilities: principles, implications, practice and limitations. Alter 5(3): 206-220.
- Muthukrishna N, Engelbrecht P (2018) Decolonising inclusive education in lower income, Southern African educational contexts. South African Journal of Education 38(4): 1-11.
- Lister K, Coughlan T, Owen N (2020) Learning needs, barriers, differences and study requirements: How students identify as 'disabled'in higher education. Widening Participation and Lifelong Learning 22(1): 95-111.
- McLeskey J, Billingsley B, Ziegler D (2018) Using high-leverage practices in teacher preparation to reduce the research-to-practice gap in inclusive settings. Australasian Journal of Special and Inclusive Education 42(1): 3-16.
- Baguma R, Wolters MK (2021) Making virtual learning environments accessible to people with disabilities in universities in Uganda. Frontiers in Computer Science 3: 638275.
- Masuku KP, Khumalo G, Moroe N (2024) Barriers and facilitators to inclusive education for learners who are deafblind: A scoping review. Education Sciences 14(10): 1072.
- Lecomte U, De Los Ríos Berjillos A, Lethielleux L, Deroy X, Thenot M (2024) Social understanding of disability: determinants and levers for action. Behavioral Sciences 14(9): 733.
- Mittler P (2012) Working towards inclusive education: Social contexts. (1st edn), David Fulton Publishers, UK, p. 222.
- Scior K, Werner S (2015) Changing attitudes to learning disability: A review of the evidence.
- Olusanya BO, Kancherla V, Shaheen A, Ogbo FA, Davis AC (2022) Global and regional prevalence of disabilities among children and adolescents: Analysis of findings from global health databases. Frontiers in Public Health 10: 977453.
- Rath V (2022) Social engagement: Hearing the experiences of disabled students in higher education in Ireland. Frontiers in Education 7: 895392.
- Stepaniuk I (2019) Inclusive education in Eastern European countries: A current state and future directions. International Journal of Inclusive Education 23(3): 328-352.
- Florian L, Black-Hawkins K (2011) Exploring inclusive pedagogy. British Educational Research Journal 37(5): 813-828.
- Malinovskiy S, Shibanova E, Movkebayeva Z (2024) Barriers and facilitators of access to higher education in a weakly institutionalised context: Perceptions of disabled students. Disability & Society 39(9): 2258-2280.
- Chambers T, Bolton M, Sukhai MA (2013) Financial barriers for students with non-apparent disabilities within Canadian postsecondary education. Journal of Postsecondary Education and Disability 26(1): 53-66.
- Layton N, Bould E, Buchanan R, Bredin J, Callaway L (2022) Inclusive research in health, rehabilitation and assistive technology: Beyond the binary of the ‘researcher’and the ‘researched’. Social Sciences 11(6): 233.
- Burgstahler S, Russo-Gleicher RJ (2015) Applying universal design to address the needs of postsecondary students on the autism spectrum. Journal of Postsecondary Education and Disability 28(2): 199-212.
- Sharma U, Salend SJ (2016) Teaching assistants in inclusive classrooms: A systematic analysis of the international research. Australian Journal of Teacher Education 41(8): 118-134.
- Fletcher JM, Lyon GR, Fuchs LS, Barnes MA (2018) Learning disabilities: From identification to intervention. Guilford Publications, USA.
- Moriña A, Perera VH, Carballo R (2020) Training needs of academics on inclusive education and disability. Sage Open 10(3): 2158244020962758.
- Sharma U, Loreman T (2013) Teacher educator perspectives on systemic barriers to inclusive education: An international conversation. Bringing insider perspectives into inclusive teacher learning. Routledge, UK, pp. 168-177.
- Lombardi AR, Murray C, Gerdes H (2011) College faculty and inclusive instruction: Self-reported attitudes and actions pertaining to universal design. Journal of Diversity in Higher Education 4(4): 250-261.
- Sutton L (2022) Impact of IEP instruction to increase participation with high school students on the autism spectrum.
- Mittler P (2015) The UN convention on the rights of persons with disabilities: Implementing a paradigm shift. Journal of Policy and Practice in Intellectual Disabilities 12(2): 79-89.
- Makoelle TM (2012) The state of inclusive pedagogy in South Africa: A literature review. Journal of Sociology and Social Anthropology 3(2): 93-102.
- Forlin C, Chambers D (2017) Catering for diversity: Including learners with different abilities and needs in regular classrooms. In Life in schools and classrooms: Past, present and future. Springer, Singapore, pp. 555-571.
- Karanja DN, Musyoka-Kamere I, Wawire V (2021) Implementation of Inclusive Education Policy and Academic Participation of Students with Disabilities in Selected Public Universities in Kenya, Doctoral dissertation, Kenyatta University, Kenya.
- Hersh M, Mouroutsou S (2019) Learning technology and disability-Overcoming barriers to inclusion: Evidence from a multicountry study. British Journal of Educational Technology 50(6): 3329-3344.
- Swart A, Meda L, Mashiyi NF (2020) Lecturer conceptions of and approaches to decolonisation of curricula in higher education. South African Journal of Higher Education 34(2): 146-163.
- Khoiriyah U, Karwanto K, Setyowati S, Nursalim M, Khamidi A (2024) Analysis of inclusive education policy implementation in developing countries. EDUKASIA Journal Pendidikan Dan Pembelajaran 5(1): 851-858.
- Abuya EO, Githinji JW (2022) Inclusion of visually impaired and deaf students in universities in Kenya: A call for action. Washington International Law Journal 32(1): 1-46.
- Avramidis E, Toulia A, Tsihouridis C, Strogilos V (2019) Teachers’ attitudes towards inclusion and their self‐efficacy for inclusive practices as predictors of willingness to implement peer tutoring. Journal of Research in Special Educational Needs 19(s1): 49-59.
- Hanreddy A (2020) Alternate curricula as a barrier to inclusive education for students with intellectual disabilities. International Electronic Journal of Elementary Education 12(3): 235-247.
- Jeannis H, Goldberg M, Seelman K, Schmeler M, Cooper RA (2020) Barriers and facilitators to students with physical disabilities’ participation in academic laboratory spaces. Disability and Rehabilitation: Assistive Technology 15(2): 225-237.
- National Center for Education Statistics (2023) Students with disabilities in U.S. higher education.
- Nyamweya WK, Muchelule YM, Mwalili T (2024) Digital inclusion practices and technology accessibility performance for people with disabilities in tertiary education institutions in Nairobi County. International Academic Journal of Economics and Finance 4(1): 473-523.
- Shattuck PT, Roux AM, Hudson LE, Taylor JL, Maenner MJ, et al. (2012) Services for adults with an autism spectrum disorder. The Canadian Journal of Psychiatry 57(5): 284-291.
- World Vision (2023) Community-based disabled students inclusion programs in Nairobi.
© 2026 Lekan Damilola Ojo. This is an open access article distributed under the terms of the Creative Commons Attribution License , which permits unrestricted use, distribution, and build upon your work non-commercially.
Editor In Chief


.jpg)


Signup for Newsletter

Quick Links
 Editorial Board Registrations
 Submit your Article
 Refer a Friend
 Advertise With Us
Our Recent Edition

.jpg)


Top Editors


.jpg)


.bmp)
.jpg)
.png)
.jpg)


.jpg)


.png)

.png)


.png)


Financial Support

Sponsors

Latest e-Books

Latest Video

 a Creative Commons Attribution 4.0 International License. Based on a work at www.crimsonpublishers.com.
Best viewed in
a Creative Commons Attribution 4.0 International License. Based on a work at www.crimsonpublishers.com.
Best viewed in