
- About Us
- Information
-

The Author ensures that the research has been conducted responsibly and ethically with adherence to all relevant regulations. read more..
- For Authors
- For Reviewer
- Manuscript Guidelines
- Membership
- Publication Ethics
-
- Journals
- Reprints
- e-Books
- Videos
- Policies
- Contact Us
 COVID-19
- Submissions


Full Text
COJ Technical & Scientific Research
Economic Life of Ships and Condemnation Plan
Satyendra NC*
Indian Maritime University, Indian Statistical Institute, India
*Corresponding author:Satyendra Nath Chakrabartty, Indian Maritime University, Indian Statistical Institute, Flat 4B, Cleopatra, DC 258, Street No. 350, Action Area 1, New Town, Kolkata 700156, India
Submission: September 09, 2025:Published: December 02, 2025

Volume5 Issue5December 02, 2025
Abstract
Economic life of ships varies depending on types and sizes, maintenance, technological advancements, compliance to international guidelines, and other factors like foundered (sunk), wrecked/stranded (grounded), fire on board, accidents, loss of propulsion, failures of machineries, Non-Accidental Structural Failures (NASF), etc. affecting ship’s seaworthiness or efficiency. Age replacement models, random replacement models, and combination of such models like Replacement First (RF) and Replacement Last (RL) have been suggested making assumptions about failure distributions, replacement costs, nature of random working cycles, etc. Avoiding models, the paper suggests an assumption-free approach to assess economic viability of Extending Service Life (ESL) of a ship by through repairing action or replacement. Based on year wise investment, expected O&M costs and expected revenue, Internal Rate of Return (IRR) is found for which NPV= 0. Decision regarding replacement or repair of a ship can be accepted depending on IRRReplace > or < IRRESL IRR and NPV may rank the projects differently and overlook “flexibility” of the Shipping Company. IRR under different scenarios needs further sensitivity analysis due to uncertainties about future costs, actual available service life and demand of the ship. IRR and sensitivity analysis should be specific to a vessel.
Keywords:Life cycle cost; Failure costs; Environmental emissions; Extend service life; Replacement; IRR; NPV method
Introduction
Ocean going ships are specially designed for the envisaged tasks, often being equipped with cranes and other mechanisms to load and unload, and come in various sizes. Generally, ferries and cruise ships may have a lifespan of 30-40 years, while cargo ships can often operate for 25- 30 years before being scrapped. The economic lifespan of modern ships can vary depending on factors such as maintenance (preventive and also corrective), technological advancements, compliance to international guidelines, market demand, etc. Age based replacement policy of ships aims at maximizing availability and/or minimizing maintenance costs. Older ships are regularly replaced with new ships which are technologically advanced, efficient with reduced environmental effects to optimize capacity and service offerings. This is especially true for larger ships which tend to be bigger with modern structure and modern equipment on board and energy efficient satisfying carbon-intensity regulations.
To ensure that vessels calling at Indian ports comply with modern safety standards, with reduced likelihood of accidents, oil spills, or other maritime incidents, the Directorate General of Shipping, Government of India has issued guideline banning vessels aged≥5 years to enter into Indian waters, except for containers, gas/chemical carriers, etc., which have a 30-year limit. Dredges are permitted for up to 40 years (https://www.dgshipping.gov.in). However, decision to replace ships at pre-specified ages involving huge costs need to be supported by sound analysis of economic lifespan of ships which can vary depending on factors like preventive maintenance, corrective maintenance, market demand, and other factors like foundered (sunk), wrecked/stranded (grounded), fire on board, accidents, loss of propulsion, failures of machineries, etc. which reduce economic lifespan of ships. Loss of ships (over 100GT) by causes from 1st January 2014 to 31st December 2023 registered decreasing trends but still the number is quite significant as can be seen from the following Table 1.
Table 1:Loss of ships (over 100GT) by causes.

Non-Accidental Structural Failure (NASF) due to fatigue, poor maintenance of ships structure or deficiencies of ship’s structural design and/or inferior quality of construction, etc. refers to damages like cracks and fractures to hull, affecting ship’s seaworthiness or efficiency. Generally, NASF frequency increases with age. After analyzing statistical data relating to ship accidents, Eliopoulou [1] found that NASF frequency increased after the ships get older than 10 years. However, no straightforward relationship between ship’s age and NASF was observed by Farmakis [2] who found that 44% of NASF occurred for ships aged ≥15 years and 12% of NASF concerned young ships (aged up to 5 years). Estimating the causes of machinery failures is difficult, because ship’s machinery is codependent rather than individual systems. As per Review of Maritime Transport 2022 by UNCTAD [3], average age of all propelled seagoing vessels (≥100 gross tons) at global level increased to 21.9 years in 2022 from 21 years in 2021. Based on increase in average age, container ships ranked one, followed by oil tankers and then by general cargo ships. Reducing emissions from ships require significant investment in improving technical and operational processes, resulting in higher costs for operators and shippers [3]. Targets of 40% reduction of emissions of CO2 by 2030 and at least 20% of Greenhouse Gas (GHG) by 2030 and at least 70% by 2040 involves handling of alternative fuels that can be toxic or highly explosive.
For example, aground of large container ships or tankers powered by LNG or ammonia runs the risk of fire and explosion to remove fuel and refloat the vessel. Limited availability of infrastructure for vessels sailing in Arctic waters brings different kinds of risks to vessels, crews, and the environment. The cruise ship MV Ocean Explore with 206 people on board ran aground in Greenland in September 2023 and could not be towed free for three days [4]. International Maritime Organization (IMO) started decarbonization initiative for international shipping, in support of the UN Sustainable Development Goal 13, to take urgent action to combat climate change and its impacts [5].
In addition, Resolution MEPC.377 (80) was adopted by IMO in July 2023 on reduction of GHG emissions from ships outlining a comprehensive strategy to tackle greenhouse gas emissions and achieve net-zero emissions from international shipping close to 2050. The IMO 2018 regulation also provides for reforming the long-term energy system by adopting alternative fuels and cleaner technologies [6]. Thus, assessment of atmospheric emissions over entire life cycle is needed for vessels which differ across types and sizes (DWT). Further, USA and Norway have jointly announced Green Shipping Challenge for COP27 and approached IMO to adopt a revised greenhouse gas strategy, setting an interim goal for 2030 and zero emissions no later than 2050 and to mitigate rise of global temperature.
Therefore, it is of interest to investigate the energy use and atmospheric emissions of a vessel over its entire life cycle. The above said issues also increase operation and maintenance cost of the vessels. Opportunity-based replacement models assume Poisson distribution of arrival of opportunity [7] and rely on identifying opportune moments to replace a ship, based on a host of factors like market conditions, technological advancements, specific project requirements, etc. However, opportunity-based replacement models for ships ignore time value of money and create difficulties in accurately predicting opportunities, variations in opportunity costs, and integration of the models with existing maintenance and operational practices. Dekker [8] suggested the control limit policy which assumes Exponential distribution of time between successive arrivals of opportunities. But, defining and calculating the control limits in accurate fashion for the condition monitoring system is difficult since they depend on subjective judgments of experts, which can vary significantly.
Wang [9] proposed imperfect opportunistic maintenance model for a two-unit series system based on random repair time and two types of failures (soft failure and hard failure) of different units. Major problem areas of the model are: difficult to model accurately, imperfect maintenance actions, optimization of maintenance schedules, and accounting for the complexities of real-world systems, which can lead to increased maintenance costs, reduced system reliability and potential production losses. The above said models are not applicable for unstable economic environment [10]. Avoiding models and verification of the associated assumptions, the paper suggests an assumption-free approach to assess economic viability of increasing service life of a ship through repairing action or replacement.
Literature survey
IMO Regulations 2023: Following three new IMO regulations came into force on 1st January 2023
a) The Energy Efficiency Existing Ship Index (EEXI): for determining the energy efficiency of vessels over 400 GT. Ship operators will have to assess their ships’ energy consumption and CO2 emissions against specific energy efficiency requirements. This is a one-time certification. b) The annual operational Carbon Intensity Indicator (CII)-for indicating performance and efficiency of vessels with respect to fuel consumption per annum, using a rating scale A to E for ships with ≥ 5,000 GT. Ship-owners need to develop corrective action plan for ships achieving “D” rating for three consecutive years, or an “E” rating in a single year. c) The enhanced Ship Energy Efficiency Management Plan (SEEMP)-for improving CII ratings with envisaged targets and planning, along with new technologies and practices for optimizing ship performance, procedures for self-evaluation, verification and audits.
Uncertainties about future fuel type and costs, carbon prices, environmental regulations, technological developments, and increasing cost of new ships might have tended the owners to run older vessels instead of condemning them. In early 2022, the average age of global fleet continued to increase in terms of number of ships and also in terms of DWT. Absence of sound method of condemnation of vessels ensuring economic benefits has added to increase average age of vessels in operation.
Decommission and condemning a ship: Condemning ships is basically decertifying it for further safe use. Marine authorities usually go for condemning ships when they fail to pass inspections. They must be repaired to safe condition or cease to be used. Decommissioning implies taking the vessel out of service because she has outlived her useful service life or mothballed with possible reactivation, if the market improves or has been condemned and is not economical to make it safe again. The decision to condemn is typically made when a ship has reached the end of its operational life, or suffered severe damage beyond economical repair, or is deemed too costly to maintain. Condemning or decommissioning of a ship may results in recycling and reusing it to transition toward a circular economy, a multidimensional process across political, social, environmental, economic and technical domains [11] and requires efforts on building an integrated supply chain across the life-cycle stages of maritime shipping and developing closer collaborations among stakeholders [12].
Generally, the modern ocean shipping business is divided into two classes:
a) Liner business: typically (but not exclusively) container vessels
calling at a regularly published schedule of ports. A common
carrier refers to a regulated service where any member of
the public may book cargo for shipment, according to longestablished
and internationally agreed rules.
b) Tramp-tanker business: generally, this is private business
arranged between the shipper and receiver and facilitated by
the vessel owners or operators, who offer their vessels for hire
to carry bulk cargoes (dry or liquid) or break-bulk cargoes
with individually handled pieces to any suitable port(s) in
the world, according to a specifically drawn contract, called a
charter party.
Larger cargo ships are generally owned and operated by shipping lines or shipping companies that specialize in the handling of cargo in general. Smaller coastal trading vessels, also known as coasters are shallow-hulled merchant ships used for transporting cargo along a coastline, are often owned by their operators. Their shallow hulls help to get through reefs where deeper-hulled seagoing ships usually cannot. Service life of maritime vessels involves significant costs of building, manning, operating, maintaining, repairing and renovating throughout their life to cater to the need of changing technology or demand to determine obsolescence. The concept of service life of a ship differs from her physical live; performance failures against expectations below a level may make maritime vessels ineffective or likely to become ineffective in near future or maintaining and operating costs become considerably high. The designed service life of a ship based on design parameters is different from physical life which is the actual time she can physically remain operational and may be longer (depending on how well she is maintained) or shorter (depending on obsolescence or high operating costs) than the designed life. Longer operational life is beneficial for ship owners, but appropriate repair and maintenance actions are needed for safe operation [13]. However, periodic, regular maintenance may not deliver the minimum lifecycle cost [14]. Smaller ships tend to be deployed along secondary trading routes or used as coasters or feeders in the hub-and-spoke models of liner shipping networks and may have higher service life [15,16]. It may be economical for coastal vessels and feeder vessels to increase their service lives by replacing complete hull and machinery at huge costs and still showing higher Internal Rate of Return (IRR) due to higher demand, even if average age of such vessels go much beyond their designed service life [17].
Vessel life cycle cost: The life cycle analysis of a vessel helps to better understanding of the short-term and long-term costs (financial, physical, service, environmental) and benefits in operating the vessel for optimal decision making [18]. Disruptions faced by the shipping industry from wars in Ukraine and West Asia increased size of “dark fleet” with lesser availability of shipping capacity for legitimate operations; altered shipping routes with increased transit times, freight rates, insurance cost and expenses of trade, etc. [19]. Ships visiting congested ports face capacity constraints which affect service levels and increases costs. There is no consensus on classification of ship structural failures due to load type, stress type, degradation type, crack sizes, etc. Prediction of ultimate strength parameters of a ship depends on the chosen model, possible boundary conditions, Ultimate Load Factor (ULF) as ratio of the collapse load to the design load. The Moment-Curvature (M- φ) or the load-displacement (P-∇) curves indicating the ULF can be plotted separately for each vessel [20]. However, it is difficult to measure actual values of stresses and loads, acceleration, forces, etc., in real-life harsh conditions of ships for strength assessment. Daidola & Basar [21] distinguished five failure categories based on longitudinal strength of a hull girder. Ayyub [22] categorized ship failure modes into catastrophic, end of serviceability, serviceability limiting, non-limiting and nuisance failure modes, considering the severity of consequences resulting from failures. Zhang [23] found empirically that bulk carriers were most energy efficient followed by container ships and ships with higher DWT had higher energy efficiencies.
Liang [24] proposed a risk-informed framework to determine Optimal End-Of-Life (EOL) strategies for ships ensuring costeffectiveness and net benefit computed respectively by Benefit- Cost Ratio (BCR) and Net Present Value (NPV). Repairing action to increase service life is financially feasible if BCR>1 and replacement of ship is financially feasible for positive NPV. In the long run, ship replacement is beneficial since it assures economic life of the ship for about 20-25 years. Magnitude of the total net benefit is indicated by NPV unlike BCR [25]. While only essential maintenance costs are considered for ship replacement, increase service life of old ship needs to consider the safety margin to be preserved through proactive intervention including both preventative and essential maintenance actions. Dinu & Ilie [26] expressed total economic life cycle cost of a vessel (CT) by its initial cost (C0), maintenance cost (CM) covering costs of inspection, repair, layup, conversion and modification costs; failure cost (CF) and disposal cost (CD) as follows:
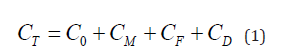
In case, a ship is damaged beyond repair, salvage costs are relevant. Otherwise, failure cost of a ship considers direct costs associated with a failure like, Repair costs (Cost of parts, labor, and materials to fix the failed component or system), Downtime costs (Loss of revenue during the repair period, including charter fees, fuel consumption, and crew wages and downtime (computed as Mean Time Between Failures (MTBF) multiplied by Mean Time To Recovery (MTTR)), and indirect costs like Potential loss of business (potential loss of contracts or future business due to delays or reputation damage), Liability Costs (cost leading to injury, environmental damage, or damage to other vessels), Increased Insurance Premiums(history of failures can lead to higher insurance premiums), Customer Dissatisfaction (failed deliveries or delays can lead to customer dissatisfaction and potential loss of future business). Calculation of failure costs involve identification of potential failure modes, assessing their impact, and calculating the associated costs using methods like Failure Mode, Effects, and Criticality Analysis (FMECA). Performance of a vessel at t-th time period (Pt) depends on the vector of services j(Sj) the vessel provides to various groups (e.g., users, owners) and the demand vector of services j(Dj) i.e.,
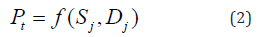
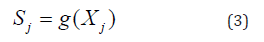
Here, Sj is characterized by design and operational characteristics of the facilities Xjs like load type, stress type, degradation type, crack sizes, steel modulus of elasticity, etc. i.e.
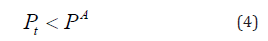
If performance falls below the minimum acceptable level (PA), the vessel tends to be ineffective or likely to become ineffective in the near future or Operation and Maintaining (O&M) costs become too high. Mathematically, failure can be shown as
It is extremely difficult to measure quantitatively each service offered by a vessel at different ages including efforts to reduce environmental emissions and compliance with the international norms and to combine them suitably followed by finding the minimum acceptable level of performance (PA), which are beyond the scope at the designing stage. Thus, the designed life is different from tolerance of service life based on usages of the vessel. Combining age replacement model and random replacement model, Zhao & Nakagawa [27] suggested Replacement First (RF) and Replacement Last (RL) making assumptions about failure distributions, replacement costs, nature of random working cycles, etc. Deviations from such assumptions do impact accuracy of the model. Moreover, calculation of optimal replacement time for both RF and RL models involves balancing the costs of preventive replacements (which are done before failure) and corrective replacements (which are done after failure). To calculate expected replacement costs minimizing the expected total discounted costs over a time horizon in unstable economic environment, Wu [28] used net present value (NPV) method by discounting future costs back to their present value to find expected total costs and corresponding expected revenues. The complicated framework suggested by the authors indicates when to replace a ship based on its age and the availability of opportunities, while considering the time value of money and the priority of different replacement options. However, discrete-time opportunity-based age replacement models with RF and RL disciplines cannot be taken as simple analogies of continuous-time models [10].
Proposed approach
Decision to condemn a vessel or to Extend Service Life (ESL) by thorough repairs is proposed to be arrived at by the following approach. For a given vessel, draw the
a) Operating income-age profile graph,
b) Operating cost-Age profile graph and
c) find the time-period (age of the vessel) as the point of
intersection of the two graphs,
i.e. the age where Operating income=Operating cost.
The above exercises to be made keeping in mind the following:
a) Each such graph to be drawn for age-range beyond the
designed life of the vessel.
b) For the future period, reliable estimates of Operating income
and Operating cost to be obtained.
c) Estimates of Operating income may consider demand of
services of the ship depending on the global/regional trade
volume and composition, geographical distribution of
production and consumption, other factors like economic
growth, population, consumption patterns, trade policies,
and geopolitical events, along with nature of business i.e.
monopoly, duopoly or perfect competition, possibility of
increasing freight rate, service charges, geopolitical risks, etc.
d) With increase in age, a vessel tends to incur higher Operating
costs under cost heads like crewing, insurance, lubricants,
fuel consumption, spare parts, provisions, stores, preventive
and maintenance repairs, survey costs, tonnage taxes, other
miscellaneous items. General & administrative expenses
including management fees, legal costs, audit fees, listing
fees, compensations to executives and stock compensation
expenses, etc. may also be included under Operating cost.
e) Estimates of future Dry-docking costs for special or
intermediate class survey and associated costs to get vessel’s
seaworthiness certificates may also be included in the
operating cost-age profile graph.
f) Each of the two graphs are different for different types of ships
and sizes, spanning the container, dry bulk, oil (crude and
products), chemical, LNG, LPG, general cargo, reefer, ro-ro and
car carrier sectors.
Clearly, it may not be wise to keep the vessel in the fleet when she reaches the age (A0)
where Operating income=Operating cost.
However, for the situation of significant cost of changing hull plates or repairing/replacing machineries, further cost-benefit analysis like finding Internal Rate of Return (IRR) is recommended under the scenario
a) Extension Of Service Life (ESL) with repair
b) without repair to explore options like condemnation, selling,
recycling, mothballing, etc. and replacement of the existing
ship by a new one.
This approach considers year wise investment made, expected Operation and Maintenance (O&M) costs (including cost of capital) and also expected revenue and finds Internal Rate of Return (IRR) by trial-and-error approach to find the discount rate for which NPV= 0 i. e.
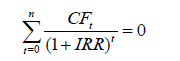
where n is the projected life of the investment and CFt denotes net cash flow at time t where t=0 signifies the start of the project. In other words, IRR is computed based on the time value of money and future cash flows and evaluates the profitability of an investment. Decision regarding replacement or repair of a ship can be accepted depending on
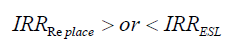
where IRRReplace and IRRESL must exceed the opportunity cost of capital required for replacement or repair and rejected if the IRR is less than the rate of potential returns from alternative investments.
Discussion
The paper finds an assumption free solution between choices of two mutually exclusive decisions viz. whether to replace an old vessel or go for thorough repair to add to her service life by comparing values of IRRReplace and IRRESL . The decision is vital since it influences a company’s financial health. IRR reflecting profitability is useful for comparing two or more projects. NPV reflecting value addition is better when there are varying directions of cash flow over time or multiple discount rates. Assumption of NPV that all future cash flows are reinvested in the project may not hold always. For two mutually exclusive projects, IRR and NPV may rank the projects differently. High investment and relatively low transaction volumes over the service life of ship giving rise to significant risks associated with the performance of ship are presumed to be built into the discount rate considered, but “flexibility” of the Shipping Company are often overlooked [29]. An appraisal ignoring the value-addition from prospective complements, may be insufficient to capture the total value derived by the Shipping Company [30]. IRR can be calculated using Excel’s IRR, MIRR, or XIRR function. The XIRR is more versatile since it has the flexibility to assign specific dates to each cash flow-making it suitable for cash flow series that occur at irregular intervals [31].
Conclusion
Suggested analysis of finding age of the vessel where Operating income=Operating cost and subsequent analysis like IRR under different scenarios needs further sensitivity analysis due to uncertainties about future costs (fuel costs, carbon prices, environmental regulations, technological developments), available service life and demand of the ship. IRR and sensitivity analysis should be specific to a vessel. All necessary data need to be obtained pertaining to the vessel under consideration for estimation of costs and revenues on year-to-year basis. Empirical investigations may be undertaken to compare fixed economic life of a ship and it’s IRR.
References
- Eliopoulou E, Farmakis E, Papanikolaou A (2015) Non-accidental structural failures of large tankers.
- Farmakis E (2015) Analysis of non-accidental structural failures and machinery failures on large tankers.
- UNCTAD (2022) Review of maritime transport 2022.
- UNCTAD (2024) Navigating troubled waters, Impact to global trade of disruption of shipping routes in the Red Sea, Black Sea and Panama Canal. UNCTAD rapid assessment, (UNCTAD/OSG/INF/2024/2).
- IMO (2018) Initial IMO strategy on reduction of GHG emissions from ships.
- Olmer N, Comer B, Roy B, Mao X, Rutherford D (2017) Grerenhouse gas emissions from global shipping, 2013-2015. The International Council on Clean Transportation 1-25.
- Nakagawa T (2008) Advanced reliability models and maintenance policies. UK.
- Dekker R, Dijkstra MC (1992) Opportunity-based age replacement: Exponentially distributed times between opportunities. Nav Res Logist 39(2): 175-190.
- Wang, J, Miao Y, Yi Y, Huang D (2021) An imperfect age-based and condition-based opportunistic maintenance model for a two-unit series system. Comput Ind Eng 160: 107583.
- Wu J, Qian C, Dohi T (2024b) Optimal opportunity-based age replacement policies in discrete time. Reliability Engineering & System Safety 241: 109587.
- Awasthi AK, Cheela VRS, Adamo I, Iacovidou E, Islam MR, et al. (2021) Zero waste approach towards a sustainable waste management. Resources, Environment and Sustainability 3: 100014.
- OECD (2019) Ship recycling: An overview.
- Boulares J, Valluri S, Norris E (2017) An analysis-based approach for evaluating the service life of naval vessels.
- Garbatov Y, Guedes SC (2001) Cost and reliability-based strategies for fatigue maintenance planning of floating structures. Reliability Engineering & System Safety 73(3): 293-301.
- Bhonsle J (2022) Causes and consequences of vessel delays in container shipping. Marine Insight.
- DHL (2022) Ocean freight market update-July 2022.
- ABS (2017) Life extension services: Life cycle services.
- Pawlik T (2011) Ship life cycle assessment and management.
- Chakrabartty SN (2024) Economic impact of war in Ukraine and in West Asia. Recent Archives of Journalism & Mass Communication (RAJMC) 1(1): 1-5.
- Kumar SS, Kumar PGS (2014) Ultimate strength analysis of ship structures. International Journal of Design and Manufacturing Technology 5(3): 107-114.
- Daidola JC, Basar NS (1980) Probabilistic structural analysis of ship hull longitudinal strength pp: 1-91.
- Ayyub BM, Whitw WJ, Purcell ES (1989) Estimation of the structural service life of ships. Naval Engineers Journal 101(3): 156-166.
- Zhang Y, Chang Y, Wang C, Fung JCH, Alexis KH (2022) Life-cycle energy and environmental emissions of cargo ships. Journal of Industrial Ecology 26(6): 2057-2068.
- Liang L, David YY, Dan MF (2020) Probabilistic cost-benefit analysis for service life extension of ships. Ocean Engineering 201: 107094.
- Khurshid MB, Irfan M, Labi S (2108) Comparison of methods for evaluating pavement interventions: Evaluation and case study. Transportation Research Record 2108(1): 25-36.
- Dinu O, Ilie AM (2015) Maritime vessel obsolescence, life cycle cost and design service life. IOP Conf Ser Mater Sci Eng 95: 012067.
- Zhao X, Nakagawa T (2012) Optimization problems of replacement first or last in reliability theory. Eur J Oper Res 223(1): 141-149.
- Wu J, Qian C, Dohi T (2024) A net present value analysis of opportunity-based age replacement models in discrete time. Mathematics 12: 1472.
- Delapedra SV, Ferreira P, Cunha J, Kimura H (2022) Methods for financial assessment of renewable energy projects: A review. Processes 10(2): 184.
- Lee HC, Chang CT (2018) Comparative analysis of MCDM methods for ranking renewable energy sources in Taiwan. Renewable and Sustainable Energy Reviews 92: 883-896.
- MEPC R (2023) 2023 IMO strategy on reduction of GHG emissions from ships.
© 2025 Satyendra NC. This is an open access article distributed under the terms of the Creative Commons Attribution License , which permits unrestricted use, distribution, and build upon your work non-commercially.
Editor In Chief


.jpg)


Signup for Newsletter

Quick Links
 Editorial Board Registrations
 Submit your Article
 Refer a Friend
 Advertise With Us
Our Recent Edition

.jpg)


Top Editors


.jpg)


.bmp)
.jpg)
.png)
.jpg)


.jpg)


.png)

.png)


.png)


Financial Support

Sponsors

Latest e-Books

Latest Video

 a Creative Commons Attribution 4.0 International License. Based on a work at www.crimsonpublishers.com.
Best viewed in
a Creative Commons Attribution 4.0 International License. Based on a work at www.crimsonpublishers.com.
Best viewed in