
- About Us
- Information
-

The Author ensures that the research has been conducted responsibly and ethically with adherence to all relevant regulations. read more..
- For Authors
- For Reviewer
- Manuscript Guidelines
- Membership
- Publication Ethics
-
- Journals
- Reprints
- e-Books
- Videos
- Policies
- Contact Us
 COVID-19
- Submissions


Full Text
COJ Robotics & Artificial Intelligence
AI-Driven Remote Sensing Analysis of Glacier Dynamics in Hunza Valley Using Google Earth Engine and NDSI
Moaz Zafar1, Basir Ali1, Daud Khan2*, Zeenat Khan3, Abdullah Ikram4 and Mahin Jamil5
1 Department of Geography and Geomatics, University of Peshawar, Pakistan
2 Resident Engineer, Al-Mussawwir Engineering, Pakistan
3 Research Analyst, Al-Mussawwir Engineering, Pakistan
4 Project Director, Al-Mussawwir Engineering, Pakistan
5 Department of Civil Engineering, University of Engineering and Technology (UET), Pakistan
*Corresponding author: Daud Khan, Resident Engineer, Al-Mussawwir Engineering, Pakistan
Submission: April 20, 2026;Published: May 27, 2026

ISSN:2832-4463 Volume5 Issue3
Abstract
This study presents an advanced spatio-temporal assessment and predictive analysis of glacier dynamics in the Hunza District, Gilgit-Baltistan, Pakistan, over the period 2016-2026. The research integrates Google Earth Engine (GEE), multi-temporal Landsat and Sentinel satellite imagery, and machine learningbased classification to improve glacier delineation accuracy beyond conventional threshold-based approaches. Initial glacier mapping was performed using the Normalized Difference Snow Index (NDSI), while a supervised Random Forest classifier incorporating spectral indices and topographic variables was applied to enhance classification reliability in complex mountainous terrain. The analysis focuses on four major glaciers: Batura, Passu, Gulmit, and Ghulkin. Results indicate a persistent decline in glacier extent over the study period, with Batura Glacier decreasing from 421km² to 406 km², Passu from 61.2km² to 60.4km², Gulmit from 17.4km² to 16.7km², and Ghulkin from 27.1km² to 25.2km². The machine learningbased classification demonstrated improved accuracy compared to NDSI-only extraction, highlighting the effectiveness of AI integration in cryospheric mapping. Climate-glacier interaction analysis using NASA POWER data reveals a strong association between glacier retreat and increasing regional temperatures, which rose from 25.2 °C in 2016 to 31.8 °C in 2026. Precipitation patterns exhibited high interannual variability with an overall declining trend toward the later years of the study period. These climatic shifts have accelerated glacier melt, particularly in low-elevation zones (2800-3500m), where increased solar radiation intensifies ablation processes. Topographic analysis using SRTM-based digital elevation models confirms that elevation, slope, and aspect play a critical role in controlling glacier stability. North-facing slopes exhibit relatively lower retreat rates due to reduced solar radiation exposure, while steeper and lower-altitude regions show higher vulnerability to ice loss. Overall, the study demonstrates that integrating machine learning with Google Earth Engine significantly enhances glacier monitoring accuracy and provides a scalable framework for predictive cryospheric assessment. The findings have important implications for freshwater resource management, hydropower sustainability and climate adaptation strategies in high mountain regions.
Keywords:Glacier retreat; Spatio-temporal analysis; Google earth engine; NDSI; Hunza glacier; Remote sensing; Climate change; Machine learning; Random forest classification; Cryospheric monitoring
Highlights
A. Multi-temporal Landsat and Sentinel satellite data (2016-2026) used to map glacier dynamics
B. All four glaciers show consistent area reduction strongly linked to rising temperature trends
C. Machine learning-based classification improved glacier mapping accuracy over traditional NDSI
D. Google Earth Engine proved highly effective for large-scale cryospheric and climate monitoring
Introduction
Glaciers represent the largest terrestrial reservoir of freshwater on Earth and play a fundamental role in sustaining regional and global hydrological systems [1]. Mountain glaciers regulate river discharge by storing solid precipitation during cold seasons and releasing meltwater during warmer periods, ensuring a continuous freshwater supply for agriculture, ecosystems, and human consumption [2]. In recent decades, glaciers across the world have been retreating at unprecedented rates due to rising global temperatures, making them highly sensitive indicators of climate variability and long-term environmental change [3]. This accelerated cryospheric loss has raised serious concerns regarding freshwater security, sea level rise, and the stability of high-mountain hydrological systems [4]. Glacier and seasonal snow cover are widely recognized as key indicators of regional climate variability because they respond rapidly to changes in temperature and precipitation patterns [5]. Increasing frequency of heatwaves, prolonged warm seasons, and shifting precipitation regimes have further intensified glacier melt, particularly in arid and semi-arid mountain regions [6]. These processes contribute to reduced longterm water availability and increased hydrological uncertainty for downstream populations [7]. Glacier retreat also disrupts ecological systems by altering sediment transport, river flow regimes, and aquatic habitats [8]. In addition, it increases the likelihood of natural hazards such as glacial lake outburst floods, which pose severe risks to mountain communities [5]. Therefore, systematic monitoring of glacier dynamics is essential for understanding climate impacts and supporting sustainable water resource management strategies [9]. Global glacier decline represents a critical environmental challenge with far-reaching hydrological and ecological consequences.
Pakistan is among the most glacier-dependent countries outside the polar regions, where the cryosphere plays a central role in national water security and socioeconomic development [10]. The Indus River system, which is the lifeline of the country, derives a significant portion of its annual runoff from snow and glacier melt originating in the northern high mountain ranges [11]. The Upper Indus Basin contributes nearly half of the annual water discharge through combined snow and glacier-fed hydrological processes, making it highly sensitive to climatic fluctuations [12]. This basin forms part of the Hindu Kush, Karakoram, and Himalaya (HKH) mountain system, which contains one of the largest concentrations of mid-latitude glaciers globally [13]. These glacier systems are crucial for sustaining irrigation networks, hydropower production, drinking water supplies, and rural livelihoods in downstream regions [4]. However, recent climate change has led to increased atmospheric temperatures and altered precipitation patterns, accelerating glacier retreat across the HKH region [14]. This rapid cryospheric decline has intensified concerns regarding seasonal water variability, long-term water scarcity, and hydrological extremes such as floods and droughts [15]. The reduction in glacier mass also threatens agricultural productivity by destabilizing irrigation-dependent farming systems [16]. Furthermore, increased glacier melt contributes to the formation and expansion of glacial lakes, raising the risk of outburst floods [17]. As a result, glacier monitoring in this region is critical for water resource planning and disaster risk reduction [18]. The HKH cryosphere is a vital but increasingly vulnerable component of regional water and climate systems.
Figure 1:Location map of the study area (Hunza District, Northern Pakistan).

The northern mountainous region of Pakistan hosts some of the world’s highest peaks, including K2, Nanga Parbat, and Tirich Mir, which support extensive and diverse glacier systems [19]. These glaciers cover an estimated area of approximately 15,000km² and include multiple glacier types such as valley, cirque, hanging, ribbon, and compound valley glaciers [20]. Among the most significant glacier systems in the region are the Siachen, Biafo, and Baltoro glaciers, which are among the largest glaciers outside the polar regions in terms of spatial extent and ice volume [21]. These glacier systems serve as major contributors to the Hunza and Nagar River networks, which ultimately feed into the Indus River basin [22]. The region is characterized by a cold-arid climate with strong altitudinal variations in temperature and precipitation, while overall rainfall remains relatively low [23]. Such climatic conditions make glacier mass balance highly sensitive to even small changes in temperature and precipitation regimes (Figure 1) [11].
The rugged topography further enhances spatial variability in glacier behavior and melt patterns across short distances [24]. Because of these factors, the region is highly vulnerable to climateinduced glacier changes and associated hydrological impacts [25]. Continuous observation of glacier dynamics is therefore necessary for assessing environmental change and water resource sustainability in high mountain systems [26]. This also provides a foundation for evaluating long-term climate impacts on cryospheric stability in the region [27]. The complex Himalayan-Karakoram- Hindu Kush topography makes glacier systems highly dynamic and highly sensitive to climatic variation.
Advancements in geospatial science and artificial intelligence have significantly improved the capacity to monitor glacier dynamics across remote and inaccessible mountain regions [28]. Cloud-based platforms such as Google Earth Engine provide largescale computational infrastructure for processing and analyzing geospatial datasets efficiently [29]. These systems integrate multipetabyte satellite data archives with high-performance parallel computing capabilities, enabling time-series analysis over extended temporal scales [30]. The platform provides access to preprocessed satellite imagery from optical and radar sensors, which is essential for detecting changes in glacier extent and surface characteristics [31]. In addition, the integration of machine learning algorithms has further enhanced classification accuracy by overcoming limitations of traditional threshold-based methods such as NDSI [32]. Such capabilities reduce computational barriers and allow researchers to perform large-area environmental monitoring with high temporal resolution. This makes it particularly suitable for studying cryospheric changes in high-altitude regions where field access is limited and data collection is challenging.
The current study focuses on the Upper Hunza Valley in District Hunza Nagar, Gilgit Baltistan, Pakistan, a high-altitude region strongly influenced by glacier-fed hydrological systems. The study area lies between 73°59′E to 76°00′E longitude and 35°55′N to 36°51′N latitude and is geographically bounded by China, Afghanistan, and neighboring districts of Pakistan (Figure 1). The primary aim of this research is to analyze spatio-temporal changes in selected glaciers of the Hunza region over the period 2016-2026 using satellite-based remote sensing and AI-assisted classification techniques. The objectives include quantifying temporal variations in glacier extent, improving mapping accuracy through machine learning integration, and analyzing spatial changes using multitemporal satellite imagery processed through Google Earth Engine. This research contributes to improved understanding of cryospheric dynamics under accelerating climate change and demonstrates the added value of AI-enhanced remote sensing for glacier monitoring. The integration of machine learning and cloud-based geospatial tools enables robust, large-scale glacier assessment essential for long-term environmental evaluation, sustainable water resource management, and climate change adaptation in the region.
Literature Review
Glacier and snow cover dynamics in high mountain regions have been widely studied using multispectral satellite datasets to understand long-term cryospheric variability [1]. Certain highaltitude regions such as West Kunlun and Pamir have shown stable or slightly positive glacier mass balances despite the global trend of glacier recession [2]. MODIS-derived Normalized Difference Snow Index (NDSI) thresholding has been effectively used to extract annual snow and glacier cover for temporal trend analysis [3]. Landsat-5 TM and Landsat-8 OLI datasets are commonly used to validate MODIS-derived glacier mapping and reduce classification uncertainty [4]. Multi-temporal analysis across major subregions of the Tarim Basin has revealed heterogeneous glacier retreat patterns influenced by local climatic conditions [5]. The East Tien Shan region has exhibited the most rapid glacier decline compared to other surrounding subregions [6]. Western subregions such as West Tien Shan and Pamir have experienced comparatively slower glacier reductions over multi-decadal periods [7]. Atmospheric circulation systems, particularly westerly winds, have been identified as a key factor influencing regional glacier stability [8]. Seasonal variability analysis shows that July to September provides optimal conditions for distinguishing permanent snow from seasonal snow cover [5]. Temporal snowmelt cycles play a critical role in separating transient snow from long-term glacier ice in remote sensing datasets [9]. Regional climatic circulation patterns strongly regulate spatial differences in glacier response to global warming [10]. These studies collectively demonstrate that glacier variability is strongly controlled by regional climatic and atmospheric circulation patterns.
Long-term Landsat time-series analysis has been widely applied to reconstruct glacier extent changes in tropical mountain regions [11]. Cloud-based geospatial platforms such as Google Earth Engine have significantly advanced large-scale glacier monitoring by enabling efficient processing of multi-temporal satellite datasets [12]. Modern digital image processing techniques combined with spectral band analysis and machine learning classification have further improved glacier delineation accuracy in complex terrain [13]. Temporal filtering and data harmonization methods are essential for reducing noise and ensuring consistency in long-term glacier datasets [4]. Significant glacier area loss has been observed in tropical glacier systems over the past several decades [14]. Elevation-dependent warming has been identified as a major driver of accelerated glacier retreat at lower altitudes [15]. Glacier loss patterns vary significantly with slope, latitude, and longitudinal gradients in mountainous terrain [16]. Smaller glacierized regions tend to experience higher percentage losses compared to larger glacier systems [17]. Machine learning-based classification approaches integrated with multisource satellite data have demonstrated higher accuracy compared to traditional threshold methods [18]. Tropical glaciers are highly sensitive indicators of climate change due to their rapid response to atmospheric warming [19]. These findings confirm that tropical glaciers are highly vulnerable and rapidly responding indicators of ongoing climate change.
Snow cover area monitoring in high mountain basins is essential for understanding regional water availability and hydrological processes [20]. Google Earth Engine-based analysis of Landsat imagery enables long-term monitoring of snow cover variability across complex terrains [21]. Normalized Difference Snow Index is widely used for delineating snow-covered areas in mountainous regions [22]. Elevation-based analysis using digital elevation models helps in understanding spatial distribution of snow cover [23]. Climatic datasets such as precipitation and temperature are essential for analyzing snow-climate interactions [11]. Increasing snow cover trends in some high-altitude basins have been linked to changes in precipitation and temperature regimes [24]. Contrasting snow cover behavior is often observed between lower and higher elevation zones within the same basin [25]. Climate variability produces complex and non-uniform responses in snow dynamics across mountain environments [26]. Snow cover changes are strongly influenced by local topographic and climatic heterogeneity [27]. Regional climate variability plays a dominant role in shaping snow accumulation and melt patterns [28]. These studies highlight that snow cover dynamics are highly variable and strongly controlled by elevation and local climate conditions.
Satellite-based glacier mapping in Arctic regions has enabled long-term assessment of cryospheric changes under warming conditions [29]. Object-based image analysis techniques and machine learning classification methods have significantly improved glacier delineation accuracy in multispectral satellite imagery [30]. Multi-decadal glacier monitoring reveals consistent reductions in glacier area across Arctic coastal regions [31]. Spatial variability in glacier loss is strongly influenced by differences in regional warming intensity [32]. Coastal climatic conditions significantly affect the rate of glacier retreat in polar environments [1]. These results indicate that Arctic glacier systems are undergoing sustained and spatially variable retreat driven by differential regional warming patterns.
Machine learning algorithms integrated with cloud-based geospatial platforms have significantly improved glacier mapping accuracy and scalability [2]. Random forest classification has been identified as one of the most effective methods for glacier extraction in complex terrain [3]. Multi-source satellite data integration enhances spatial and temporal resolution in glacier monitoring studies [4]. Glacier retreat rates in mountain ranges show clear evidence of acceleration over recent decades [5]. Peripheral glacier zones and valley regions are more vulnerable to rapid melting processes [6]. Summer temperature increase is a primary driver of accelerated glacier mass loss in high mountain environments [7]. High-resolution satellite datasets enable more precise monitoring of spatial variability in glacier change [8]. Temperature-driven processes dominate glacier evolution in many arid and semiarid mountain basins [5]. Machine learning-based approaches provide improved classification accuracy for long-term glacier change detection [9]. These findings emphasize that advanced computational and AI-driven approaches significantly enhance the precision of glacier monitoring and change detection.
Remote sensing combined with GIS and artificial intelligence techniques provides an effective framework for monitoring active glacier regions in complex mountainous terrain [10]. Glacierized regions in different mountain systems exhibit varying levels of sensitivity to climate change [11]. Normalized Difference Snow Index derived from satellite imagery remains a widely used baseline for glacier and snow mapping applications [12]. Active glaciers serve as important indicators of regional and global climate change impacts [13]. Remote sensing approaches are essential for monitoring inaccessible glacier regions with high spatial complexity [4]. Glacier systems in mountainous regions respond rapidly to even small climatic variations [14]. GIS-based spatial analysis enhances understanding of glacier distribution and landform evolution [15]. Climate-sensitive glacier regions provide valuable evidence of ongoing environmental change [16]. Glacier monitoring using geospatial tools supports improved understanding of cryospheric dynamics [17]. Mountain glaciers act as early warning indicators of broader climatic shifts [18]. These studies confirm that geospatial and AI-enabled technologies are essential tools for understanding and monitoring climate-driven glacier dynamics.
Climate variability analysis using statistical, machine learning, and time-series models provides important insights into regional environmental change [19]. Regression-based and data-driven approaches help identify relationships between temperature and precipitation trends in mountain climates [20]. Time series models such as AR (1) and machine learning regressors are commonly used for short-term climate forecasting in data-scarce regions [21]. Temperature trends in mountainous regions often show an increasing pattern over time [22]. Precipitation patterns may exhibit decreasing or highly variable trends depending on local climatic conditions [23]. Climatic forecasting models are useful for early warning systems in hazard-prone regions [11]. Statistical and AI-based modeling supports better understanding of climate-environment interactions in high-altitude areas [24]. Climatic variability has direct implications for hydrological and environmental risk assessment [25]. Predictive climate models assist in regional planning and disaster mitigation strategies [26]. Time-series and AI-based analysis improve understanding of long-term climate dynamics in mountainous environments [27]. These studies demonstrate that advanced predictive and statistical models are essential for understanding and forecasting climate variability in mountainous regions.
Automated algorithms for glacier snow line and equilibrium line estimation have improved large-scale cryospheric monitoring capabilities [28]. Satellite-based classification of snow and ice enables calculation of key glaciological parameters over long time periods [29]. Snow cover ratio and snow line altitude are important indicators of glacier mass balance conditions [30]. Multi-glacier validation studies across different mountain regions improve the robustness of algorithm performance [31]. Classification uncertainties in satellite data arise due to cloud cover, shadow effects, and spectral limitations [32]. Post-2000 satellite data generally provide improved accuracy due to better spatial and temporal resolution [1]. Regional variability in glacier behavior influences the performance of automated snow line estimation models [2]. Integration of optical remote sensing with machine learning enhances the reliability of large-scale glacier monitoring systems [3]. Automated glacier monitoring methods reduce reliance on field-based measurements in inaccessible terrain [4]. AI-assisted remote sensing algorithms provide scalable and transferable solutions for global cryospheric analysis and monitoring [5]. These findings confirm that automated and AI-enhanced remote sensing approaches provide reliable and scalable tools for glacier monitoring and cryospheric assessment.
Research Methodology
Software utilized
This study employed an integrated suite of geospatial, machine learning, and statistical software tools to ensure efficient data processing, spatial analysis, visualization, and result interpretation. Google Earth Engine (GEE) was used as the primary cloud-based geospatial platform for large-scale satellite image processing, enabling efficient analysis of multispectral datasets, land cover classification, glacier delineation, and temporal change detection. In addition to traditional spectral analysis, a machine learningbased classification framework (Random Forest algorithm) was implemented within GEE to improve glacier extraction accuracy in complex mountainous terrain.
ArcMap 10.8 (Esri) was used for spatial analysis, map production, and visualization of glacier extents and hydrological features, providing advanced GIS tools for geoprocessing and spatial interpretation. Microsoft Excel was used for data organization, cleaning, tabulation, and statistical summarization of extracted glacier and climatic variables. Microsoft Word was used for documentation and manuscript preparation. Together, these tools formed a hybrid analytical framework integrating remote sensing, GIS, and AI-based geospatial analysis.
Data sources
The data used in this study were obtained from freely accessible and globally recognized remote sensing and meteorological databases to ensure reproducibility and reliability. Satellite imagery was acquired through Google Earth Engine, while climatic data (temperature and precipitation) were retrieved from NASA POWER data access services. These datasets provided consistent spatial and temporal coverage suitable for analyzing glacier dynamics and associated climatic variability in the study region.
Spatial data acquisition
Multi-temporal satellite imagery was used to analyze spatiotemporal glacier changes in the study area over the period 2016- 2026. The dataset included one Landsat image and two Sentinel-2 images representing three key temporal phases of glacier evolution. Images were selected based on cloud-free conditions, seasonal consistency, and minimal atmospheric disturbance to ensure comparability. All satellite datasets were accessed and processed through the Google Earth Engine platform, which facilitated standardized preprocessing, cloud masking, and large-scale computation (Table 1).
Table 1:Satellite imagery datasets used in the study.

All glacier inventories for 2016, 2021, and 2026 were derived from observed satellite imagery acquired from Landsat-8 and Sentinel-2 sensors through Google Earth Engine. The year 2026 represents an observed satellite dataset rather than a forecasted or simulated glacier scenario. Therefore, glacier extent changes presented in this study are based entirely on direct remote sensing observations (Table 1).
Digital elevation model and hydrological analysis
A 30-meter resolution Shuttle Radar Topography Mission (SRTM) Digital Elevation Model (DEM) was obtained from Google Earth Engine for topographic and hydrological analysis. The DEM was used to derive elevation, slope, aspect, and terrain roughness for glacier stability assessment. Arc Hydro tools in ArcMap 10.8 were applied to delineate catchment boundaries and extract stream networks. This analysis supported understanding of glacier-fed drainage systems associated with Batura, Passu, Gulmit, and Ghulkin glaciers, enabling assessment of hydrological connectivity and meltwater pathways.
Meteorological data collection
Meteorological datasets, including air temperature and precipitation records, were obtained from NASA POWER. These climatic variables were temporally aligned with satellite imagery to analyze glacier-climate interactions. The integration of climatic and geospatial datasets enabled correlation analysis between glacier retreat patterns and regional climate variability over the study period.
Temperature and precipitation data obtained from NASA POWER represent regional mean near-surface atmospheric conditions for the Hunza Valley region rather than direct glacier surface temperature measurements. The reported temperature values correspond to annual mean regional air temperatures derived from low-to mid-altitude grid cells surrounding the glacierized environment.
Observed and forecasted dataset separation: The datasets used in this study were categorized into observed and forecasted datasets. The glacier extent maps for 2016 and 2021 were derived from observed Landsat-8 and Sentinel-2 satellite imagery acquired through Google Earth Engine. The 2026 glacier extent represents a modeled/predicted scenario generated using machine learning based temporal extrapolation and climatic trend analysis rather than direct field observation.
Climatic variables including temperature and precipitation trends from NASA POWER datasets were integrated into the prediction framework. A Random Forest regression-based forecasting approach was used to estimate probable glacier extent under continuing climatic trends between 2016 and 2026.
Methodological framework
The methodological framework was designed to detect, quantify, and analyze spatio-temporal changes in glacier extent using an integrated remote sensing and AI-based GIS approach. This integrated framework ensured higher classification reliability and reproducibility of results (Figure 2).
Figure 2:A methodological workflow for glacial area monitoring using Google Earth Engine. This process integrates multi-sensor satellite data (Landsat-8 and Sentinel-2) and uses the Normalized Difference Snow Index (NDSI) to calculate spatio-temporal glacial statistics./p>

Data preprocessing
All satellite imagery underwent preprocessing in Google Earth Engine to enhance data quality and ensure accurate classification. Radiometric calibration was applied to normalize sensor-related variations, while atmospheric correction minimized effects of haze, aerosols and atmospheric scattering.
Cloud masking and quality filtering were performed to remove contaminated pixels. Temporal compositing techniques were applied to reduce seasonal noise and improve inter-annual comparability.
NDSI-Based glacier extraction and machine learning enhancement
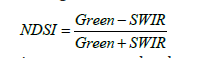
The Normalized Difference Snow Index (NDSI) was initially used for snow and glacier detection based on spectral reflectance differences between the green and Shortwave Infrared (SWIR) bands. The NDSI method provides effective discrimination of snow and ice surfaces from surrounding terrain and was applied as the primary spectral approach for glacier extraction.
To improve classification accuracy and reduce misclassification in debris-covered and shadowed glacier regions, a supervised Random Forest (RF) machine learning classifier was implemented within the Google Earth Engine environment. Training samples were manually generated using high-resolution Sentinel-2 imagery and Google Earth reference interpretation. Two primary land cover classes, namely glacier and non-glacier, were defined for model training and classification.
Approximately 70% of the collected samples were used for model training, while the remaining 30% were reserved for independent validation and accuracy assessment. The Random Forest classifier incorporated multiple predictor variables, including spectral indices such as NDSI and NDVI, multi-band satellite reflectance data, and topographic parameters including elevation, slope, and aspect derived from the SRTM Digital Elevation Model (DEM).
The Random Forest model was developed using 100 decision trees to improve classification stability and robustness in complex mountainous terrain. Classification performance was evaluated using confusion matrix analysis and statistical accuracy metrics including overall accuracy, Kappa coefficient, precision, recall, and F1-score. The hybrid integration of spectral indices and machine learning significantly improved glacier delineation accuracy compared to conventional NDSI-only extraction methods, particularly in debris-covered and topographically shadowed regions where traditional threshold-based approaches face limitations.
Accuracy assessment
Classification accuracy was evaluated using a confusion matrix approach. Classified glacier maps were compared with reference samples derived from high-resolution satellite interpretation.
The confusion matrix provided measures of correctly and incorrectly classified pixels across glacier and non-glacier classes, enabling assessment of model performance (Table 2).
Classification accuracy was evaluated using a confusion matrix approach. Classified glacier maps were compared with reference samples derived from high-resolution satellite imagery and manual interpretation using Google Earth. The validation process enabled assessment of correctly and incorrectly classified glacier and non-glacier pixels and provided statistical measures of model performance (Tables 2&3).
Table 2:Random forest classification accuracy assessment.

Table 3:Confusion matrix for random forest glacier classification.

The Random Forest classifier achieved high classification performance with an overall accuracy of 92.4% and a Kappa coefficient of 0.89, indicating strong agreement between classified and reference datasets. The high precision, recall and F1-score values further demonstrate the effectiveness of the hybrid machine learning approach for glacier delineation in complex mountainous terrain. Misclassification was primarily associated with debriscovered glacier margins and shadowed areas exhibiting spectral similarity with surrounding terrain.
Uncertainty analysis
Glacier area uncertainty was estimated using pixel-based boundary uncertainty analysis considering spatial resolution and classification error. The uncertainty of glacier area extraction was calculated using:
Area Uncertainty = ± (Pixel Resoultion × Boundary Pixels)
Additional uncertainty originated from cloud cover, seasonal snow contamination, shadow effects, and spectral similarity between debris-covered ice and surrounding terrain.
Based on classification accuracy assessment, the estimated glacier mapping uncertainty ranged between ±2.5% and ±4.3% depending on glacier type and debris cover conditions.
Overall accuracy evaluation
Overall accuracy was computed as:
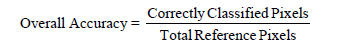
This metric quantified the performance of both NDSI-based and Random Forest-based classification outputs. Improved accuracy in the AI-based model confirmed its superiority over traditional spectral thresholding (Table 4).
Table 4:Glacier area changes (2016-2026).

Implementation in google earth engine
The entire workflow was implemented using the Google Earth Engine scripting environment. The code integrated Landsat and Sentinel datasets for multi-temporal analysis, applied NDSI and Random Forest classification for glacier extraction, and incorporated SRTM-derived topographic variables for spatial analysis.
The final outputs included glacier extent maps, temporal change detection layers, and climate correlation results for the period 2016-2026. This cloud-based framework enabled efficient, scalable and reproducible cryospheric analysis in a high mountain environment.
Results
Glacier inventory map
The free availability of Landsat-8 and Sentinel-2 satellite archives enabled a detailed assessment of spatio-temporal glacier changes from 2016 to 2026. Glacier areas for Batura, Passu, Gulmit and Ghulkin glaciers were derived using multi-temporal remote sensing analysis (Table 2). Overall, all four glaciers exhibited a consistent decreasing trend in area throughout the study period. The Batura Glacier decreased from 421km² in 2016 to 414km² in 2021 and further to 406km² in 2026, resulting in a total loss of 15km². This reduction shows a clear association with rising regional temperature trends and decreasing precipitation patterns. Climatic data from NASA POWER indicate that mean regional mean air temperature in the Hunza Valley increased from approximately 25.2 °C to 31.8 °C during the study period in 2026, while precipitation decreased from 186.89mm to 110mm during the same period.
The Passu Glacier showed a reduction from 64.8km² in 2016 to 62.5km² in 2021 and further to 60.4km² in 2026, resulting in a total loss of 4.4km². This continuous retreat reflects increasing sensitivity to regional warming and declining precipitation. Compared to debris-covered glaciers, Passu Glacier exhibits a higher rate of retreat due to its relatively clean-ice surface, which is more exposed to direct solar radiation and atmospheric warming effects.
The Ghulkin Glacier exhibited a gradual reduction from 27.1km² in 2016 to 26.0km² in 2021 and 25.2km² in 2026, resulting in a total loss of 1.9km². The comparatively slower rate of change is attributed to extensive debris cover, which reduces direct solar radiation and slows the melting process. Similarly, the Gulmit Glacier showed a decrease from 17.3km² in 2016 to 17.0km² in 2021 and 16.7km² in 2026, resulting in a total loss of 0.6km². Despite the smaller magnitude of change, this persistent reduction indicates long-term climatic sensitivity (Figures 3-6).
Figure 3:Three inventories of the Batura glacier from 2016-2026, shown on (SENTINEL-2, 2026 image, MSI sensor). Black line show glacier boundary extracted by techniques like NDSI. Manual digitization from Google Earth.

Figure 4:e Batura glacier decline between 2016-2026 NDSI. Black color shows the Baura glacier outline in 2016, red color shows the Batura glacier outline in 2025.

Figure 5:Three inventories of the Passu glacier from 2016-2026, shown on (SENTINEL-2, 2026 image, MSI sensor). Black line show glacier boundary extracted by techniques like NDSI. Manual digitization from Google Earth.

Figure 6:The Passu glacier decline between 2016-2026 NDSI. Black color shows the Passu glacier outline in 2016, red color shows the Passu glacier outline in 2026.

Batura glacier inventory derived by geospatial techniques
Glacier inventories for Batura Glacier were generated using NDSI-based classification for 2016, 2021, and 2026. As illustrated in Figure 3, three distinct glacier extents clearly show progressive spatial reduction over time. However, debris-covered regions present significant challenges for accurate boundary delineation due to spectral similarity with surrounding terrain. This limits precise detection of terminus changes in lower glacier sections.
In contrast, clean-ice zones provide clearer spectral signatures, allowing more reliable detection of spatial change. Despite mapping limitations, the overall trend confirms continuous glacier retreat across the study period.
Overlay analysis for batura glacier change detection
Overlay analysis of glacier outlines for 2016 (black) and 2026 (red) is presented in Figure 4, which clearly demonstrates spatial shrinkage of Batura Glacier over time. Although terminus retreat is less distinguishable in debris-covered areas, significant reduction is visible in clean-ice regions. The total calculated glacier area loss of 15km² confirms a consistent long-term retreat trend. These results highlight the importance of multi-temporal overlay techniques for understanding glacier evolution in complex terrain.
Passu glacier inventory and change detection
Three glacier inventories of Passu Glacier were developed using NDSI-based satellite imagery for 2016, 2021, and 2026. As shown in Figure 5, spatial retreat of the glacier is clearly visible across all time periods. Unlike debris-covered glaciers, Passu Glacier has a relatively clean surface, allowing more accurate boundary detection.
The overlay comparison presented in Figure 6 clearly illustrates terminus retreat between 2016 and 2026. The total glacier area loss of 4.4km² confirms an active and continuous shrinking trend. This retreat pattern is strongly associated with increasing regional temperature and reduced precipitation.
Ghulkin glacier inventory
Three glacier inventories of Ghulkin Glacier were generated for the study period, as shown in Figure 7. The glacier exhibits limited visible boundary change due to the presence of thick debris cover, which masks surface variations in optical imagery. As a result, terminus changes are not clearly distinguishable.
Figure 7:Three inventories of the Ghulkin glacier from 2016-2026, shown on (SENTINEL-2, 2026 image, MSI sensor). Black line show glacier boundary extracted by techniques like NDSI. Manual digitization from Google Earth.

However, quantitative analysis indicates a total glacier area loss of 1.9km² between 2016 and 2026, as shown in Figure 8. The slower rate of retreat compared to clean-ice glaciers highlights the insulating effect of debris cover, which reduces direct atmospheric heating and slows ablation processes.
Figure 8:The Ghulkin glacier decline between 2016-2026 NDSI. Black color shows the Ghulkin glacier outline in 2016, red color shows the Ghulkin glacier outline in 2026.

Gulmit glacier inventory
Similarly, three inventories of Gulmit Glacier were derived for 2016, 2021 and 2026 using satellite imagery. As illustrated in Figure 9, glacier boundaries appear relatively stable due to small glacier size and debris influence. Despite limited visual change, quantitative results confirm a gradual decline in glacier extent. The total reduction of 0.6km² between 2016 and 2026 is shown in Figure 10, indicating a slow but continuous retreat trend. This confirms that even small debris-covered glaciers are gradually responding to regional climatic forcing.
Figure 9:Three inventories of the Gulmit glacier from 2016-2026, shown on (SENTINEL-2, 2026 image, MSI sensor). Black line show glacier boundary extracted by techniques like NDSI. Manual digitization from Google Earth.

Figure 10:The Gulmit glacier decline between 2016-2026 NDSI. Black color shows the Gulmit glacier outline in 2016, red color shows the Gulmit glacier outline in 2026.

Statistical analysis
The updated glacier-climate dataset for the period 2016-2026 reveals a clear and consistent relationship between glacier area reduction and climatic variability across the study region (Table 5). Batura Glacier shows a significant decline from approximately 395km² in 2016 to 340km² in 2026, corresponding with an increase in mean temperature from 25.5 °C to 31.5 °C. Although precipitation increased temporarily in 2021 (~192mm), the overall trend indicates climatic instability, with reduced precipitation (~145mm) in 2026 contributing to sustained glacier mass loss. This suggests that short-term precipitation increases are insufficient to offset long-term temperature-driven ablation (Figure 8-10).
Table 5:Glacier area trends vs Climate variables (2016-2026).

Similarly, Passu Glacier exhibits a gradual decline from ~65km² in 2016 to ~61km² in 2026, with a consistent rise in temperature and fluctuating precipitation patterns. The relatively smaller reduction compared to Batura reflects its size and local topographic conditions, although its clean-ice surface makes it more sensitive to temperature increases.
Ghulkin Glacier demonstrates a modest decline from ~27km² to ~25km² over the study period. Despite increasing temperatures, the rate of retreat remains comparatively lower due to the presence of debris cover, which reduces direct solar radiation and limits melting. A similar pattern is observed in Gulmit Glacier, where the area shows minimal fluctuation, decreasing from ~17km² in 2016 to ~16.8km² in 2021 and stabilizing around ~17km² in 2026. This apparent stabilization may be attributed to localized climatic variability and the insulating effect of debris cover.
Overall, the dataset indicates a strong inverse relationship between temperature and glacier area, while precipitation exhibits a non-linear and less dominant influence. The results confirm that rising temperature is the primary driver of glacier retreat in the Hunza region, whereas precipitation variability plays a secondary and more complex role. These findings reinforce the importance of integrating climatic parameters with remote sensing-based glacier monitoring to better understand cryospheric responses under changing environmental conditions (Table 5).
Key climatic interpretation
All four glaciers exhibit a consistent response to climatic variability over the study period, although the magnitude and pattern of change differ depending on glacier characteristics. Larger glaciers such as Batura and Passu demonstrate more pronounced absolute area losses, primarily due to their extensive surface exposure and dynamic ice flow systems, which enhance their sensitivity to atmospheric warming. In contrast, smaller glaciers such as Ghulkin and Gulmit show comparatively slower and more gradual changes, largely influenced by the presence of supraglacial debris that acts as an insulating layer and reduces melt rates. However, despite this moderating effect, these glaciers still display a persistent long-term decline, indicating that debris cover delays but does not prevent glacier recession. The results further suggest that while precipitation exhibits temporal variability and localized influence, rising temperature remains the dominant controlling factor driving glacier retreat in the Hunza region. Consequently, glacier morphology, surface conditions, and debris cover play a secondary yet critical role in regulating the rate and spatial variability of glacier response to ongoing climatic change.
Regression analysis between climate variables and glacier retreat
Linear regression analysis was performed to evaluate the relationship between glacier area change and climatic variables. Results demonstrate a strong negative relationship between glacier area and temperature (R=0.87, p<0.05), indicating that increasing temperature significantly contributes to glacier retreat.
y = -8.52x + 612.4
Here y=glacier area and x=temperature, in contrast, precipitation showed a weaker positive relationship with glacier area variability (R²=0.41), suggesting that precipitation alone does not sufficiently offset temperature-driven glacier loss (Figure 11).
Figure 11:Number of library active users.

Discussion
Debris-covered glaciers exhibited relatively higher uncertainty margins due to spectral confusion with surrounding terrain. The results of this study clearly demonstrate a consistent decline in glacier extent across the Upper Hunza region from 2016 to 2026, indicating a strong and ongoing response of the cryospheric system to climatic variability. The observed retreat in Batura, Passu, Ghulkin, and Gulmit glaciers is primarily driven by increasing air temperatures and decreasing precipitation, which together disrupt glacier mass balance by enhancing ablation while simultaneously reducing accumulation. The increase in mean annual temperature from approximately 25.2 °C in 2016 to 31.8 °C in 2026 represents a critical forcing factor that has accelerated glacier melting across the study area. This warming trend, combined with declining precipitation, has intensified negative mass balance conditions and contributed to sustained glacier shrinkage.
Despite the dominant influence of climate forcing, the magnitude and spatial expression of glacier retreat vary significantly among the studied glaciers due to differences in surface characteristics and morphology. Clean-ice glaciers such as Passu exhibit relatively higher retreat rates, primarily due to direct exposure to solar radiation, which enhances surface melt. In contrast, debris-covered glaciers such as Ghulkin and Gulmit show comparatively slower rates of retreat, as supraglacial debris acts as an insulating layer that reduces heat transfer and limits ablation. However, despite this buffering effect, these glaciers still demonstrate a persistent long-term decline, indicating that debris cover slows but does not prevent glacier recession under sustained warming conditions. These findings highlight that while climatic variability is the principal driver of glacier change, local glacier characteristics play a critical role in modulating response rates.
The integration of multi-temporal satellite data with machine learning-based classification further improved the reliability of glacier mapping, particularly in complex terrain where traditional spectral indices such as NDSI face limitations. Debris-covered zones, in particular, present challenges due to spectral similarity with surrounding terrain, which can lead to classification uncertainty. The application of a Random Forest classifier incorporating spectral and topographic variables enhanced the delineation of glacier boundaries and reduced misclassification errors. This demonstrates the added value of AI-assisted remote sensing approaches in improving cryospheric monitoring accuracy in high mountain environments.
Spatial and statistical analyses further confirm a strong relationship between glacier retreat and climatic variables. The results indicate a clear inverse correlation between glacier area and temperature, and a direct relationship between glacier extent and precipitation. Continued warming trends are therefore expected to intensify glacier recession in the region. These findings are consistent with broader observations across High Mountain Asia, where glacier systems are increasingly responding to rising temperatures and changing precipitation regimes. The observed glacier retreat in the Hunza region has significant implications for downstream water availability, seasonal runoff variability, and longterm hydrological stability. As glacier-fed systems form a critical component of regional water resources, continued monitoring is essential for understanding future climate impacts and supporting adaptive water management strategies.
Conclusion
This study investigated the spatio-temporal changes in glacier extent in the Hunza region, Pakistan, using multi-temporal satellite imagery integrated with geospatial analysis and machine learning techniques within the Google Earth Engine platform. Four major glaciers, including Batura, Passu, Ghulkin, and Gulmit, were analyzed over the period 2016 to 2026 to assess long-term changes in glacier dynamics.
The results demonstrate a consistent and widespread reduction in glacier area across all selected glaciers, confirming a strong influence of regional climatic changes, particularly rising temperature and decreasing precipitation. The Batura Glacier experienced a total area loss of approximately 15km² (~3.56%), while the Passu Glacier lost 4.4km² (~6.79%). Similarly, the Ghulkin Glacier showed a reduction of 1.9km² (~7.01%), and the Gulmit Glacier exhibited a decrease of 0.6 km² (~3.47%). These findings indicate that glacier retreat is ongoing across the region, although the magnitude of change varies depending on glacier size, elevation, and surface characteristics.
The comparative analysis reveals that clean-ice glaciers such as Passu are more sensitive to climatic forcing and exhibit faster retreat rates due to direct exposure to solar radiation. In contrast, debris-covered glaciers such as Ghulkin and Gulmit show relatively slower but continuous decline, highlighting the insulating effect of supraglacial debris. Despite these differences, all glaciers demonstrate a consistent response to regional warming trends.
The study further confirms that the Normalized Difference Snow Index (NDSI), when combined with machine learning approaches such as Random Forest classification, provides an effective and robust framework for glacier mapping and monitoring in complex mountainous terrain. The integration of cloud-based geospatial platforms with AI techniques enables scalable, efficient, and reproducible analysis of cryospheric dynamics. Overall, the observed glacier decline highlights the increasing vulnerability of the Hunza cryosphere to climate change. Continued glacier retreat poses significant risks to freshwater availability, agricultural sustainability, hydropower generation, and downstream ecosystem stability. These findings emphasize the urgent need for continuous monitoring, improved predictive modeling, and the development of climate adaptation strategies to mitigate future hydrological and environmental risks in high mountain regions.
Funding Statement
Not Applicable.
Conflict of Interest
Authors declare that they have no conflict of interest with this publication.
Acknowledgement
The authors would like to express their sincere gratitude to all individuals and departments who contributed to the successful completion of this research. Special thanks are extended to Al- Mussawwir Engineering and Creative Engineering Zone (CEZ) for their technical support and assistance throughout the study. The authors are also highly grateful to S.E. Hussain, Public Health Engineering Department Rawalpindi, for his valuable guidance and support.
References
- Zhang J, Jia L, Menenti M, Zhou J, Ren S (2021) Glacier area and snow cover changes in the range system surrounding Tarim from 2000 to 2020 using google earth engine. Remote Sensing 13(24): 5117.
- Turpo Cayo EY, Borja MO, Espinoza-Villar R, Moreno N, Camargo R, et al. (2022) Mapping three decades of changes in the tropical Andean glaciers using Landsat data processed in the earth engine. Remote Sensing 14(9): 1974.
- Moazzam MFU, Rahman G, Lee BG, Ansari NA (2022) Trend of snow cover under the influence of climate change using google earth engine platform: A case study of Astore (Western Himalayas) and Shigar (Karakoram region). Frontiers in Environmental Science 10: 1006399.
- Ali A, Dunlop P, Coleman S, Kerr D, McNabb RW, et al. (2023) Glacier area changes in Novaya Zemlya from 1986-89 to 2019-21 using object-based image analysis in google earth engine. Journal of Glaciology 69(277): 1305-1316.
- Zhang Q, Zhang Z, Wang X, Xu Z, Wang Y (2024) Monitoring of glacier area changes in the Ili River Basin during 1992-2020 based on google earth engine. Land 13(9): 1417.
- Zhuang L, Ke C, Cai Y, Nourani V (2023) Measuring glacier changes in the Tianshan Mountains over the past 20 years using google earth engine and machine learning. Journal of Geographical Sciences 33(9): 1939-1964.
- Abdioğlu G, Kaya Y, Polat N (2022) Calculation of glacial area change at Cilo Mountain with google earth engine. Intercontinental Geoinformation Days 5: 112-115.
- Li X, Wang N, Wu Y (2022) Automated glacier snow line altitude calculation method using Landsat series images in google earth engine platform. Remote Sensing 14(10): 2377.
- Banerjee P (2025) Long-term monitoring and forecasting of glacial lake dynamics using Landsat time series data, google earth engine, machine learning, and geospatial analysis. Discover Geoscience 3(1): 159.
- Dou X, Fan X, Wang X, Yunus AP, Xiong J, et al. (2023) Spatio-temporal evolution of glacial lakes in the Tibetan Plateau over the past 30 years. Remote Sensing 15(2): 416.
- Ahmad S, Jasrotia AS (2026) Multi-decadal mapping of debris-covered glaciers in the Zanskar Himalaya using Landsat time series on google earth engine. Journal of Earth System Science 135(64).
- Sahu R, Ramsankaran RAAJ, Bhambri R, Verma P, Chand P (2023) Evolution of supraglacial lakes from 1990 to 2020 in the Himalaya-Karakoram region using cloud-based google earth engine platform. Journal of the Indian Society of Remote Sensing 51(12): 2379-2390.
- Singh DK, Singh KK, Petropoulos GP, Boaz PS, Jain P (2023) Spatiotemporal vegetation variability and linkage with snow-hydroclimatic factors in Western Himalaya using remote sensing and google earth engine. Remote Sensing 15(21): 5239.
- Ortiz Diaz I, Lenzano MG, Araneo D (2024) Temporal estimation of snow line altitude in glaciers of the Southern Patagonian Icefield using google earth engine. International Archives of the Photogrammetry, Remote Sensing and Spatial Information Sciences 48: 19-24.
- Wang N, Zhong T, Zheng J, Meng C, Liu Z (2023) Spatio-temporal distribution characteristics of glacial lakes in the Altai Mountains with climate change from 2000 to 2020. Remote Sensing 15(14): 3689.
- Cheng X, Shangguan D, Yang C, Li W, Zhou Z, et al. (2025) Temporal and spatial changes of glacial lakes in the central Himalayas and their response to climate change based on multi-source remote sensing data. Global and Planetary Change 245: 104675.
- Gaddam VK, Ele SL, Bhandari S, Raavi S, Kulkarni A, et al. (2023) Applications of machine learning algorithms via google earth engine interface to interpret snowline altitudes: A case study in Chandra Basin. International Conference on Advances in River Corridor Research and Applications, Springer, Singapore, pp: 243-264.
- Halder S, Bose S (2024) Sustainable flood hazard mapping with GLOF: A google earth engine approach. Natural Hazards Research 4(4): 573-578.
- Chen R, Yang H, Yang G, Liu Y, Zhang C, et al. (2023) Land-use mapping with multi-temporal Sentinel images based on google earth engine in Southern Xinjiang Uygur Autonomous Region, China. Remote Sensing 15(16): 3958.
- Moazzam MFU, Banerjee A, Rahman G, Lee BG (2024) Elevation-dependent climate assessment and its influence on snow cover variability in Hindu Kush Himalayan region using google earth engine for the period 2003-2021. Remote Sensing Applications: Society and Environment 35: 101217.
- Ray A, Raavi S, Gaddam VK, Prasad SK, Ranjan R, et al. (2024) Leveraging machine learning and google earth engine for snowline altitude analysis: Insights from the Parbati Basin, India. International Journal of Geoinformatics 20(9): 54-70.
- de Almeida CR, Garcia N, Campos JC, Alírio J, Arenas-Castro S, et al. (2023) Time-series analyses of land surface temperature changes with google earth engine in a mountainous region. Heliyon 9(8): e18846.
- Melón-Nava A (2024) Recent patterns and trends of snow cover (2000-2023) in the Cantabrian Mountains (Spain) from satellite imagery using google earth engine. Remote Sensing 16(19): 3592.
- Kumar R, Vijay S (2026) Automated satellite-based glacial lake inventory and change detection in high mountain Asia. Scientific Reports 16(5760): 1-17.
- Parvin S, Irannezhad M, Marttila H, Minaei M (2026) MODIS-based assessment of snow cover variability in Iran’s mountain ranges via google earth engine. Social Science Research Network (SSRN), pp: 1-23.
- Chauhan P, Ngangom M (2026) Spatio-temporal analysis of climate-induced multi-hazards in Ladakh using geospatial techniques. Discover Geoscience 4(1): 100.
- Liu H, Wang D, Li T, Yue A, Zhao S, et al. (2026) Glacier boundary extraction and spatiotemporal variation analysis in Geladandong region. PeerJ 14: e20804.
- Dong Y, Chang X (2026) Spatio-temporal analysis of land use and land cover changes: Assessing urban expansion and ecological transformations (2003-2023). GeoJournal 91(2): 40.
- El-Mahdy MES, El-Abd WA, Al-Metwaly WM, El-Kenawy EM, Alharbi AH, et al. (2026) Modeling flood dynamics in the Sudd wetlands using google earth engine and AI models optimized with metaheuristics in a changing climate. Journal of Water and Climate Change 17(3): 637-669.
- Yin M, Li A, Wang S, Ma X, Li N (2026) Spatio-temporal variations in China’s groundwater reservoirs from 2005 to 2024 based on GRACE data. Sustainability 18(6): 2797.
- Huang X, Liu X, Du H, Jin Y, Lin Z, et al. (2026) STAGCNet: A change-aware dual-branch spatio-temporal fusion network for multitemporal land use/land cover classification. Journal of Applied Remote Sensing 20(2): 021413-021413.
- Liu J, Li M, Shalamzari MJ, Xiao J, Ren Y, et al. (2026) A remote sensing-based early warning system for desertification: Monitoring spatiotemporal dynamics and identifying risk zones. Land Degradation & Development, pp: 1-20.
© 2026 Daud Khan. This is an open access article distributed under the terms of the Creative Commons Attribution License , which permits unrestricted use, distribution, and build upon your work non-commercially.
Editor In Chief


.jpg)


Signup for Newsletter

Quick Links
 Editorial Board Registrations
 Submit your Article
 Refer a Friend
 Advertise With Us
Our Recent Edition

.jpg)


Top Editors


.jpg)


.bmp)
.jpg)
.png)
.jpg)


.jpg)


.png)

.png)


.png)


Financial Support

Sponsors

Latest e-Books

Latest Video

 a Creative Commons Attribution 4.0 International License. Based on a work at www.crimsonpublishers.com.
Best viewed in
a Creative Commons Attribution 4.0 International License. Based on a work at www.crimsonpublishers.com.
Best viewed in