
- About Us
- Information
-

The Author ensures that the research has been conducted responsibly and ethically with adherence to all relevant regulations. read more..
- For Authors
- For Reviewer
- Manuscript Guidelines
- Membership
- Publication Ethics
-
- Journals
- Reprints
- e-Books
- Videos
- Policies
- Contact Us
 COVID-19
- Submissions


Full Text
Biodiversity Online J
Spicara Maena Stock Discrimination in Northern Tunisian Waters Drawn on Otolith Shape Analysis
Marwa M1,2*, Sami M2,3, Rym E2, Wided B1, Malek T1, Abdellah C4, Jean PQ1,5 and Monia T1
1 Faculty of Sciences of Tunis, University of Tunis El Manar, Tunisia
2 Higher Institute of Fishery and Aquaculture of Bizerte, University of Carthage, Tunisia
3 Fisheries Science Laboratory, National Institute of Marine Sciences and Technologies, Tunisia
4 Faculty of Sciences, University Campus, Tunisia
5 Laboratory of Ichthyology. University of Montpellier, France
6 Department of Zoology, Faculty of Science, Minia University, Egypt
*Corresponding author:Marwa Mejri, Laboratory of Ecology, Biology and Physiology of Aquatic Organisms (LR/18/ ES/41), Faculty of Sciences of Tunis, University of Tunis El Manar, Tunisia
Submission: October 10,2025; Published: January 26, 2026

ISSN 2637-7082Volume5 Issue 5
Abstract
Sagitta otolith morphology of marine fishes has been used in many eco-morphological studies to explain certain ecological adaptations of species to their habitats. This study focused on otolith shape baselines to evaluate their applicability in discriminating samples of Spicara maena. The studied species samples were caught with artisanal fishing gear from the North Sea of Tunisia (Bizerte). Analysis of variance of the otolith contour revealed that specimens in the investigated zones showed no significant inter-population variability in otolith form. This finding confirms the existence of a single stock of Spicara maena in the northern region of Tunisia.
Keywords: Otolith; Morphology; Fishery; Stock discrimination; Spicara maena
Introduction
The stock concept is one of the most fundamentals in fishery management. With the development of new analytical methods, a growing number of studies have documented the existence of bio-complexity in discrete populations within areas previously considered to have a single stock managed. Mechanical mixing of populations, with limited interbreeding, may result from an overlap in distribution range, for example, due to seasonal spawning/ feeding migrations [1,2]. Failure to take stock mixing into account in fisheries management, particularly when the stocks differ in productivity, may lead to sub-optimal exploitation and ultimately over-fishing of some stock components [3]. Therefore, efficient stock discrimination methods are needed. Several analytical techniques have been used for stock discrimination, ranging from morphometric otolith microstructure analysis [4] and otolith microchemistry [1,2] to molecular tools [5] and otolith shape analyses [6,7]. Because of the high cost associated with molecular tools and thanks to the availability of otolith samples from extensive historical archives in fisheries research institutes, otolith shape analysis has recently gained interest among fisheries biologists. Otolith shape is known to depend on the interplay between genetic and environmental factors [8]. Separation of populations in both time and space induces divergent otolith shape patterns [9]. Consequently, otolith shape analysis can be a powerful tool in fish stock management. It is already implemented in stock assessment for example for North Sea herring. Otoliths are routinely used to determine age and growth in teleost fishes, but the otolith shape is also an important tool in stock management [10].
Indeed, several otolith shape studies have been concerned with stock discrimination [11- 13] and, to a lesser extent, species differentiation [14]. It has been shown that otolith shape is affected by the interplay of environmental, ontogenetic, and genetic influences [8,15]. Therefore, otoliths have both a phenotypic and a genotypic influence, which strengthens their use as a tool in stock discrimination analyses [16]. Otolith shape can be based on identifiable points or landmarks used to describe morphometric measurements such as perimeter, length and width. However, otoliths usually show complex shapes, and a single set of landmarks is often not sufficient to accurately describe their outlines. In the last decade, though, and thanks to advances in image processing technology and computing power, the use of otolith morphometry has received widespread attention. Spicara maena is a commercial species inhabiting the Mediterranean and the Black Sea [17]. It is also found along the European and African coast of the Atlantic Ocean, from Morocco to Portugal and the Canary Islands [17], and very frequently in the western Algerian coastal waters (Figure 1). This species commonly resides on Posidonia beds and sandy or muddy bottoms up to 100m depth [18]. S. maena feeds primarily on zooplankton [19]. It is often caught at depths ranging from 100 to 150m (personal observation) mostly with trawls or trammel nets [20].
Figure 1:Sampling sites of Spicara maena in the north of Tunisia (Zarzouna; Cap Zbib; Ghar El Melh)

Published works on S. maena focused on several aspects including growth, feeding habits, morphological differentiation and molecular differentiation [21-23]. However, investigations of the stock biology of this species remain scarce and limited to reports on Tunisian waters. In North African waters, for instance, works are only concerned with the study of the feeding habits of S. maena. The study aims to discriminate the stock of this species for the first time in the Mediterranean. Blotched picarel Spicara maena fish stock discrimination and assessment were conducted using the shape of sagittal otoliths. Otolith morphology is influenced by biotic and abiotic factors [8] and analysis of the outline of otoliths has previously been used for stock discrimination [6,24-27]. Based on the homogeneous sample collection, this study focuses on three species of samples collected from the northern waters of Tunisia.
Material and Methods
Sampling collection
Table 1:Mean±Standard Deviation (SD) values of the standard length (TL) and ranges of Spicara maena individuals examined from the region of Bizerte: Cap Zbib; Zarzouna and Ghar El Melh.

The samples were collected in the north of Tunisia, particularly in the delegation of Bizerte, in three landing sites: Zarzouna, Ghar El Melh, and Cap Zebib (Figure 1). Simple homogeneous adults, (Same size rang), those that reached sexual maturity (Table 1), were captured with artisanal fishing gear in June 2020 from the northern commercial fishery of Tunisia (Region of Bizerte: S1. Cap Zbib, S2. Zarzouna and S3. Ghar El Melh) (Figure 1). A total of three samples of Spicara maena were collected and measured (total length; TL in mm and total weight; TW in g) (Table 1). The sagittal otoliths were removed, washed, dried and stored in labelled plastic vials. Otoliths from the left side of the fish were oriented with the inner side (sulcus acusticus) up and digitized using a digital camera (Canon IXUS 185 camera) and then passed to an image analyzer. All images included an embedded millimeter scale.
Stock discrimination
Otolith shape analysis: The obtained images of the otoliths (Figure 2) were stored in a database to be processed with the software SHAPE Ver. 1.3. Shape is widely used to analyze the images of the shape of otolith (Figure 1) and to compute their elliptical Fourier descriptors EFDs. The outlines of the contour shape of each otolith were evaluated by Elliptic Fourier Analysis (EFA) as previously described by Mejri [25,28]. The FDs technique describes the outline based on harmonics and generates 17 harmonics per otolith. Each harmonic consists of four coefficients (A, B, C, and D), corresponding to the sine and cosine values of the variation in the X and Y coordinates and resulting in 68 coefficients for each otolith generated by projection of each point of the outline on the X and Y axes (Table 2). The four Fourier Descriptors (FDs) were normalized using the first harmonic to make them constant with changes in size, location, rotation and starting point. After transformation, the first three FDs of the first harmonic were fixed at fixed values (a=0, b=0 & c=0) and were therefore discarded in the analysis. Therefore, each otolith sample was represented by 65 subsequent coefficients. The required number of harmonics for the best reconstruction of the otolith outline, the Fourier Power (FPn), the per cent Fourier Power (FP%), and the cumulative per cent Fourier Power (FPn% cumulative) were calculated according to the following formulas:
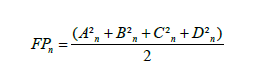
where An, Bn, Cn, and Dn are the Fourier coefficients.
Cumulative percentage of Fourier Power
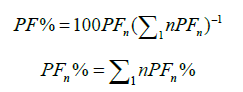
Then, the cumulative Fourier mean power was calculated to fix the number of harmonics. A threshold of 99.99% of the total power was chosen to determine the number of harmonics required.
Figure 2:Scheme showing the procedure for obtaining shape.

Table 2:The number of harmonics required in this study.

Data analysis: Analysis of Variance (ANOVA) was performed to assess the significance of differences in the mean values of Standard Length (SL) between the individuals of the three stations. Values were tested for homogeneity (equality) and normal distribution with Shapiro-Wilks’ λ tests, respectively. Differences in the shape of the left and right otoliths contour from individuals at the three stations were analyzed with non-parametric generalized Discriminant Function Analysis (DFA). The DFA was performed using the normalized elliptical Fourier descriptors coefficients (65 coefficients per otolith) to illustrate the similarities and differences between individuals at the same station and/or across all stations. The objective of the DFA is to check the integrity of pre-defined groups of individuals belonging to the given geographical station or population and the percentage of their correct classification by finding linear combinations of descriptors. This statistic is the ratio between intra-group variance and total variance and it provides an objective method for calculating the corrected percentage chance of agreement. The effects of station location on elliptical Fourier descriptors were first tested by Multivariate Analysis of Variance (MANOVA). The Fisher’s distance and its p-values were also calculated to characterize differences in the shape of the otolith within and between individuals at all stations. All these statistical analyses were performed using XLSTAT 2010.
Result
Stock discrimination
Intra-population comparison: The variability of otolith shape was analyzed for each sampled species from the three stations: Cap Zbib (CZ); Zarzouna (Z) and Ghar El Melh (GM) (Table 3). The p-values of the Fisher distances test revealed a shape asymmetry within the individuals of Cap Zbib samples (p-value <0.05) and a symmetry within the individuals of Zarzouna and Ghar El Melh samples (p-value 0.34; p-value=0.83).
Table 3:Test du Lambda de Wilks (approximation de Rao).

Intra-population comparison
Shape variability within the same sides of otoliths: right-right and left-left between the three sampled areas’ individuals: Cap Zbib (CZ), Zarzouna (Z) and Ghar El Melh (GM) (Table 4) confirmed, with p-values of Fisher distances, that no significant difference existed between Cap Zbib and Zarzouna samples (CZL-ZL; CZR -ZR). In addition, a shape symmetry was observed between Ghar El Melh and Zarzouna samples with (p=0.06; p=0.6). Additionally, no significant difference was identified between the same sides of the otolith of fishes from Cap Zbib and Ghar El Melh station. The DFA confirmed that fish from the three samples were discriminated against by the two axes F1 and F2 (Figure 3). The asymmetry between the right and left sides of S. maena species was expressed by a positive DFA axis 1 for the left sides and a negative DFA for most of the right sides, respectively. These factors together explain 59.12% of changes in shape symmetry on the DFA axes 1 and 2, both supporting a non-significant effect on this variability.
Table 4:P values of file distances built on an intra and inter populational comparison of otoliths between samples.

Figure 3:DFA depicting association between shape variability and sampling sites. Eigen values of the first two axes are indicated by 1 and 2. (R) Right sides of the Sagitta otolith of S. maena, (L) left sides in Cap Zbib (CZ), Zarzouna (Z) and Ghar El Melh (GM).

Discussion
Stock discrimination
In this study, the otoliths from S. maena provide a basis for qualitative and quantitative otolith morphology analyses of this species. Our sampling was restricted to adult fish to avoid the sexual maturity effect, which can modify the outline contour of otoliths [8]. Actually, the complexity of the otolith outline increases with the ontogenetic stage of the fish. To limit this effect, sampling can be restricted to a specific life stage and/or to a narrow length range. If these factors are not taken into account, the results of otolith shapebased stock discrimination might be biased. In order to obtain more credible results, all the analyses in this study were carried out on adults of 250-265mm total length within a limited size range. In this case; all individuals were caught by artisanal fishing gear. These findings may require additional independent surveys to evidence geographic and environmental physicochemical parameters between marine stations. The discriminator function analysis showed no differences between the three stocks of S. maena when the same sides (right-right/left-left) of otoliths were compared (p<0.05). The results of the intra-population variation indicated the existence of an asymmetry between (Right/Left) otoliths within the stock of Cap Zbib. In addition, symmetry was detected between the otoliths of Zarzouna and Ghar El Melh stock.
Fish otolith shape from different geographical origins is affected by both abiotic environmental parameters, for example, temperature and salinity as well as biotic ones, such as prey availability. Besides, it is dependent on individual genotypes [8,27,29]. Consequently, a combination of both environmental and genetic variation generates the morphological differences in otolith shape that may allow the discrimination of stock units. However, the factors that influence the shape are not fully understood and have not been investigated deeply yet. A recent study showed that the ontogenetic trajectory of otolith shape could be affected by environmental disturbance during the early life stage [29]. Other studies have attributed shape differences to fish length [30], age [31], year class [11], sexual maturity [8], and sexual dimorphism [11]. In our case, the otolith morphological similarity between the samples of the three marine stations of Cap Zebib, Zarzouna and Ghar El Melh may be due to the resemblance of the environmental quality (temperature, movements of water masses, depth, etc.) of the studied stations [32-35].
Conclusion
Otolith shape analysis revealed no significant morphological differences among Spicara maena from Cap Zebib, Zarzouna, and Ghar El Melh, suggesting the presence of a single stock in the studied area. The observed similarity in otolith morphology is likely related to homogeneous environmental conditions and shared circulation patterns in the Mediterranean Sea [36-39]. Although otolithbased approaches provide valuable insights into stock structure, the results should be interpreted cautiously due to spatial and methodological limitations. Future studies integrating genetic analyses, otolith microchemistry, and broader spatial-temporal sampling are recommended to confirm population connectivity and support sustainable fisheries management.
Acknowledgement
At the end of this work, we would like to thank mainly the heads of the fishing districts of the northern region of Tunisia as well as Sabri JAZIRI and the fishermen for their cooperative efforts. We also appreciate the contribution of the ISPAB technicians to the laboratory work. On behalf of all authors, the corresponding author states that there is no conflict of interest
References
- Campana SE, Chouinard GA, Hanson JM, Fréchet A, Brattey J (2000) Otolith elemental fingerprints as biological tracers of fish stocks. Fish Res 46: 343-357.
- Campana SE, Valentin A, Sévigny JM, Power D (2007) Tracking seasonal migrations of redfish (Sebastes spp) in and around the Gulf of St Lawrence using otolith elemental fingerprints. Can J Fish Aquat Sci 64: 6-18.
- Heath MR, Culling MA, Crozier WW, Fox CJ, Gurney WSC, et al. (2013) Combination of genetics and spatial modelling highlights the sensitivity of cod (Gadus morhua) population diversity in the North Sea to distributions of fishing ICES. J Mar Sci 71(4): 794 807.
- Mosegaard H, Madsen KP (1996) Discrimination of mixed herring stocks in the North Sea using vertebral counts and otolith microstructure. ICES CM, pp. 1-8.
- Nielsen EE, Cariani A, Mac A, Mae GE, Milano I, et al. (2012) Gene-associated markers provide tools for tackling illegal fishing and false eco-certification. Nat Com 3: 851.
- Rebaya M, Ben FA, Allaya H, Khedher M, Marsaoui B, et al. (2016) Morphological variability of saccular otoliths in two populations of Liza ramada (Risso., 1810) (Mugilidae) in Tunisian lagoons (Bizerte and Ghar El Melh). Cahiers de Biologie Marine 57: 227-234.
- Mejri M, Trojette M, Jmil I, Chalh A, Quignard JP, et al. (2020) Fluctuating asymmetry in the otolith shape, length, width and area of Pagellus erythrinus collected from the Gulf of Tunis. Cah Biol Mar 61: 1-7.
- Cardinale M, Doering AP, Kastowsky M, Mosegaard H (2004) Effects of sex, stock, and environment on the shape of known-age Atlantic cod (Gadus morhua) otoliths. Can J Fish Aquat Sci 61:158-167.
- Lombarte A, Lleonart J (1993) Otolith size changes related with body growth, habitat depth and temperature. Environ Biol Fish 37: 297-306.
- Hüssy K (2008) Otolith shape in juvenile cod (Gadus morhua): Ontogenetic and environmental effects. J Exp Mar Biol Ecol 364(1): 35-41.
- Bolle LJ, Begg GA (2000) Distinctions between silver hake (Merluccius bilinearis) stocks in US waters of the northwest Atlantic based on whole otolith morphometric. Fish Bull 98: 451-462.
- Libungan L, Slotte A, Husebø Å, Godiksen JA, Pálsson S (2015b) Latitudinal gradient in otolith shape among local populations of Atlantic herring (Clupea harengus L) in Norway. PLoS ONE 10(6): e0130847.
- Renan X, Montero MJ, Garza JR, Brule T (2016) Age and stock analysis using otolith shape in gags from the southern Gulf of Mexico. Trans Am Fish Soc 145: 1252-1265.
- Salimi N, Loh KH, Dhillon SK, Chong VC (2016) Fully automated identification of fish species based on otolith contour: Using short-time fourier transform and discriminant analysis. (STFT-DA). Peer J 4: e1664.
- Hussy K, Mosegaard H, Albertsen CM, Nielsen EE, Hemmer HJ, et al. (2016) Evaluation of otolith shape as a tool for stock discrimination in marine fishes using Baltic Sea cod as a case study. Fish Res 174: 210-218.
- Ladroit YO, Maolagain C, Horn PL (2017) An investigation of otolith shape analysis as a tool to determine stock structure of ling (Genypterus blacodes). pp. 1-20.
- Fischer W, Bauchot ML, Schneider M (1987) FAO species identification sheets for fisheries purposes. Mediterranean and Black Sea 2: 761-1530.
- Soykan O, İlkyaz AT, Metin G, Kinacigil HT (2010) Growth and reproduction of blotched picarel (Spicara maena, 1758) in the central Aegean Sea. Turkey Turkish Journal of Zoology 34(4): 453-459.
- Froese R, Pauly D (2017) Fish base world wide web electronic publication.
- Kadari G (1984) Fishing techniques used in Algeria, p. 134.
- Cicek E, Avsar D, Ozyurt CE, Yelda H, Ozutok M (2007) Population characteristics and growth of Spicara maena inhabiting in babadillimani bight (Northeastern Mediterranean-Turkey). Int J Eng Sci1: 15-18.
- Mesnil B (1980) Theory and practice of cohort analysis, p. 48.
- Minos G, Imsiridou A, Katselis G (2013) Use of morphological differences for the identification of two picarel species Spicara flexuosa and Spicar amaena (Pisces: Centracanthidae). Mediterr Mar Sci 14(3): 26-31.
- Begg GA, Brown RW (2000) Stock identification of haddock melanogrammus aeglefinus on georges bank based on otolith shape analysis. Trans Am Fish Soc 129(4): 935-945.
- Mejri M, Trojette M, Allaya H, Ben FA, Jmil I, et al. (2018b) Stock Discrimination of two local populations of Pagellus erythrinus (Actinopterygii, Sparidae, Perciformes) in Tunisian waters by analysis of otolith shape. Cahier de Biologie Marine 59: 579-587.
- Ben LM, Mejri M, Shahin AAB, Quignard JP, Trabelsi M, et al. (2020a) Stock discrimination of the bogue Boops boops (Actinopterygii, Sparidae) form two Tunisian marine lagoons using the otolith shape. Acta Ichthyol Piscat 50: 413-422.
- Ben LM, Mejri M, Shahin AAB, Quignard JP, Trabelsi M, et al. (2020b) Otolith fluctuating asymmetry in Boops boops (Actinopterygii, Sparidae) from two marine lagoons (Bizerte and Kelibia) in Tunisian waters. J Mar Biolog Assoc 100: 1135-1146.
- Mejri M, Trojette M, Allaya H, Ben FA, Jmil I, et al. (2018a) Use of otolith shape to differentiate two lagoon populations of Pagellus erythrinus (Actinopterygii: Perciformes: Sparidae) in Tunisian waters. Acta Ichthyol Piscat 48: 153-161.
- Vignon M, Morat F (2010) Environmental and genetic determinant of otolith shape revealed by a non-indigenous tropical fish. Mar Ecol Prog Ser 4 (11): 231-241.
- Mérigot B, Letourneur Y, Lecomte FR (2007) Characterization of local populations of the common sole solea solea (Pisces, Soleidae) in the NW Mediterranean through otolith morphometrics and shape analysis. Marine Biology 151: 997-1008.
- Bird JL, Eppler DT, Checkley DM (1986) Comparison of herring otoliths using fourier series shape analysis. Can J Fish Aquat Sci 43: 1228-1234.
- Braicovich PE, Timi JT (2008) Parasites as biological tags for stock discrimination of the Brazilian flathead Percophis brasiliensis in the southwest. Atlantic J Fish Biol 73: 557-571.
- Chevaillier P, Laurec A (1990) Software for fish stock assessment ANALEN: Software for analyzing catch data by size class and simulating multi-gear fisheries with sensitivity analysis. FAO 101(4): 124.
- Elliott NG, Haskard K, Koslow JA (1995) Morphometric analysis of orange roughy (Hoplostethus atlantics) off the continental slope of southern. Australia J Fish Biol 46: 202-220.
- Jarboui O (2004) Stock assessment and ecobiology of the main shellfish species of the Tunisian coast. Final report INSTM/FAO-CopeMed, p. 50.
- Jones R (1983) The use of length composition data in fish stock assessments (with notes on VPA and cohort analysis). FAO Fish Cire 734: 60.
- Karakulak FS, Bilgin B, Zengin M, Erk H (2007) Blotched picarel, Spicara maena L 1758, in the trammel and gillnet catches in the Aegean Sea (Turkey). Rapp Comm Int Mer Med 38: 511.
- Laurec A, Guen JC (1981) Dynamics of exploited marine populations.
- Mili S, Ennouri R, Khoufi W, Troudi D, Guesmi B (2022) The fishery for the mandole spicara maena in the northern region of Tunisia: dynamics and state of exploitation. Bull Inst Natn Scien Tech Mer de Salammbô 47: 11-27.
© 2026 Marwa M. This is an open access article distributed under the terms of the Creative Commons Attribution License , which permits unrestricted use, distribution, and build upon your work non-commercially.
Editor In Chief


.jpg)


Signup for Newsletter

Quick Links
 Editorial Board Registrations
 Submit your Article
 Refer a Friend
 Advertise With Us
Our Recent Edition

.jpg)


Top Editors


.jpg)


.bmp)
.jpg)
.png)
.jpg)


.jpg)


.png)

.png)


.png)


Financial Support

Sponsors

Latest e-Books

Latest Video

 a Creative Commons Attribution 4.0 International License. Based on a work at www.crimsonpublishers.com.
Best viewed in
a Creative Commons Attribution 4.0 International License. Based on a work at www.crimsonpublishers.com.
Best viewed in