
- About Us
- Information
-

The Author ensures that the research has been conducted responsibly and ethically with adherence to all relevant regulations. read more..
- For Authors
- For Reviewer
- Manuscript Guidelines
- Membership
- Publication Ethics
-
- Journals
- Reprints
- e-Books
- Videos
- Policies
- Contact Us
 COVID-19
- Submissions


Full Text
Aspects in Mining & Mineral Science
Characterization and Purification of Natural Rutile from Madagascar Applied to the Synthesis of Calcium Titanate
Rakotonjanahary T1,2*, Mohamed H2, Rasolofoson N1, Ranaivoson RT1 and Gibaud A2*
1INSTN Madagascar, Madagascar
2IMMM, France
*Corresponding author:Tokimandimby Rakotonjanahary and Alain Gibaud, INSTN Madagascar, BP 3907 Antananarivo 101, Madagascar and IMMM, UMR 6283 CNRS, Bd O. Messiaen, 72085 Le Mans Cédex 09, France
Submission: August 20, 2025: Published: December 09, 2025

ISSN 2578-0255Volume14 Issue 4
Abstract
This study outlines an effective approach to purifying natural rutile from the Ambatofinandrahana deposit in Madagascar and subsequently transforming it into calcium titanate through solid-state synthesis. Treatment of the raw mineral with concentrated hydrochloric acid significantly eliminated unwanted secondary phases, such as hematite and montroseite, as confirmed by various analytical techniques including X-ray diffraction, scanning electron microscopy, infrared spectroscopy, and X-ray photoelectron spectroscopy. The synthesis of CaTiO₃ at 1100 °C, utilizing the purified rutile as a source and calcium carbonate as a supplement, resulted in the formation of a single-phase calcium titanate, demonstrating the effectiveness and suitability of the implemented approach. The structural, morphological, and surface chemical characteristics of all materials were comprehensively investigated using advanced analytical methods. Furthermore, dielectric measurements on the synthesized CaTiO₃ revealed stable permittivity and low dielectric loss over a wide frequency range, suggesting its potential for electronic applications.
Keywords:Rutile; Calcium titanate; Purification; Solid-state reaction; Characterization; Dielectric properties
Introduction
Rutile, a titanium dioxide mineral, possesses remarkable physicochemical properties that make it suitable for a wide range of industrial applications, including photocatalysis, pigmentation, and electronics [1]. In its natural form, rutile is also an important source of metallic titanium, which is extensively used in industries such as aerospace, automotive, geophysics, and biomedical surgery [2]. Additionally, it serves as a precursor for the synthesis of piezoelectric materials like calcium titanate and barium titanate, which are critical in technologies such as medical imaging, ultrasound devices, and intravascular imaging systems [3]. The Ambatofinandrahana deposit in Madagascar (source: mindat.org) is one of the country’s most significant rutile reserves and represents a valuable opportunity for local resource development. However, the presence of impurities particularly iron and vanadium oxides limits its direct use in high-tech applications. To make this rutile suitable for advanced material synthesis, a purification step is necessary. This study investigates the purification of natural rutile ore using concentrated hydrochloric acid (37%) a straightforward yet efficient method for removing unwanted mineral phases [4]. Producing high-purity rutile is essential for its use as a starting material in the fabrication of compounds such as calcium titanate (CaTiO₃) or metallic titanium.
Calcium titanate (CaTiO₃), first identified in 1839 by German mineralogist Gustav Rose, is a perovskite-type oxide widely employed in electronics and as a component of synroc, a synthetic rock for nuclear waste containment [5]. Thanks to its unique dielectric, optical, and structural characteristics, CaTiO₃ has garnered considerable attention for its applications in microwave technologies. It exhibits a high dielectric constant, low loss factor, and a notable temperature coefficient of resonant frequency, making it ideal for devices such as filters, resonators, and antennas [6-10]. Beyond electronics, CaTiO₃ shows promise in photocatalytic degradation of pollutants [11] and, due to its chemical and thermal stability, is also used in nuclear waste management [12]. In the biomedical domain, CaTiO₃ coatings on titanium alloys have shown potential to enhance biocompatibility by promoting apatite formation through calcium ion release, thereby improving bone integration [13]. Calcium titanate (CaTiO₃) is also being investigated for its potential in photovoltaic applications, particularly in solar cell technologies [14]. Additionally, it serves as an effective host matrix for luminescent materials such as phosphors and lasers, especially when doped with rare earth elements [15]. Its utility extends further into sensor manufacturing [16]. Different synthetic routes have been developed to produce CaTiO₃ [17], each with specific advantages and limitations. The solid-state reaction method, a conventional technique, involves mixing calcium and titanium oxides and heating the mixture to high temperature, which requires prolonged heating and significant energy input to achieve phase purity. In contrast, the co-precipitation method involves dissolving calcium and titanium precursors in solution, then simultaneously precipitating them. The resulting precipitate is calcined to form CaTiO₃, allowing for improved control over stoichiometry and particle size [18]. The sol-gel technique, which uses alkoxide precursors, enables the production of fine, highpurity powders through hydrolysis, condensation, drying, and calcination [19]. The hydrothermal method achieves crystalline CaTiO₃ at relatively low temperatures by reacting precursors in water under high pressure and temperature [20]. Spray pyrolysis involves atomizing a precursor solution into a heated chamber, where the droplets decompose to form CaTiO₃ particles with controlled morphology [21]. Mechanochemical synthesis, which uses ball milling to trigger solid-state reactions, can reduce the required calcination temperatures [22].
This study adopts a two-step process: first, the purification of natural rutile ore from Madagascar using acid leaching; second, the synthesis of calcium titanate via high-temperature solid-state reaction. The solid-state route remains the most traditional and widely employed method in industrial ceramic production due to its simplicity, cost-effectiveness, and scalability [23]. It involves the intimate mixing of oxide or carbonate powders followed by thermal treatment to induce the desired chemical transformation. This approach not only supports large-scale production but also allows for the direct use of purified natural rutile as the titanium source, thereby lowering production costs and promoting the local valorization of Malagasy mineral resources.
Experimental Methods
Characterization techniques
Electron microscopy was conducted using a ZEISS GEMINI SEM 560 scanning electron microscope operated under high vacuum at an accelerating voltage of 20kV. Elemental composition analysis was performed using an energy-dispersive X-Ray Spectroscopy (EDS) system equipped with a Silicon Drift Detector (SDD), enabling qualitative and semi-quantitative identification of elements present in the sample.
The crystallinity and structural properties of the materials were examined by X-Ray Diffraction (XRD) using an Empyrean diffractometer fitted with a Cu Kα radiation source (λ=1.54059 Å). The measurements were carried out at 40kV and 40mA, over an angular range of 2θ for 20° to 80°, with a step size of 0.02° and a counting time of 100 seconds per step. A 256-channel PixE detector was employed for data collection. The resulting diffraction patterns were analyzed using the Rietveld refinement method implemented in MAUD software version 2.9996 (source: https://luttero.github. io/maud/). Data visualization and further analysis were performed using OriginPro 2024 (source: https://www.originlab.com/2024). The crystal structures were modeled and visualized using VESTA version 3.90.5a (source: https://jp-minerals.org/vesta/en), which provided detailed structural interpretation of the XRD data.
Fourier-Transform Infrared (FTIR) spectroscopy was used to identify functional groups present in the sample. Spectra were collected in the range of 400-4000cm-1 with a resolution of 4cm- 1 and averaged over 32 scans to enhance the signal-to-noise ratio. Raman spectroscopy was used to analyze vibrational modes and confirm structural phases. Measurements were performed using an XPLORA Raman spectrometer with a 532nm laser excitation. The spectral range spanned 120-2000cm-1. Laser power was maintained between 1 and 5mW to prevent thermal alteration of the sample. Spectra were acquired using a 50×objective in backscattering geometry, with an integration time of 10-60 seconds and an average of 15 accumulations. The system’s spectral resolution ranged from 1 to 2cm-1. sufficient to resolve subtle vibrational features.
Diffuse reflectance measurements were conducted using a JASCO V-750 UV-Visible spectrophotometer, covering the wavelength range of 200-900nm. A total of 701 data points were recorded with consistent sampling, ensuring reliable spectral resolution. Reflectance data were expressed as a percentage versus wavelength in nanometers. The optical band gap was estimated using the Tauc plot method, which derives the band gap from the absorption edge in the reflectance spectra. Spectral data from FTIR, Raman, and UV-Vis analyses were processed using OriginPro 2024 software. A polynomial baseline correction was applied to each spectrum to enhance band identification accuracy. Absorption and vibrational bands were assigned based on comparison with literature-reported reference spectra, including commercial anatase from Alfa Aesar, rutile obtained by thermal transformation of anatase at 900 °C for 8 hours [24], and calcium titanate synthesized from purified rutile.
Characterization of raw natural rutile
Natural rutile sourced from the Ambatofinandrahana deposit was first mechanically ground into a fine powder to facilitate subsequent purification. Scanning electron microscopy, (Figure 1a) revealed a heterogeneous morphology, with a broad particle size distribution and an average particle size of approximately 8.25μm. Energy-dispersive X-Ray Spectroscopy (EDX) analysis, (Figure 1b) confirmed titanium and oxygen as the major elements, consistent with the TiO₂ composition of the sample. However, trace amounts of iron, silicon (Figure 1c), and vanadium were also detected, indicating the presence of mineral impurities in the raw material. X-ray diffraction analysis (Figure 1d) showed that the dominant crystalline phase is rutile-type TiO₂ (~73.92%), accompanied by secondary phases identified as hematite (Fe₂O₃, ~4.97%) and montroseite (VO(OH)₂, ~21.09%). These results confirm the multiphase nature of the natural ore.
Figure 1:(a) Scanning electron microscopy analysis of natural rutile (b) EDX analysis of raw natural rutile (c) Infrared spectrum of raw natural rutile (d) X-ray diffraction results of raw natural rutile obtained by Rietveld refinement.

Fourier-Transform Infrared (FTIR) spectroscopy further supported the structural analysis. Characteristic Ti-O stretching vibrations were observed between 500 and 750cm-1 corresponding to rutile structure [25]. An additional absorption band in the range of 950-1025cm-1 was attributed to montroseite, confirming the presence of vanadium-bearing impurities [26]. Broad bands between 3000 and 3400cm-1 were associated with adsorbed water, while features between 2300 and 2500cm-1 indicated surface hydroxyl groups [27]. Overall, the results demonstrate that the raw mineral is predominantly composed of TiO₂ in the rutile form but contains notable amounts of iron and vanadium impurities. These impurities could hinder their direct use in advanced applications, highlighting the need for a purification step [4].
Purification of natural rutile
The chemical purification of the natural rutile powder was performed using 37% concentrated hydrochloric acid, applying a solid-to-liquid ratio of 1:10 (g/mL). The resulting suspension was magnetically stirred at 500rpm and maintained at a constant temperature of 70 °C for 3 hours. Following the reaction, the suspension was cooled to room temperature, then vacuum-filtered using a Büchner funnel. The residue was thoroughly washed with distilled water until a neutral pH was achieved, ensuring the removal of residual acid. The purified solid was subsequently dried in a ventilated oven at 70 °C for 2 hours. For comparison purposes, a reference rutile sample was prepared by thermally converting commercial anatase (Alfa Aesar) via calcination. The anatase powder was placed in a muffle furnace and heated to 900 °C at a ramp rate of 5 °C/min, followed by an 8-hour isothermal hold under ambient air conditioning. This thermal treatment facilitates the complete phase transformation from anatase to rutile, as reported in the literature [28]. After calcination, the sample was allowed to cool slowly to room temperature before undergoing structural and compositional characterization, enabling a direct comparison with the purified natural rutile.
Synthesis of calcium titanate
Purified rutile was used as a source of titanium for the synthesis of calcium titanate. Calcium carbonate was used as the calcium precursor. The reactants were mixed in a 1:1 molar ratio and ground manually in an agate mortar for 30 minutes. The formation of CaTiO₃ results from a solid-state reaction between titanium dioxide and calcium carbonate. During calcination, calcium carbonate thermally decomposes at 700 °C according to the following process [29]:
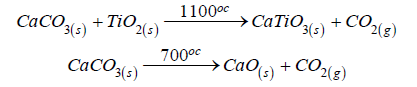
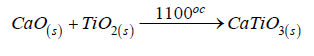
The calcium oxide formed then reacts with titanium dioxide at high temperature to form calcium titanate according to the following overall equation [30]:
This reaction requires a sufficient activation temperature to allow the diffusion of solid species and the growth of the perovskite phase. The mixture was then placed in a porcelain crucible and calcined in a furnace at a temperature of 1100 °C for 8 hours, with a heating rate of 5 °C/min. After cooling in air, the product is successively washed with distilled water, then treated with a dilute acetic acid solution. This treatment allows the elimination of any unreacted CaO traces, and the product is then dried at 70 °C in an oven for 2 hours [31]. The corresponding neutralization reaction is as follows:
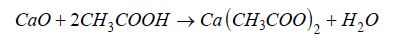
The calcium acetate formed is soluble in water, which facilitates its elimination during rinsing [32]. This mild treatment is preferred to the use of strong mineral acids in order to avoid any attack or alteration of the crystallized CaTiO₃ phase. It contributes to increasing the purity of the final product and ensuring the reproducibility of the structural properties. Another approach for the synthesis of calcium titanate was implemented using rutile obtained from Alfa Aesar anatase as a source of titanium [18]. This synthetic rutile was finely ground and stoichiometrically mixed with calcium carbonate. The mixture was then homogenized by mechanical grinding in an agate mortar for 30 minutes and then calcined at 1100 °C for 8 hours under ambient atmosphere, with a heating rate of 5 °C/min. During this heat treatment, the decomposition of calcium carbonate releases carbon dioxide, allowing the reaction with TiO₂ to form calcium titanate. The high temperature promotes the diffusion of calcium and titanium ions, leading to the formation of the perovskite structure of CaTiO₃ [30,31,33,34]. The products obtained by this method were also characterized and their results compared with those of calcium titanate synthesized from purified natural rutile.
Result and Discussion
Characterization of purified natural rutile
The morphology of the particles (Figure 2a) of purified rutile observed by scanning electron microscopy reveals a relatively homogeneous particle size distribution, with irregularly shaped particles and an average size of approximately 3.87 μm. The EDX results (Figure 2b) show a significant decrease in undesirable elements such as iron, silicon, and especially vanadium, indicating an effective removal of impurities thanks to the hydrochloric acid treatment [4]. X-ray diffraction analysis after Rietveld refinement of the purified rutile (Figure 2c) revealed characteristic peaks at 2θ angles that correspond to the crystallographic planes, confirming that the rutile phase is the only one present [35]. The absence of secondary signals testifies to the effectiveness of the acid treatment to eliminate undesirable phases (Figure 3a), thus attesting to its efficiency. Rietveld refinement confirmed a tetragonal structure (Figure 3b) with the P42/mnm space group, characteristic of rutile. The lattice parameters of this rutile phase revealed values of a=4.5995 Å and c=2.9627 Å [36].
Figure 2:(a) SEM images of the purified rutile (b) EDX spectra of the purified natural rutile (c) XRD pattern of the purified rutile.

Figure 3:(a) Comparison of the crystalline phases of purified and synthesized rutile by calcination of anatase at 900 °c (b) Tetragonal structure of the purified rutile.

The X-ray diffractograms reveal notable differences between the purified natural rutile and the rutile synthesized from anatase. The rutile obtained by calcination of anatase shows intense and relatively narrow peaks, indicating good crystalline quality and a larger crystallite size (Figure 3a). In contrast, the purified natural rutile also shows the same characteristic peaks, but with slightly lower intensity, suggesting a smaller crystallite size. This lower intensity can be attributed to the presence of residual impurities or crystal defects from the natural ore, which alter the long-range order in the crystal lattice [37]. These differences highlight the influence of the synthesis conditions on the crystal structure and the quality of the final material. The lattice parameters and atomic positions obtained after Rietveld refinement are presented in Table 1 & 2 below.
Table 1:Lattice parameters of the purified rutile after rietveld refinement. Rwp(%)=8.4053; Rb (%)=6.3909; Rexp(%)=5.7880.

Table 2:Rietveld analysis of atomic positions in the purified rutile.

The infrared spectroscopy analysis of the purified (Figure 4a) rutile revealed notable differences compared to the raw sample. The FTIR spectrum shows characteristic stretching bands of the Ti- O-Ti bonds, particularly around 500cm-1 and 700cm-1 as well as a band around 2300cm-1 related to the adsorption of water molecules on the surface [35]. Moreover, the signals corresponding to VO bonds around 950-1025cm-1 disappeared, indicating an effective purification of the rutile. The results obtained are consistent with the spectra reported for titanium dioxide in the rutile form, synthesized by thermal transformation of anatase at a temperature of 900 °C. Titanium dioxide in the form of rutile has a tetragonal crystal structure belonging to the P4₂/mnm space group, giving the material specific vibrational properties. Using factor analysis based on group theory, we can identify the normal modes of vibration at the center of the Brillouin zone, which are represented by the expression:
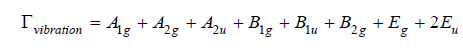
Among these modes, only three are infrared active: A2u and two Eu modes, the others being Raman active or optically inactive. The A2u and Eu modes involve relative displacements between the Ti4+ cations and the O²⁻ anions, inducing changes in the dipole moment necessary for the absorption of infrared radiation. The A2u mode corresponds to a polar longitudinal vibration along the c crystallographic axis, while the two Eu modes degenerate and manifest as vibrations in the plane perpendicular to this axis. The corresponding absorption bands typically appear in the regions of 235 to 450cm-1 for the Eu modes, and around 500-700cm-1 for the A2u mode [25]. These spectral characteristics constitute a distinctive vibrational signature of rutile.
Raman spectroscopy (Figure 4b) confirmed the rutile structure of titanium dioxide, revealing characteristic peaks around 143.240.450 and 610cm-1. In Raman spectroscopy, only vibrational modes inducing a variation in the polarizability of the crystal lattice are active. Among the vibrational modes decomposed according to group theory, only the A1g, B1g, B2g and Eg modes are Raman active. Thus, ideal rutile has four active Raman modes: A1g, B1g, B2g and Eg [38,39]. The Eg mode is associated with symmetric bending vibrations in the basal plane, while the A1g mode corresponds to symmetric stretching vibrations of the oxygen atoms along the c-axis. The B1g and B2g modes involve angular deformations of the oxygen atoms [40,41]. The Raman spectra obtained on the purified rutile show well-defined and narrow peaks, confirming the high crystallinity and purity of the rutile phase. The positions of these peaks are consistent with the values reported in the literature for single-crystal rutile [42]. Furthermore, these results are in agreement with the spectra published for titanium dioxide in the rutile form, obtained by thermal transformation of anatase at 900 °C. The consistency between the X-ray diffraction, infrared spectroscopy and Raman spectroscopy data unequivocally confirms the rutile structure of the purified material.
The UV-Vis absorption spectrum (Figure 4c) of the purified rutile shows strong absorption in the ultraviolet region, with an abrupt absorption edge around 400nm. The Tauc method was used to estimate the band gap energy of the purified rutile. The reflectance was transformed into an absorption coefficient using the Kubelka-Munk function:
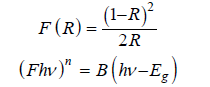
where R represents the reflectance and B is a constant characteristic of the material. Then, (F*hv)2 was plotted as a function of the photon energy hv. The value of n=2 corresponds to a direct band gap transition [43]. The linear portion was extrapolated to(F*hv)2=0. The intersection of the line with the abscissa axis provides an estimate of the band gap energy. The analysis of the UVVis spectrum by the Tauc method (Figure 4d) allowed evaluating the band gap width of the purified rutile at around 3.00eV [44]. This strong UV absorption is attributed to a charge transfer transition involving the transfer of electrons from the O2p valence orbitals to the Ti3d conduction orbitals, which is characteristic of semiconductors [45,46]. This value is in agreement with the typical values reported for single-crystal rutile [47]. The UVVisible diffuse reflectance spectroscopy analysis allowed studying the optical properties of the purified natural rutile and the rutile synthesized from anatase. Both samples show strong absorption in the ultraviolet, with an absorption edge characteristic of TiO₂ in the rutile phase around 410nm. The evolution of the squared Kubelka- Munk function as a function of the photon energy according to the Tauc method was plotted, allowing to estimate the band gap values: 3.00eV for the purified natural rutile and 3.08eV for the synthesized rutile. The slight decrease in the band gap energy in the case of the synthesized rutile is attributed to the introduction of structural defects and reduced crystallite size during the transformation from anatase to rutile.
Figure 4:(a) SEM image of the synthesized Calcium Titanate (b) EDX spectra of calcium titanate (c) XRD pattern of calcium titanate (d) Orthorhombic structure of synthesized Calcium Titanate obtained on VESTA.

Characterization of synthesized calcium titanate
Figure 5a shows SEM images revealing agglomerated particles with irregular morphology. The typical particle size is approximately 9.02μm. Energy dispersive X-Ray Spectroscopy (EDX) confirms the presence of Calcium (Ca), Titanium (Ti), and Oxygen (O), with an atomic Ca/Ti ratio close to 1 consistent with the stoichiometric composition of CaTiO₃. Additional elements detected, such as Iron (Fe), Silicon (Si), Sulfur (S), and Aluminum (Al) (Figure 5b), are attributed to impurities originating from the rutile precursors used in the synthesis. X-Ray Diffraction (XRD) analysis of the synthesized material (Figure 5c) reveals that the dominant crystalline phase is calcium titanate (CaTiO₃) [48-52], with a calculated phase content of approximately 98.88%. Minor secondary peaks corresponding to rutile TiO₂ are also observed, particularly around 2θ=27.40° and 36.23°, representing about 1.12% of the crystalline composition. These residual peaks indicate a slight incomplete transformation of the TiO₂ precursor during synthesis. The XRD signals match well with those expected for the orthorhombic structure of CaTiO₃, as reported in literature references [5,11,53], (Figure 5d). The lattice parameters determined for the CaTiO₃ phase are a=5.3851Å, b=5.4429Å, and c=7.6457Å, which are consistent with published reference data [31]. The detailed crystallographic information, including lattice parameters and atomic positions obtained via Rietveld refinement, is summarized in Table 3 & 4.
Figure 5:(a) SEM image of the synthesized Calcium Titanate (b) EDX spectra of calcium titanate (c) XRD pattern of calcium titanate (d) Orthorhombic structure of synthesized Calcium Titanate obtained on VESTA.

Table 3Rietveld refinement of the lattice parameters of the synthesized CaTiO3. Rwp(%)=6.2802; Rb(%)=4.2616; Rexp(%)=3.2114.

Table 4:Rietveld refinement of the atomic positions of the synthesized CaTiO3.

Comparison of TiO₂ precursors
Figure 6 presents XRD patterns comparing calcium titanate synthesized using purified natural rutile and rutile derived from the calcination of anatase. In both cases, the diffraction patterns exhibit peaks characteristic of the orthorhombic CaTiO₃ phase, confirming successful synthesis. The similar intensity and peak width observed in both diffractograms suggest that the crystalline size and crystallite size are comparable for the two samples. Notably, the sample synthesized from purified rutile shows additional lowintensity peaks attributed to residual rutile, indicating a slightly incomplete conversion of the precursor material. Nevertheless, the overall structural quality of the CaTiO₃ synthesized from both TiO₂ sources appears equivalent, demonstrating that the origin of the TiO₂ precursor has a minimal impact on the final crystallographic properties of the product.
Figure 6:Comparison of XRD spectra of CaTiO3 synthesized from different TiO2 precursors.

The FTIR spectroscopy analysis highlighted the characteristic vibrational modes of the CaTiO₃ crystal lattice. The absorption bands observed between 500 and 600cm-1 are associated with the stretching vibrations of the Ti-O bonds, while the bands located between 800 and 900cm-1 are related to the valence vibrations of the Ca-O bonds. The bands situated between 250 and 500cm-1 correspond to the angular deformation vibrations of the Ti-O-Ti type. The presence of these spectral signals confirms the formation of the perovskite structure of CaTiO₃ [4]. In this crystal structure, the factor group analysis predicts a total of 25 infrared-active vibration modes, distributed according to the irreducible representations:
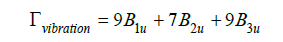
These modes are mainly associated with the internal vibrations of the TiO₆ octahedra and the translations of the Ca²⁺ and Ti4⁺ ions. The B1u modes involve asymmetric stretching vibrations of the Ti-O bonds in the region of 500 to 750cm-1, while the B3u modes correspond to the angular deformation vibrations of the Ti-OTi type in the range of 250 to 500cm-1. The B1u modes are related to the valence vibrations of the Ca-O bonds in the frequencies between 800 and 900 cm-1 [54,55]. These results are in agreement with previous studies on the characteristic vibrations of the CaTiO₃ perovskite structure [17].
The infrared spectra of the two CaTiO₃ samples, synthesized respectively from natural rutile sourced from Madagascar and rutile derived via the calcination of anatase, exhibited general similarities, affirming the formation of the CaTiO₃ perovskite phase in both instances. Nevertheless, discernible differences were observed in specific characteristic bands. Both spectra presented the absorption bands typical of the perovskite lattice, most notably the Ti-O stretching vibrations situated between 500 and 700cm-1. However, the sample originating from natural rutile displayed marginally broader and less resolved bands, indicative of a greater degree of structural disorder or the presence of residual crystalline imperfections. Conversely, the sample synthesized from calcined rutile manifested sharper bands and a subtle shift toward higher frequencies, suggesting enhanced crystallinity and a more pronounced interaction between the Ca²⁺and TiO₆ ions (Figure 7). These disparities may be attributed to the initial purity of the titanium oxides employed and the nature of the impurities inherent in the natural rutile. Consequently, while both synthesis routes facilitate the production of the CaTiO₃ phase, the methodology utilizing calcined rutile appears to promote a more ordered structure at the atomic level.
The Raman spectrum of CaTiO₃ (Figure 7b) shows typical peaks in the range of 150-750cm-1. Among the most characteristic modes are those around 157, 184, 230, 250, 298, 337, 473 and 685cm-1, associated with Ca-O vibrations and TiO₆ octahedral rotations. The modes between 320 and 530cm-1 correspond mainly to the bending and stretching vibrations of the Ti-O bonds, while the higher frequencies, from 580 to 750cm-1, are attributed to the internal symmetric and asymmetric vibrations of the TiO₆ octahedron. These results are consistent with data reported in the literature for CaTiO₃, confirming the formation of the perovskite structure [5,56,57]. However, the sample from natural rutile presents more intense and sharper Raman peaks, indicating better crystallinity and a low concentration of structural defects. In contrast, the CaTiO₃ prepared from the synthesized rutile shows a broadening of the bands and a slight decrease in intensity, suggesting a more disordered crystal structure and the possible presence of local distortions of the lattice.
Figure 7:(a) IR spectra of the synthesized Calcium Titanate (b) Raman spectrum of calcium titanate synthesized at 1100 °C (c) UV-Visible reflectance spectrum of the synthesized Calcium Titanate (d) Determination of the band gap energy of CaTiO3 by the Tauc method.

The UV-Visible diffuse reflectance spectrum of pure calcium titanate shows an absorption edge around 380 nm. Applying the Tauc method with the Kubelka-Munk function F=(kα)²/2s, where kα is the absorption coefficient, s is the scattering coefficient, and hν is the photon energy, we were able to determine the value of n=2 corresponds to a band gap transition [58,59]. From this analysis, we estimated that the band gap energy of the synthesized calcium titanate is around 3.3eV. This value is consistent with the data reported in the literature for calcium titanate [16,60]. The UV-Visible diffuse reflectance spectra of the CaTiO₃ samples synthesized from natural rutile and from rutile obtained by anatase calcination display optical behaviors typical of perovskite materials based on titanate, further confirming the successful synthesis of the desired compound. In both cases, strong absorption is observed in the ultraviolet region, characteristic of valence band to conduction band transitions primarily involving O2p and Ti3d orbitals. The sample prepared from the calcined rutile exhibits an absorption edge slightly shifted towards shorter wavelengths, indicating a widening of the band gap estimated at approximately 3.62eV, compared to 3.25eV for the sample derived from natural rutile. This variation strongly suggests that the higher purity of the rutile obtained via calcination leads to a more defined electronic structure in the resulting CaTiO₃. The improved crystalline and a lower presence of defects or impurities in the sample synthesized from the calcined rutile directly contribute to this enhanced optical property. The possible presence of trace elements in the natural rutile likely introduces intermediate energy levels within the band gap, thereby reducing the optical gap. These results convincingly demonstrate that the quality of the TiO₂ precursor significantly influences the optical properties of the final CaTiO₃ product, which may critically impact its effectiveness in photocatalytic or optoelectronic applications. The higher band gap observed for the sample from calcined rutile suggests a potentially superior performance in applications requiring high energy excitation, underscoring the importance of precursor purity in material synthesis.
Dielectric characterization of calcium titanate
The dielectric performance, representing the capacity of a material to store electrical energy under an electric field, is a crucial property for electronic applications such as capacitors, sensors, and energy storage devices. In this work, the dielectric characteristics of synthesized calcium titanate were investigated using a broad band dielectric spectrometer with a high-performance frequency analyzer, enabling detailed analysis across a broad range of frequencies and temperatures. The samples were prepared as dense ceramic pellets, 10mm in diameter and 0.71mm thick. To ensure optimal electrical contact with the measuring electrodes and minimize contact resistance, both sides of the pellets were metallized by dry pressing with a thin layer of gold powder. Dielectric measurements were conducted in a frequency span from 0 Hz to 107 Hz, and for temperature at 20 °C, 40 °C, 80 °C and 100 °C. To quantitatively analyze the frequency-dependent behavior of the material, the experimental data of ε′ and ε″ were fitted to the Cole-Cole model using python software containing the matplotlib, numpy and scipy libraries, with custom functions defined for the real and imaginary components of the complex permittivity:
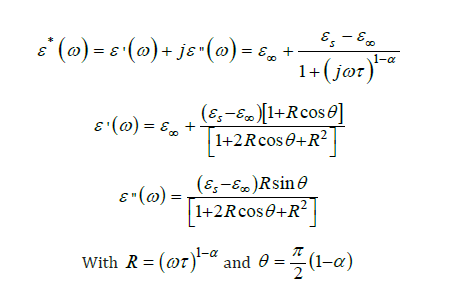
Where is the static permittivity, ε∞ the high-frequency permittivity, ω=2π f the angular frequency, τ the relaxation time and α the distribution parameter (0≤𝛼< 1) .
Figure 8:(a) Fit of eps’ for CaTiO3 at 20 °C according to the Cole-Cole model (b) Fit for eps’’ of CaTiO3 at 20 °C according to the Cole-Cole model (c) Fit of eps’ for CaTiO3 at 40 °C according to the Cole-Cole model (d) Fit for eps’’ of CaTiO3 at 40 °C according to the Cole-Cole model.

Figure 8a illustrates the frequency dependence of the real part of the dielectric permittivity of CaTiO₃ at 20 °C. The experimental data reveal a notable reduction in ε′ as frequency increases, consistent with dielectric relaxation phenomena. At lower frequencies (≈0.1-10Hz), the permittivity (eS) attains a maximum value of approximately 125. Dipoles have sufficient time to align with the applied field, resulting in strong polarization, reflecting the complete response of slower polarization mechanisms, including interfacial and dipolar polarization with 𝛼 parameter equal to around 0.15 . Conversely, at elevated frequencies (>10⁴Hz), ε′ converges to a stable value (ε∞) of around 75 indicatives of the highfrequency permittivity limit where dipoles are unable to maintain synchronicity with the oscillating electric field. The response of the polarization mechanisms becomes partial or delayed, leading to a reduction in the dielectric constant. The transition region (≈ 1-10⁴ Hz) reveals the dielectric relaxation of the material. The good fit by the red curve indicates that the Cole-Cole model is relevant for this material. This Cole-Cole model accurately fits the empirical data, suggesting a non-ideal relaxation process characterized by a distribution of relaxation times around 0.5s . This behavior shows that CaTiO₃ has relaxor-like dielectric properties, highlighting that CaTiO₃ is a high permittivity ceramic material for applications in electronic components such as multilayer ceramic capacitors.
The frequency-dependent behavior (Figure 8b) of the imaginary part of the dielectric permittivity (ε′′) of CaTiO₃ at 20 °C was analyzed to investigate the dielectric loss characteristics of the CaTiO3 material. These data reveal that ε′′ exhibits high values (~80) at lower frequencies (≈0.1Hz), indicating substantial energy dissipation, usually attributed to interfacial polarization or charge carrier mobility. At medium frequency (≈1 Hz to 10⁴ Hz), it decreases sharply, reflecting a dielectric relaxation which means that the response of the material no longer follows the applied field, which is characteristic of a relaxation process in polarizable materials. With increasing frequency (>10⁵Hz), ε′′ is very low (close to zero), the losses are negligible, so the material does not follow the rapid variations of the field well [61-65]. The Cole-Cole model provided a good fit to the experimental data (Figure 8c), suggesting that the dielectric relaxation in CaTiO₃ is not a pure Debye type but rather a distributed relaxation. This is supported by the non-zero broadening parameter α around 0.15 potentially resulting from material heterogeneities. At higher frequencies, the imaginary part tends to zero, indicating minimal losses, as the polarization mechanisms cannot keep up with the rapidly changing external field. These results demonstrate the complex dielectric behavior of CaTiO₃, characterized by a strong frequency dependence. The other results following this Cole-Cole adjustment model for temperatures of 40 °C, 80 °C and 100 °C are also important (Figure 8d). The following Table 5 summarizes the evolution of dielectric losses and relaxation behavior as a function of temperature, highlighting the changes in loss amplitude, relaxation time and position of the loss peak.
Table 5:Evolution of the cole-cole model parameters (εs, ε∞, τ) as a function of the CaTiO3 temperature.

Conclusion
Purified natural rutile from Madagascar and calcium titanate (CaTiO₃) were successfully synthesized via a solid-state reaction method. The purification of rutile was accomplished through a combination of chemical and thermal treatments, effectively removing impurities and yielding high-purity TiO₂ powder (Figure 9). X-Ray Photoelectron Spectroscopy (XPS) confirmed the successful synthesis of calcium titanate, providing detailed insights into its chemical composition and electronic structure. X-Ray Diffraction (XRD) analysis verified the orthorhombic crystal structure of the synthesized CaTiO₃, with lattice parameters consistent with reported reference data [5,33]. Infrared (IR) spectroscopy revealed characteristic vibrational modes of Ti-O and Ca-O bonds, further confirming the formation of the perovskite structure. Raman spectroscopy identified vibrational modes associated with TiO₆ octahedra and Ca²⁺ cations, corroborating the crystalline nature of CaTiO₃. Scanning Electron Microscopy (SEM) showed a homogeneous morphology of CaTiO₃ particles, with an average size of approximately 9.02μm [66-70].
Dielectric characterization demonstrated a significant increase in static permittivity with rising temperature, indicative of enhanced dipole polarization, while the relaxation time decreased, confirming a thermally activated relaxation process. These findings highlight the potential of the synthesized CaTiO₃ for applications in solar cells, capacitors, and catalysts [12,31,33]. The calcination temperature was found to play a crucial role in the formation of the perovskite phase, with higher temperatures favoring grain growth through enhanced solid-state diffusion [12,33,71,72]. XRD remains an essential technique for phase identification and differentiation, and careful sample preparation is critical for reproducibility. Further investigation of the electrical, optical, and magnetic properties of CaTiO₃ would provide valuable information for its technological applications. The solid-state synthesis method used here is economical and allows precise compositional control [12,33,71].
This study on the synthesis of calcium titanate from Malagasy rutile opens promising perspectives for Madagascar’s economic and technological development. By adding value through local processing of mineral resources transforming raw rutile into high- value materials like CaTiO₃ Madagascar could create jobs and stimulate its economy. Given calcium titanate’s potential in solar cells and photocatalysis [73,74], investing in research and development for renewable energy applications is highly advisable. Moreover, considering the environmental impact of mining activities, calcium titanate and related titanates have shown promise in photocatalytic degradation of pollutants, offering sustainable solutions for environmental remediation [75,76]. Finally, this study lays a foundation for further research into advanced materials, potentially attracting investment and fostering innovation in electronics, sensors, and biomedical devices [77].
Figure 9:(a) Fit of eps’ for CaTiO3 at 80 °C according to the Cole-Cole model (b) Fit for eps’’ of CaTiO3 at 80 °C according to the Cole-Cole model (c) Fit of eps’ for CaTiO3 at 100 °C according to the Cole-Cole model (d) Fit for eps’’ of CaTiO3 at100 °C according to the Cole-Cole model.

Acknowledgement
The authors express their gratitude to the Erasmus+ KA171 mobility program for its financial and institutional support. They extend their sincere thanks to Alain Gibaud and Sandy Auguste for their scientific supervision and expertise in X-ray diffraction analyses. The authors also thank Frederic Amiard for access to infrared and Raman spectroscopy equipment. They further thank Mohamed Tabellout for his assistance with dielectric spectroscopy measurements, Anthony Rousseau for his technical support in scanning electron microscopy and energy-dispersive X-ray spectroscopy, and Agnès Ranger for her constant guidance and support throughout the experimental work.
References
- Dong G, Xiao X, Zhang L, Ma Z, Bao X, et al. (2010) Preparation and optical properties of red, green and blue afterglow electrospun nanofibers. Journal of Materials Chemistry 21(7): 2194-2203.
- Rutile Applications.
- https://vvmineral.com/content/rutile-applications.
- Zaszczyńska A, Gradys A, Sajkiewicz P (2020) Progress in the applications of smart piezoelectric materials for medical devices. Polymers 12(11): 2754.
- Rossignol C, Cadoret L, Verelst M, Dexpert‐Ghys J, Caussat B (2006) Characterization morphologique et structurale de dépôts de silicium sur poudres réalisés par CVD en lit fluidisé.
- Cavalcante LS, Marques VS, Sczancoski JC, Escote MT, Joya MR, et al. (2008) Synthesis, structural refinement and optical behavior of CaTiO3 powders: A comparative study of processing in different furnaces. Chemical Engineering Journal 143(1-3): 299-307.
- Ming Z, Zhao K, Huang Y (2021) Influence of different milling process on the properties of CaTiO3-NdAIO3 dielectric ceramics and its microwave devices. IOP Conference Series Materials Science and Engineering p. 52002.
- Huang CL, Chen JY, Li BJ (2011) Effect of CaTiO3 addition on microwave dielectric properties of Mg2(Ti95Sn0.05)O4 ceramics. Journal of Alloys and Compounds 509(11): 4247-4251.
- Zhao F, Yue Z, Zhang Y, Gui Z, Li L (2005) Microstructure and microwave dielectric properties of Ca[Ti1−x(Mg1/3Nb2/3)x]O3 Journal of the European Ceramic Society 25(14): 3347-3352.
- Yoon SO, Kim DM, Shim SH, Park JK, Kang KS (2006) Microwave dielectric properties of Ca(Li1/4Nb3/4) O3-CaTiO3 ceramic systems. Journal of the European Ceramic Society 26(10-11): 2023-2026.
- Shen CH (2010) A new low-loss dielectric using CaTiO3-modified (Mg95Mn0.05)TiO3 ceramics for microwave applications. Journal of Alloys and Compounds 499(1): 48-52.
- Manik SK, Pradhan SK (2004) Microstructure characterization of ball milled prepared nanocrystalline perovskite CaTiO3 by Rietveld method. Materials Chemistry and Physics 86(2-3): 284-292.
- Patil BM, Srinivasa RS, Dharwadkar SR (2007) Synthesis of CaTiO3 from calcium titanyl oxalate hexahydrate (CTO) as precursor employing microwave heating technique. Bulletin of Materials Science 30(3): 225-229.
- Wei D, Zhou Y, Jia D, Wang Y (2007) Formation of CaTiO3/TiO2 composite coating on titanium alloy for biomedical applications. Journal of Biomedical Materials Research Part B Applied Biomaterials 84(2): 444-451.
- Passi M, Pal B (2021) A review on CaTiO3 photocatalyst: Activity enhancement methods and photocatalytic applications. Powder Technology 388: 274-304.
- Huang Y, Wu CH, Aronstam RS (2010) Toxicity of transition metal oxide nanoparticles: Recent insights from in vitro Materials 3(10): 4842-4859.
- Shivaram M, Hari Krishna R, Nagabhushana H, Sharma SC, Nagabhushana BM, et al. (2013) Synthesis, characterization, EPR and thermoluminescence properties of CaTiO3 Materials Research Bulletin 48(4): 1490-1498.
- Vijayakumar N, Venkraman SK, Imthiaz S, Drweesh AE, Koppala S, et al. (2023) Synthesis and characterization of calcium and magnesium-based oxides and titanates for photocatalytic degradation of rhodamine B: A comparative study. Scientific Reports 13.
- Aung SS, Wai T, Thin NHM, Myat ZM (2020) Synthesis and characterization of calcium titanate (CaTiO3) powder for photovoltaic application 18(2B):
- Pfaff G (1994) Synthesis of calcium titanate powders by the sol-gel process. Chemistry of Materials 6(1):
- Łencka MM, Riman RE (1995) Thermodynamics of the hydrothermal synthesis of calcium titanate with reference to other alkaline-earth titanates. Chemistry of Materials 7(1): 18-25.
- Lanfredi S, Storti F, Simões L, Djurado E, Nobre MAL (2017) Synthesis and structural characterization of calcium titanate by spray pyrolysis method. Materials Letters 201: 148-151.
- Fauzi F, Habieb AM, Noviyanto A, Kusumaningrum R, Sukmarani G, et al. (2020) The effect of mechanochemical on the formation of calcium titanate (CaTiO3) prepared by high energy milling. IOP Conference Series Materials Science and Engineering.
- Redjimi I, Boulanouar R (2015) Synthèse de nouveaux matériaux de type PZT accordables pour applications industrielles.
- Murad E (2003) Raman and X-ray diffraction data on anatase in fired kaolins. Clays and Clay Minerals 51(6): 689-692.
- Arcila JF, Hincapié AF (2013) Structural characterization of mineral with rutile inclusions (TiO2) and manganocolumbite (MnNb2O6) by means of X-ray. Journal of Physics Conference Series 466:
- Forbes PBC, Dubessy J (1988) Characterization of fresh and altered montroseite [V, Fe]OOH. A discussion of alteration processes. Physics and Chemistry of Minerals 15(5): 438-445.
- Pentrák M, Bizovská V, Madejová J (2012) Near-IR study of water adsorption on acid-treated montmorillonite. Vibrational Spectroscopy 63: 360-366.
- Hwang K, Lee JW, Yoo SJ, Jeong S, Jeong DH, et al. (2013) Fine size-regulation of nanocrystalline anatase- TiO2 via sol-gel synthesis and subsequent phase transformation by calcination. New Journal of Chemistry 37(5): 1378-1384.
- Razali MH, Ahmad-Fauzi MN, Mohamed AR, Sreekantan S (2014) Effect of calcination temperature on the morphological and phase structure of hydrothermally synthesized copper ion doped TiO2 Advanced Materials Research 1024: 7-10.
- Vukotić VM, Radojević N, Živković L, Vuković Z, Stojanović BD (2005) Mechanically activated synthesis of CaTiO3 from mixture of CaO and TiO2. Materials Science Forum 494: 393-398.
- Rongsawat S, Bunma W, Chanadee T (2020) In Situ combustion synthesis in air of calcium titanate powders using minerals as a calcium source. Materials Science Forum 982: 20-25.
- Wang Y, Guo LY, Fang HZ, Zou WL, Yang YM, et al. (2017) An in vitro study on the efficacy of removing calcium hydroxide from curved root canal systems in root canal therapy. International Journal of Oral Science 9(2): 110-116.
- AbdulKareem SK, Ajeel SA (2021) Effect of annealing temperatures on the structural and crystalline properties of CaTiO3 powder synthesized via conventional solid-state method. Materials Today Proceedings 42(5): 2674-2679.
- Pfaff G (1992) Peroxide route to synthesize calcium titanate powders of different composition. Journal of the European Ceramic Society 9(4): 293-299.
- Bhullar S, Gupta S, and Goyal N (2020) Investigating TiO2 at two different calcination temperatures. AIP Conference Proceedings 2220: 20065.
- Murugesan S, Kuppusami P, Mohandas E (2010) Rietveld X-ray diffraction analysis of nanostructured rutile films of titania prepared by pulsed laser deposition. Materials Research Bulletin 45(1): 6-9.
- Garcı́a-Ruiz A, Morales A, Bokhimi X (2010) Morphology of rutile and brookite nanocrystallites obtained by X-ray diffraction and rietveld refinements. Journal of Alloys and Compounds 495(2): 583-587.
- Matossi F (1951) The vibration spectrum of rutile. The Journal of Chemical Physics 19(12): 1543-1546.
- Huang Y, Pollak FH (1982) Raman investigation of rutile RuO2. Solid State Communications 43(12): 921-924
- Yamada‐Kaneta H (2001) Vibrational energy levels of oxygen in silicon up to one-A2u-phonon plus one-A1g-phonon states. PhysiCa B: Condensed Matter 302-303:172-179.
- Normal Modes of Vibration.
- Mazza T, Barborini E, Malani P, Cattaneo D, Ducati C, et al. (2007) Raman spectroscopy characterization of TiO2 rutile nanocrystals. Phys Rev B 75: 045416.
- Li Y, Liao C, Tjong SC (2020) Recent advances in zinc oxide nanostructures with antimicrobial activities. International Journal of Molecular Sciences 21(22): 8836.
- Sekiya T, Igarashi M, Kurita S, Takekawa S, Fujisawa M (1998) Structure dependence of reflection spectra of TiO2 single crystals. Journal of Electron Spectroscopy and Related Phenomena 92(1-3): 247-250.
- Michalska-Domańska M, Prabucka K, Czerwiński M (2023) Modification of anodic titanium oxide bandgap energy by incorporation of tungsten, molybdenum, and manganese in situ during anodization. Materials 16(7): 2707.
- Gesenhues U (2007) The effects of plastic deformation on band gap, electronic defect states and lattice vibrations of rutile. Journal of Physics and Chemistry of Solids 68(2): 224-235.
- Mahdi EM, Shukor MHA, Meor YMS, Wilfred P (2012) Characterization of titania nanoparticles synthesized by the hydrothermal method with low grade mineral precursors. Journal of Nano Research 21: 71-76.
- Ruus R, Kikas A, Saar A, Ausmees A, Nõmmiste E, et al. (1997) Ti2p and O 1s X-ray absorption of TiO2 Solid State Communications 104(4): 199-203.
- Atuchin VV, Kesler VG, Pervukhina NV, Zhang Z (2006) Ti2p and O 1s core levels and chemical bonding in titanium-bearing oxides. Journal of Electron Spectroscopy and Related Phenomena 152(1-2): 18-24.
- Diebold U, Madey TE (1996) TiO2 by XPS. Surface Science Spectra 4(3): 227-231.
- Kurtz RL, Henrich VE (1998) UHV-Cleaved single crystal Ti2O3 (101¯2) by UPS and XPS. Surface Science Spectra 5(3): 182.
- Herman GS, Gao Y, Tran TT, Osterwalder J (2000) X-ray photoelectron diffraction study of an anatase thin film: TiO2(001). Surface Science 447(1-3): 201-211.
- Sindhu M, Ahlawat N, Sanghi S, Agarwal A, Dahiya R, et al. (2012) Rietveld refinement and impedance spectroscopy of calcium titanate. Current Applied Physics 12(6): 1429-1435.
- Casu A, Lamberti A, Stassi S, Falqui A (2018) Crystallization of TiO2 nanotubes by in situ heating TEM. Nanomaterials 8(1): 40.
- Ocaña M, Serna CJ (1991) Variations of the infrared powder spectra of TiO2 and SnO2 (rutile) with polarization. Spectrochimica Acta Part A: Molecular Spectroscopy 47(6): 765-774.
- Wang Y, Zhong W, Wang C, Zhang P (2001) First principles study on the optical properties of cubic CaTiO3. Physics Letters A 291(4-5): 338-342.
- Wang YX, Zhong WL, Wang CL, Zhang PL (2011) Electronic structure and properties in perovskite CaTiO3 from first principle. 259(1): 127-132.
- Hoang LT, Nguyen TD, Lee T (2025) Microwave-assisted synthesis of Pd/g-C3N4 for enhanced photocatalytic degradation of sulfamethoxazole. Inorganics 13(4): 118.
- Ghobadi N (2013) Band gap determination using absorption spectrum fitting procedure. International Nano Letters 3: 2.
- Balachandran U, Eror NG (1982) Laser-induced Raman scattering in calcium titanate. Solid State Communications 44(6): 815-818.
- Popescu FF, Grecu VV (1973) EPR study of Zn+ in calcite. Solid State Communications 13(7): 749-751.
- Frait Z (1983) Surface studies of amorphous metallic glass by magnetic resonance (Resonance surface studies of Fe40Ni40B20). Journal of Magnetism and Magnetic Materials 35(1-3): 37-42.
- Jan JC, Krishna Kumar KP, Chiou JW, Tasi HM, Shih HL, et al. (2003) Effect of the Ca content on the electronic structure of Pb1−xCaxTiO3 Applied Physics Letters 83(16):3311-3313.
- Demri B, Muster D (1995) XPS study of some calcium compounds. Journal of Materials Processing Technology 55(3-4): 311-314.
- Yajima T, Takeiri F, Aidzuet K, Akamastu H, Fujita K, et al. (2015) A labile hydride strategy for the synthesis of heavily nitridized BaTiO3. Nature Chemistry 7(12): 1017-1023.
- Mazzanti S, Manfredi G, Barker AJ, Savateev A, Giusto P et al. (2021) Carbon nitride thin films as all-in-one technology for photocatalysis. ACS Catalysis 11(17): 11109-11116.
- Chen G, Chen J, Song Z, Srinivasakannan C, Peng J (2014) A new highly efficient method for the synthesis of rutile TiO2. Journal of Alloys and Compounds 585: 75-77.
- Zhang LP, Li M, Diebold U (1998) Characterization of caimpurity segregation on the TiO2(110) surface. Surface Science 412-413: 242-251.
- Asokan K, Jan JC, Chiou JW, Pong WF, Tasi MH, et al. (2004) The electronic structure of Ba1−xCaxTiO3 probed by X-ray absorption spectroscopy. Journal of Solid-State Chemistry 177(8): 2639-2643.
- Turi B (1970) Carbon and oxygen isotopic composition of carbonates in limestone blocks and related geodes from the black pozzolans formation of the Alban Hills. Chemical Geology 5(3): 195-205.
- Karthikeyan C, Thamima M, Karuppuchamy S (2020) Structural and photocatalytic property of CaTiO3 Materials Science Forum 979: 169-174.
- Croker DM, Loan M, Hodnett BK (2009) Kinetics and mechanisms of the hydrothermal crystallization of calcium titanate species. Crystal Growth & Design 9(5): 2207-2213.
- Liu SL, Xiang J (2014) Technique status and prospect of synthetic rutile. Advanced Materials Research 887-888: 639-642.
- Liang Y, Liu W, Ding H, Zhang H, Li W (2021) Rutile-perovskite multi-phase composite by mechano-chemical method together with calcination: Preparation and application in coatings and ceramic glaze. Ceramics International 47(2):2261-2269.
- Wang H, Li X, Zhao X, Li C, Song X, et al. (2022) A review on heterogeneous photocatalysis for environmental remediation: From semiconductors to modification strategies. Chinese Journal of Catalysis (Chinese Version) Elsevier BV 43(2): 178-214.
- Tasisa YE, Sarma TK, Krishnaraj R, Sarma S (2024) Band gap engineering of titanium dioxide (TiO2) nanoparticles prepared via green route and its visible light driven for environmental remediation. Results in Chemistry 11: 101850.
© 2025 Rakotonjanahary T And Gibaud A. This is an open access article distributed under the terms of the Creative Commons Attribution License , which permits unrestricted use, distribution, and build upon your work non-commercially.
Editor In Chief


.jpg)


Signup for Newsletter

Quick Links
 Editorial Board Registrations
 Submit your Article
 Refer a Friend
 Advertise With Us
Our Recent Edition

.jpg)


Top Editors


.jpg)


.bmp)
.jpg)
.png)
.jpg)


.jpg)


.png)

.png)


.png)


Financial Support

Sponsors

Latest e-Books

Latest Video

 a Creative Commons Attribution 4.0 International License. Based on a work at www.crimsonpublishers.com.
Best viewed in
a Creative Commons Attribution 4.0 International License. Based on a work at www.crimsonpublishers.com.
Best viewed in