

- About Us
- Information
-

The Author ensures that the research has been conducted responsibly and ethically with adherence to all relevant regulations. read more..
- For Authors
- For Reviewer
- Manuscript Guidelines
- Membership
- Publication Ethics
-
- Journals
- Reprints
- e-Books
- Videos
- Policies
- Contact Us
 COVID-19
- Submissions



Full Text
Annals of Chemical Science Research
Comparative Mechanical Characterization of Commercial Tissue Papers by Tensile Strength, Tensile Index, Elongation, and Work-to- Rupture Analysis
Katerina Chryssou* and Eugenia Lampi
General Chemical State Laboratory, B’ Chemical Division of Athens, Department A’ Tsocha 16, Greece
*Corresponding author:Katerina Chryssou, General Chemical State Laboratory, B’ Chemical Division of Athens, Department A’ Tsocha 16, 11521 Athens, Greece
Submission: October 23, 2026;Published: November 13, 2026

Volume5 Issue4November 13, 2026
Abstract
The mechanical performance of commercial tissue paper products is a critical quality parameter affecting consumer perception, handling characteristics, and service performance. In the present study, six commercially available tissue paper products were evaluated according to ISO 12625-4 using tensile testing in both machine direction (MD) and cross direction (CD). The tensile strength, tensile index, elongation at break, work-to-rupture, and tensile energy absorption capacity were evaluated in both the machine direction (MD) and cross direction (CD), from multiple replicate measurements. Significant differences were observed among the investigated tissue products, reflecting variations in fiber orientation, paper structure, basis weight, and manufacturing conditions. Overall mean tensile strength was 127.21N/m in MD compared with 51.58N/m in CD, corresponding to an approximately 2.47-fold directional difference, confirming the anisotropic nature of tissue papers. Tensile indices ranged approximately between 1 and 4Nm g-1 depending on product type and testing direction. The work-to-rupture values followed similar trends, indicating that stronger tissue papers generally exhibited improved energy absorption characteristics. One-way ANOVA demonstrated differences among products for tensile strength, tensile index, work capacity, work-to-rupture, and strain at break (p≤0.002). A two-way factorial ANOVA further demonstrated significant effects of product, testing direction, and their interaction on tensile strength, with partial eta-squared values of 0.685, 0.842 and 0.401, respectively. The two-way analysis of variance indicated significant effects of product (product: F(5,228)=99.221, p<0.001), direction (direction: F (1,228) =1218.711, p<0.001) and their interaction (product x direction: F(5,228)=30.517, p<0.001). The model explained 89.1% of the observed variance (R2=0.891; adjusted R2=0.886). The interaction indicated that the magnitude of directional dependence differed among commercial products. The findings demonstrated that tensile strength and related deformation and energy-absorption parameters provided complementary measures for distinguishing tissue paper products and that machine-direction fiber orientation was a major determinant of their mechanical performance..
Keywords:Tissue paper; Tensile strength; Machine direction; Cross direction; Tensile index; Mechanical properties; Fiber orientation; Work-to-rupture; ISO 12625; Paper characterization; Anisotropy
Introduction
Tissue paper products constitute an important category of sanitary and household materials used in everyday applications including personal hygiene, household cleaning, food service operations, where a combination of softness, absorbency, strength, extensibility, and resistance to rupture is required. Although tissue products are generally lightweight materials, their mechanical behavior is determined by the structure of the fibrous network and by the manufacturing conditions under which the sheet is formed and dried. The performance of tissue products depends strongly on their mechanical properties, which are influenced by fiber type, refining conditions, sheet structure, basis weight and manufacturing processes [1,2].
Among the various quality parameters, tensile strength is one of the most important because it reflects the ability of the paper network to resist applied stresses during use. Tensile strength characterizes the ability of the fibrous network to withstand an applied tensile load before failure. In addition to absolute tensile strength, the tensile index provides a normalized measure that facilitates comparison between materials having different basis weights. Other tensile parameters, including strain at break and work-to-rupture, provide complementary information concerning deformation and energy absorption during mechanical loading [1,3,4].
A characteristic feature of paper-based materials is mechanical anisotropy. During paper manufacture, fibers tend to become preferentially oriented in the machine direction as a consequence of the hydrodynamic conditions during sheet formation and the mechanical processes associated with forming, pressing, drying, and converting. Tissue papers exhibit anisotropic behavior resulting from preferential fiber orientation developed during paper machine production. Consequently, tensile properties measured in the machine direction are generally greater than those measured in the cross direction [1,2,4].
The magnitude of this anisotropy is not necessarily identical among commercial products. Differences in fiber orientation, sheet formation, fiber bonding, basis weight, refining, creping and other manufacturing parameters can modify both the tensile performance and the ratio between machine- and cross-direction properties [1,2,5,6].
The tensile index provides a normalized measure of strength independent of basis weight and enables comparison among different tissue products. Additional parameters such as elongation at break and work-to-rupture provide information regarding deformation behavior and energy absorption capacity prior to failure [3,4].
The objective of the present study was therefore to compare the mechanical properties of six commercially available tissue paper products using standardized tensile testing. Particular emphasis was placed on tensile strength in the machine and cross directions, differences among commercial products and the degree of mechanical anisotropy expressed by the MD/CD tensile-strength ratio. A two-factor analysis was also performed to determine independently the effects of product type and testing direction and to establish whether the effect of testing direction differed among products.
This study evaluates and compares the mechanical performance of several commercial tissue paper products using standardized tensile testing according to ISO 12625-4. Particular attention was given to directional strength differences, tensile indices, elongation behavior, and energy absorption characteristics.
Experimental
Materials and specimen preparation
Six commercially available tissue paper products were investigated. For each commercial product, two sub-samples, designated A and B, were examined. Representative test specimens of (50.0±0.5) mm x (95±1) mm were collected from each product and conditioned prior to testing according to the requirements of the ISO 12625-4 standard [7]. The sample specimens were conditioned before testing under the standard atmosphere of (23±1) °C and (50±2)% relative humidity according to ISO 187 [8]. The sample specimens were selected in accordance with ISO 186 [9]. Each product/sub-sample combination was evaluated separately in the machine direction (MD) and cross direction (CD). Importantly, the MD and CD measurements were obtained from separate physical specimens, rather than measuring both directions on the same specimen. Thus, direction was treated as a between-specimen factor in the statistical analysis. The experimental design comprised six products x two sub-samples x ten specimens x two testing directions, giving a total of 240 tensile observations.
Tensile testing
Tensile measurements were performed according to ISO 12625-4:2022, “Determination of tensile strength, stretch at break, and tensile energy absorption” procedure described in the experimental work. The testing conditions included, a pre-load of 5Nm-1, a test speed of 50mm min-1, and a gauge length of approximately 80mm±1mm. Ten specimens were tested for each product/ sub-sample/ testing direction. Measurements were carried out in both machine direction (MD) and cross direction (CD). The following mechanical parameters were determined, the tensile strength (Nm-1), the tensile index (Nmg-1), the elongation at break (%), the work-to-rupture (J m-2), and the specific work-to-rupture (J g-1). Grammage [10] and absorbency [11] were also recorded as physical characteristics of the tissue products.
Tensile-strength anisotropy
The directional anisotropy of tensile strength was assessed using
the MD/CD ratio:
MD/CD ratio=MD tensile strength/CD tensile strength
A ratio greater than unity indicated higher tensile resistance in
the machine direction. Higher values indicated a greater difference
between MD and CD tensile performance.
Statistical analysis
Descriptive statistics were calculated for the investigated properties. One-way ANOVA was used to examine differences among the six products for individual mechanical parameters. A two-way factorial ANOVA was subsequently performed for tensile strength, with Product and Testing Direction as fixed factors and their interaction included in the model. Because the MD and CD specimens were physically different specimens, testing direction was treated as an independent between-specimen factor. For the tensile-strength analysis, product-level pairwise comparisons were performed using Tukey procedures, while estimated marginal means were compared using Bonferroni adjustment. Effect sizes were expressed as partial eta squared (η2). Before interpretation of the factorial ANOVA, the assumptions of the analysis were examined, including variance homogeneity and distributional characteristics. The Levene test indicated significant heterogeneity of variance; therefore, the magnitude and consistency of the observed effects were considered together with the balanced experimental design and the very large observed effect sizes.
Results
General physical and mechanical characteristics
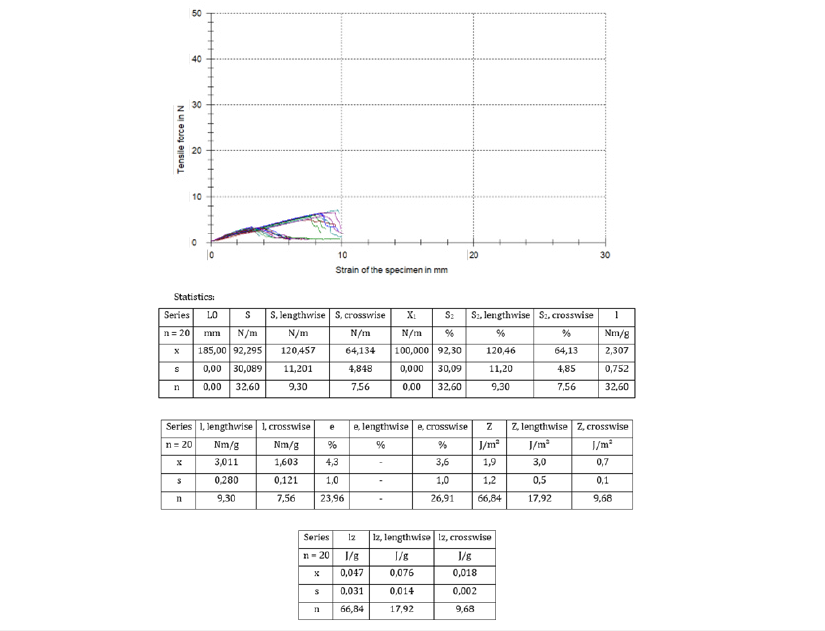
The six tissue products showed relatively similar basis weights but considerable differences in tensile behavior. The six tissue paper products were each represented by two subsamples (A and B), with ten independent specimens evaluated in each testing direction. Thus, the complete experimental design consisted of 240 tensile observations. MD and CD measurements were obtained from separate physical specimens; consequently, testing direction was treated as a between-specimen factor in the factorial analysis rather than as a repeated measurement on the same specimen. The mean grammage across the twelve product/subsample combinations was approximately 17.04g/m2, with values ranging from 15.8 to 18.0g/m2. Mean absorbency was approximately 6.42s. The tensile properties, however, showed much greater variation than grammage. The overall mean tensile strength was 127.21N/m in the machine direction and 51.58N/m in the cross direction. That difference demonstrated that relatively small differences in basis weight were associated with substantially different mechanical performance among the commercial products (Table 1). The individual tensile curves and associated instrument statistics presented in Figures 1-12 provided the experimental basis for these differences. The instrument-derived values in these figures were consistent with the summarized values reported in Table 1.
Table 1:Physical and tensile properties of six commercial tissue paper products and their corresponding sub-samples (A and B), measured according to ISO 12625-4. Results were presented as mean ± standard deviation (n=10). Parameters included grammage according to ISO 12625-6: 2005, absorbency according to TAPPI T432, machine-direction (MD) and cross-direction (CD) tensile strength, tensile index, work capacity, strain at break, and work-to-rupture. The data demonstrated the directional dependence of tissue paper mechanical performance resulting from fiber orientation during manufacture.
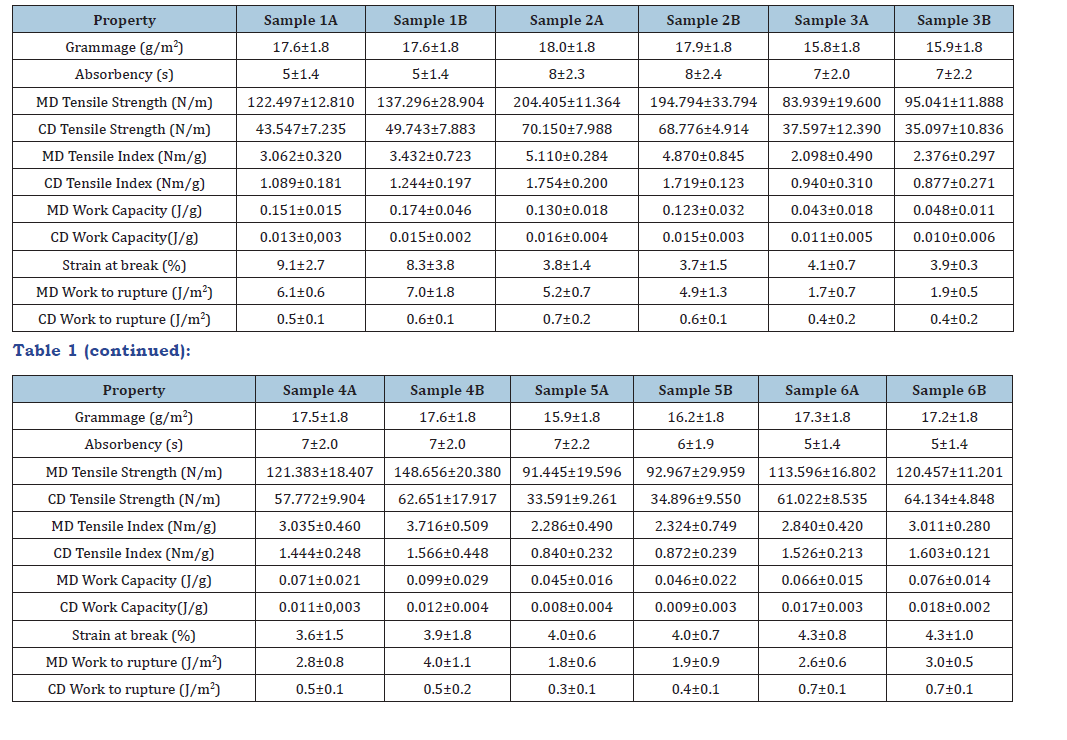
Figure 1:Graph with statistics for tensile properties for tissue product 1A
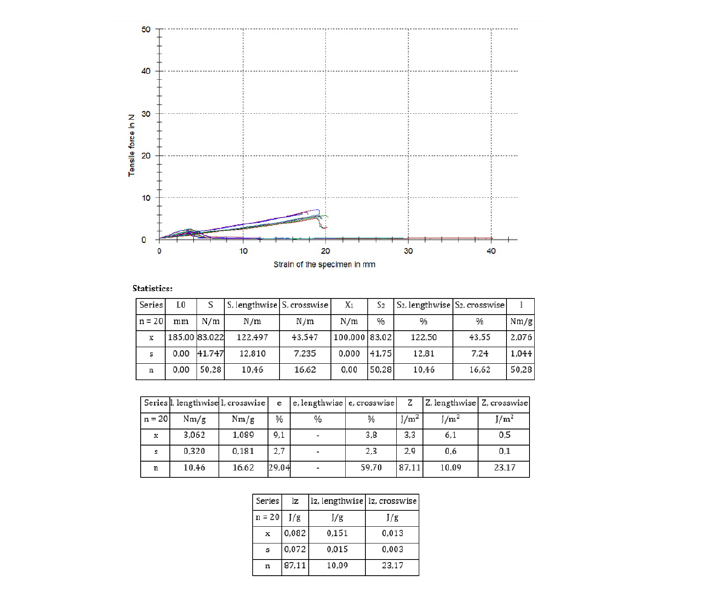
Figure 2:Graph with statistics for tensile properties for tissue product 1B.
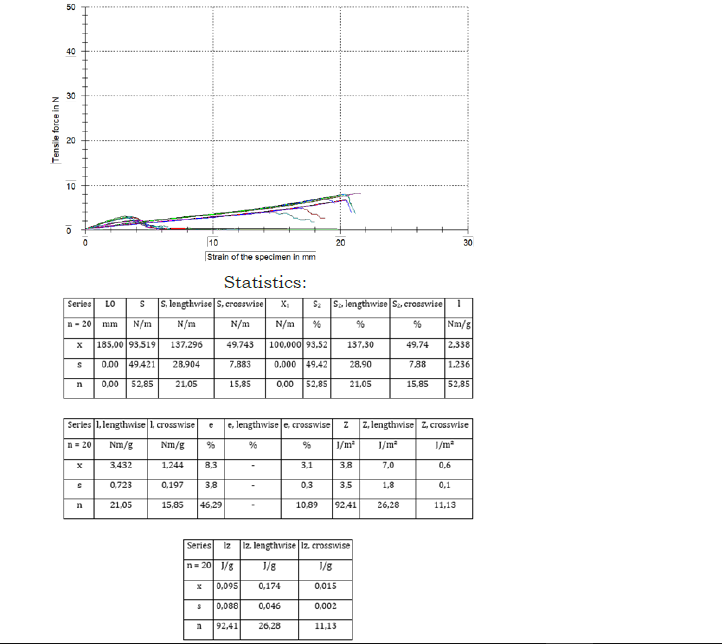
Figure 3:Graph with statistics for tensile properties for tissue product 2A.
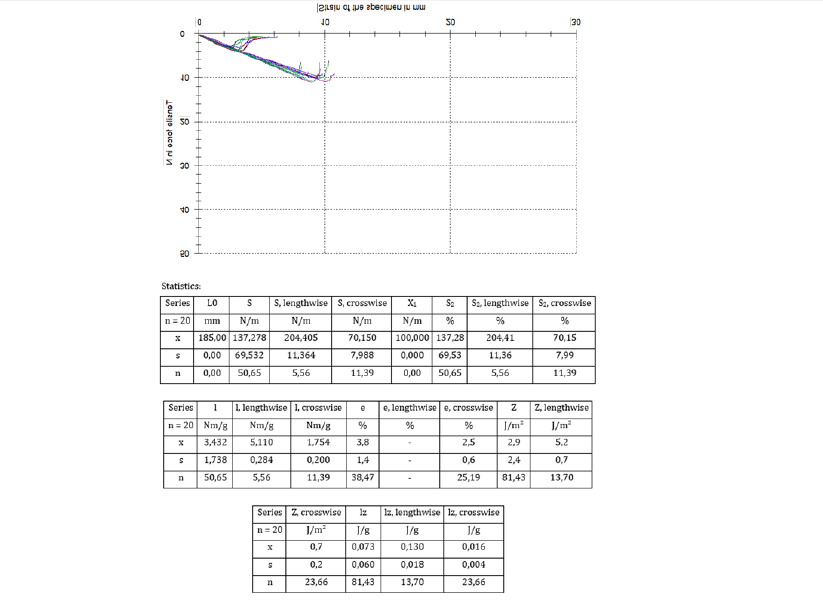
Figure 4:Graph with statistics for tensile properties for tissue product 2B..
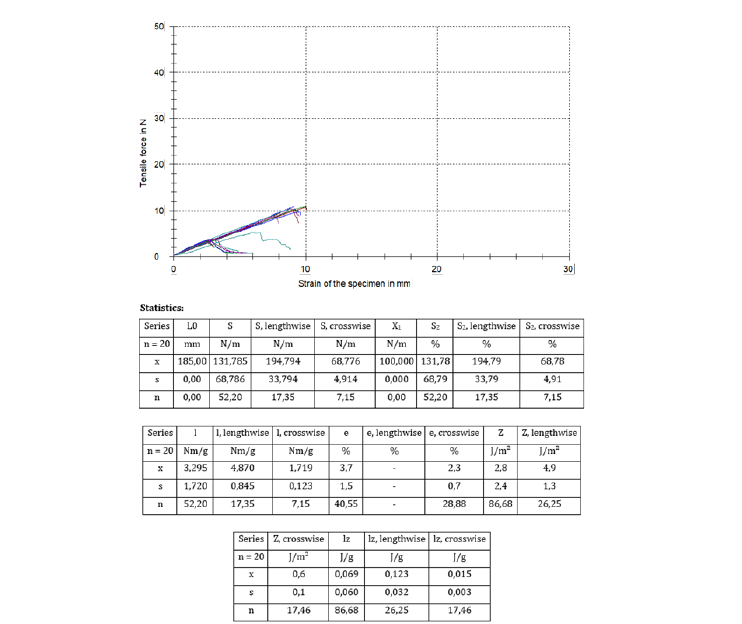
Figure 5:Graph with statistics for tensile properties for tissue product 3A.
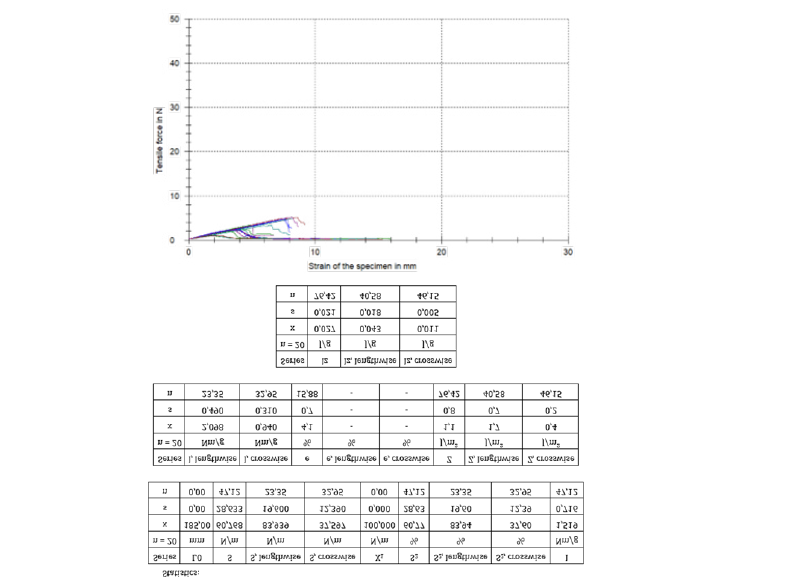
Figure 6:Graph with statistics for tensile properties for tissue product 3B.
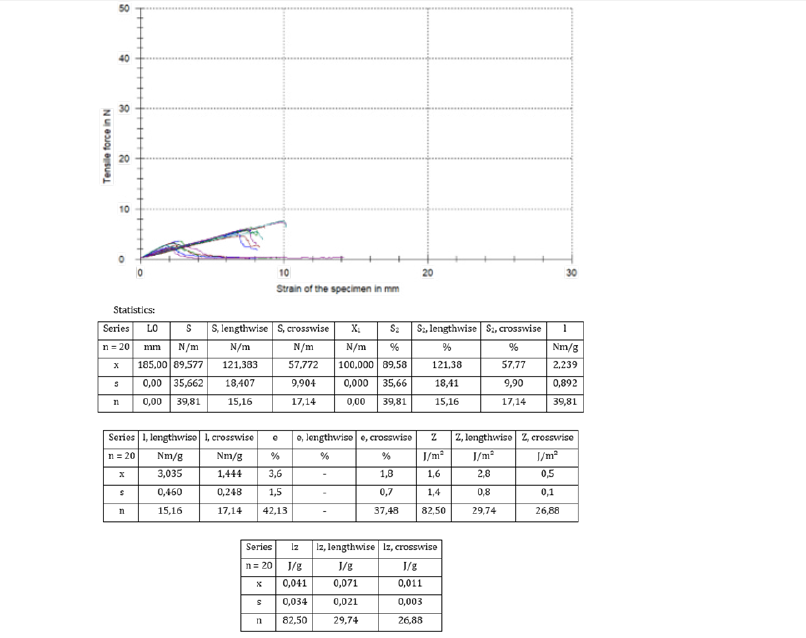
Figure 7:Graph with statistics for tensile properties for tissue product 4A.
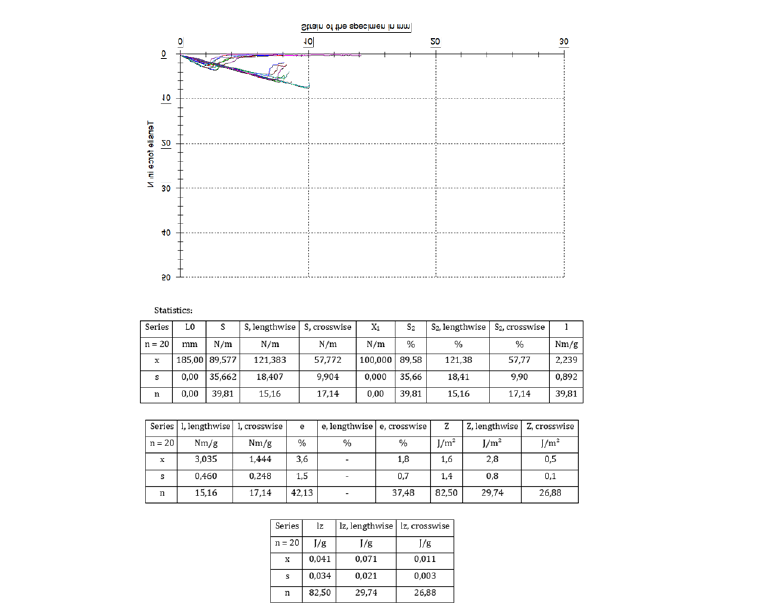
Figure 8:Graph with statistics for tensile properties for tissue product 4B.
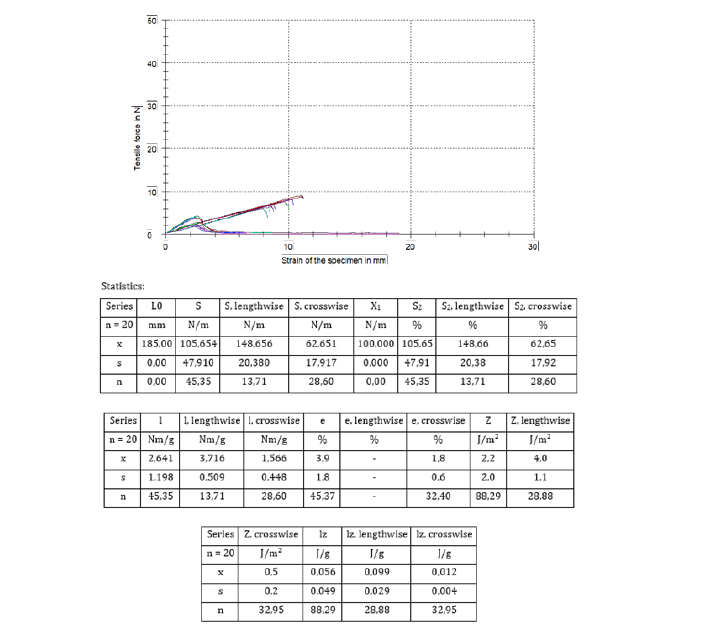
Figure 9:Graph with statistics for tensile properties for tissue product 5A
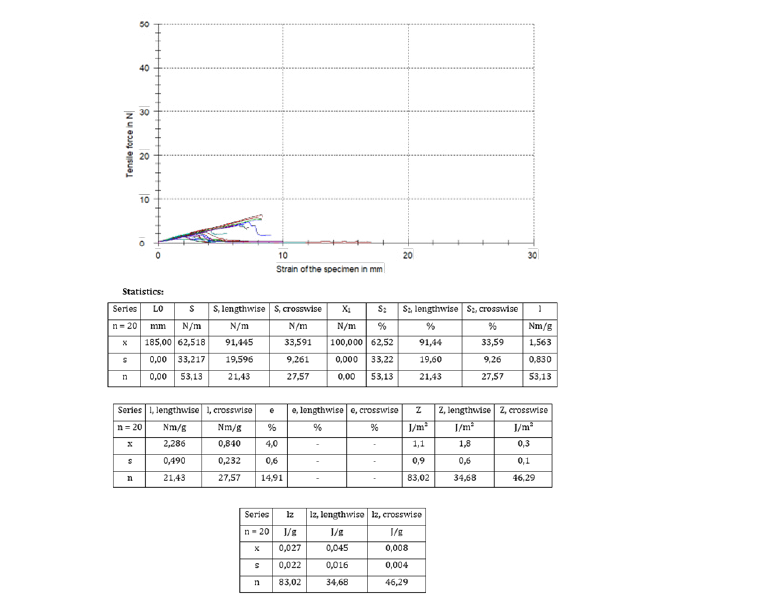
Figure 10:Graph with statistics for tensile properties for tissue product 5B.
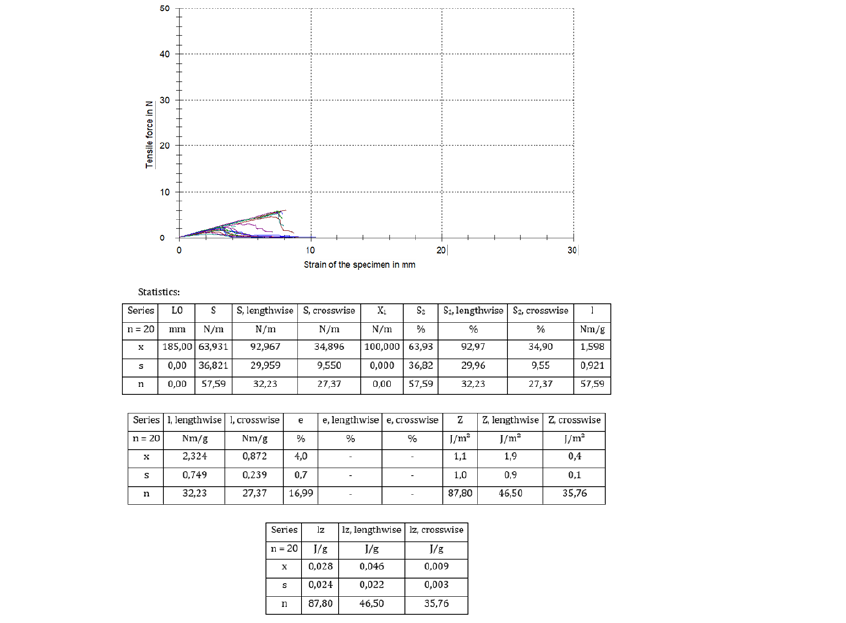
Figure 11:Graph with statistics for tensile properties for tissue product 6A.
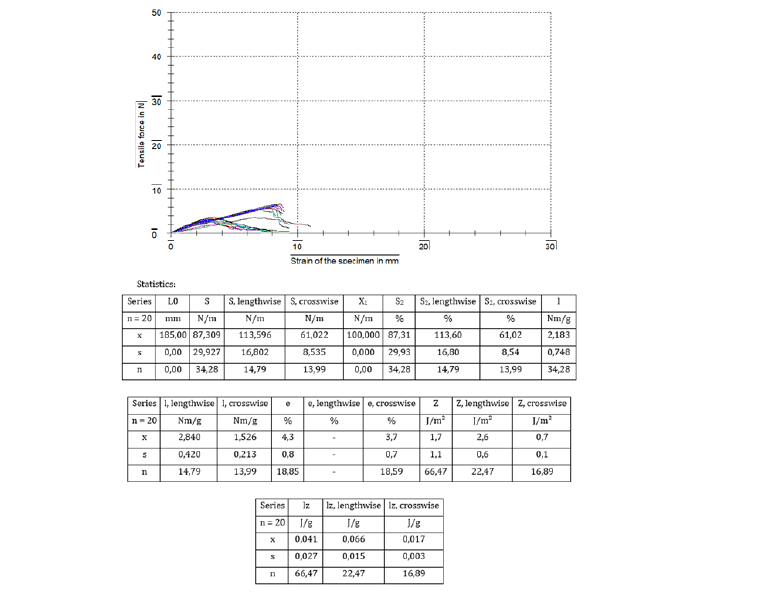
Figure 12:Graph with statistics for tensile properties for tissue product 6B
Tensile strength in the machine and cross directions
All six products exhibited substantially greater tensile strength in MD than in CD (Table 2). The product-specific mean values were presented in Table 2.
Table 2:Mean values for tensile strength for the six products.
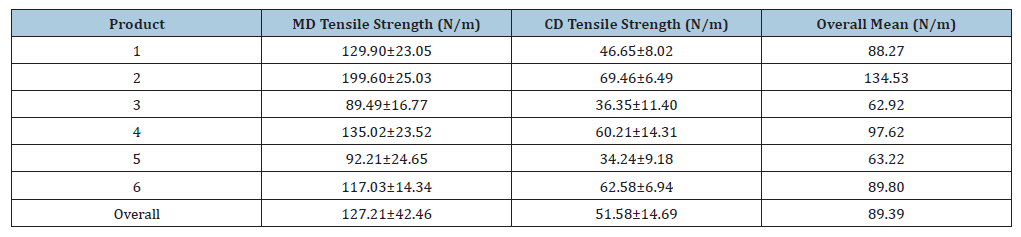
The highest tensile strength was observed for Product 2, particularly in MD, where the mean value reached 199.60N/m. Product 3 had the lowest MD mean (89.49N/m), while Product 5 had a similar value of 92.21N/m. In CD, Product 2 again had the highest mean value (69.46N/m), whereas Product 5 had the lowest (34.24N/m) (Table 2).
The consistently higher MD values indicated pronounced directional dependence of the fibrous network. Such directional dependence was consistent with the orientation-dependent mechanical behavior reported for machine-made paper and tissue materials [1,5]. Fiber orientation, sheet formation, inter-fiber bonding, drying conditions and subsequent tissue-manufacturing operations could all have contributed to differences between MD and CD tensile properties [1,2,6].
The MD/CD ratio (Machine Direction Tensile Strength ÷ Cross Direction Tensile Strength) was calculated directly from the tensile strength values in Table 1. This ratio was one of the most important indicators of fiber orientation anisotropy in tissue papers (Table 3).
Table 3:MD/CD Tensile Strength Ratio.
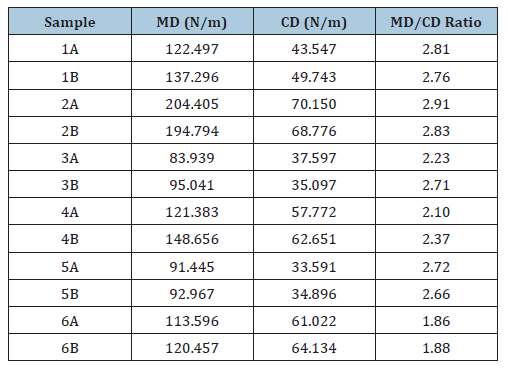
All six investigated tissue products had ratios substantially greater than 1.0 (Table 4). They exhibited anisotropic mechanical behavior, with tensile strength values measured in the machine direction, exceeding those obtained in the cross direction. The calculated MD/CD tensile strength ratios ranged from 1.87 for product 6 to 2.87 for product 2, confirming the preferential alignment of cellulose fibers during paper manufacture.
Table 4:Average MD/CD Ratio per Tissue Product.
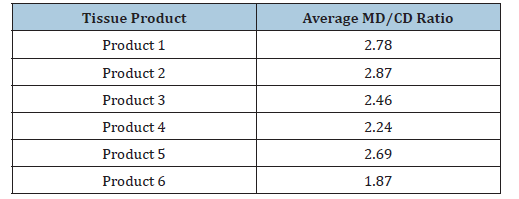
From Table 4 we deduced that product 2 exhibited the strongest anisotropy (MD/CD=2.87), indicating pronounced fiber alignment in the machine direction. Product 6 showed the lowest anisotropy (MD/CD = 1.87), suggesting a more isotropic fiber network. All six products displayed MD/CD ratios greater than 1.8, confirming the typical anisotropic structure of tissue papers produced on paper machines. These results indicated substantial differences in fiber orientation and sheet formation among the six commercial products.
The highest machine-direction tensile strengths were observed for product 2 (194-204Nm-1), whereas product 3 exhibited the lowest values (84-95Nm-1). Similar trends were observed for tensile index and work-to-rupture measurements, suggesting that stronger fiber networks also possessed greater energy absorption capacity before failure. Nevertheless, tensile strength, extensibility and energy absorption should not be regarded as interchangeable properties because they described different aspects of the tensile response of the fibrous network [1,3,6]. The observed anisotropy was characteristic of tissue papers produced on continuous paper machines, where hydrodynamic and mechanical forces, oriented fibers preferentially along the machine direction. Consequently, load transfer became more efficient in the MD than in the CD, resulting in significantly higher tensile resistance.
The MD/CD ratio proved to be a useful indicator of sheet structure and fiber orientation, allowing discrimination among the investigated products. Lower MD/CD values indicated a more isotropic network structure, whereas higher values reflected stronger fiber alignment and greater directional dependence of mechanical performance.
The tensile -index results in Table 1 followed the directional pattern as tensile strength. Product 2 exhibited the highest MD tensile index, reaching 5.110Nm/g for subsample 2A and 4.870Nm/g for subsample 2B. The corresponding CD values were 1.754 and 1.719Nm/g. Products 3 and 5 exhibited considerably lower MD tensile indices, whereas Product 6 maintained a comparatively balanced relationship between its MD and CD indices. The work-capacity and work-to-rupture data in Table 1 provided additional information about the ability of the tissue network to absorb mechanical energy before failure. Products displaying high tensile strength generally also displayed higher MD work capacity and MD work-to-rupture. Product 2, exhibited MD work-to-rupture values of 5.2 and 4.9J/m2 for subsamples 2A and 2B, respectively, whereas Products 3 and 5 showed substantially lower values. This parallel behavior indicated that stronger tissue networks could generally sustain greater mechanical work before rupture. The same relationship was not identical in CD. Although CD work-to-rupture values were substantially lower than MD values for all products, the relative ordering among products was less pronounced. That distinction was important because tensile strength, strain at break and energy absorption described different aspects of the mechanical response and should not be treated as interchangeable parameters. Strain at break provided a complementary measure of extensibility. Products 1A and 1B exhibited comparatively high strain-at-break values of 9.1% and 8.3%, respectively, whereas Products 2A and 2B showed values of approximately 3.8% and 3.7%. Products 4-6 displayed intermediate values of approximately 3.6-4.3% (Table 1). Thus, the product with the highest tensile strength was not necessarily the product with the highest extensibility. That illustrated that tissue performance represented a multi-dimentional balance between strength, deformation and energy absorption rather than a single mechanical property.
Figures 1 and 2, corresponding to Products 1A and 1B, respectively, show substantially greater tensile resistance in the lengthwise/ MD direction than in the crosswise/CD direction.
The same directional pattern was evident in Figures 3 and 4 for
Product 2.
The same directional pattern was evident in Figures 5 and 6,
for Product 3.
The same directional pattern was evident for Figures 7 and 8,
for Product 4.
Also, the same pattern in Figures 9 and 10, for Product 5.
Finally, the same directional pattern in Figures 11 and 12 for Product 6. Across all twelve products, subsample combinations, the machine-direction response was consistently stronger than the cross-direction response. The instrument-derived values in those figures were consistent with the summarized values reported in Table 1.
Statistical analysis
Mean values and standard deviations were calculated for all measured properties. Comparative evaluation of the tissue products was performed using descriptive statistical analysis. Studies also employed one-way and two-way ANOVA in order to investigate the significance of product type and testing direction on tensile performance.
Results and Discussion
Tensile strength
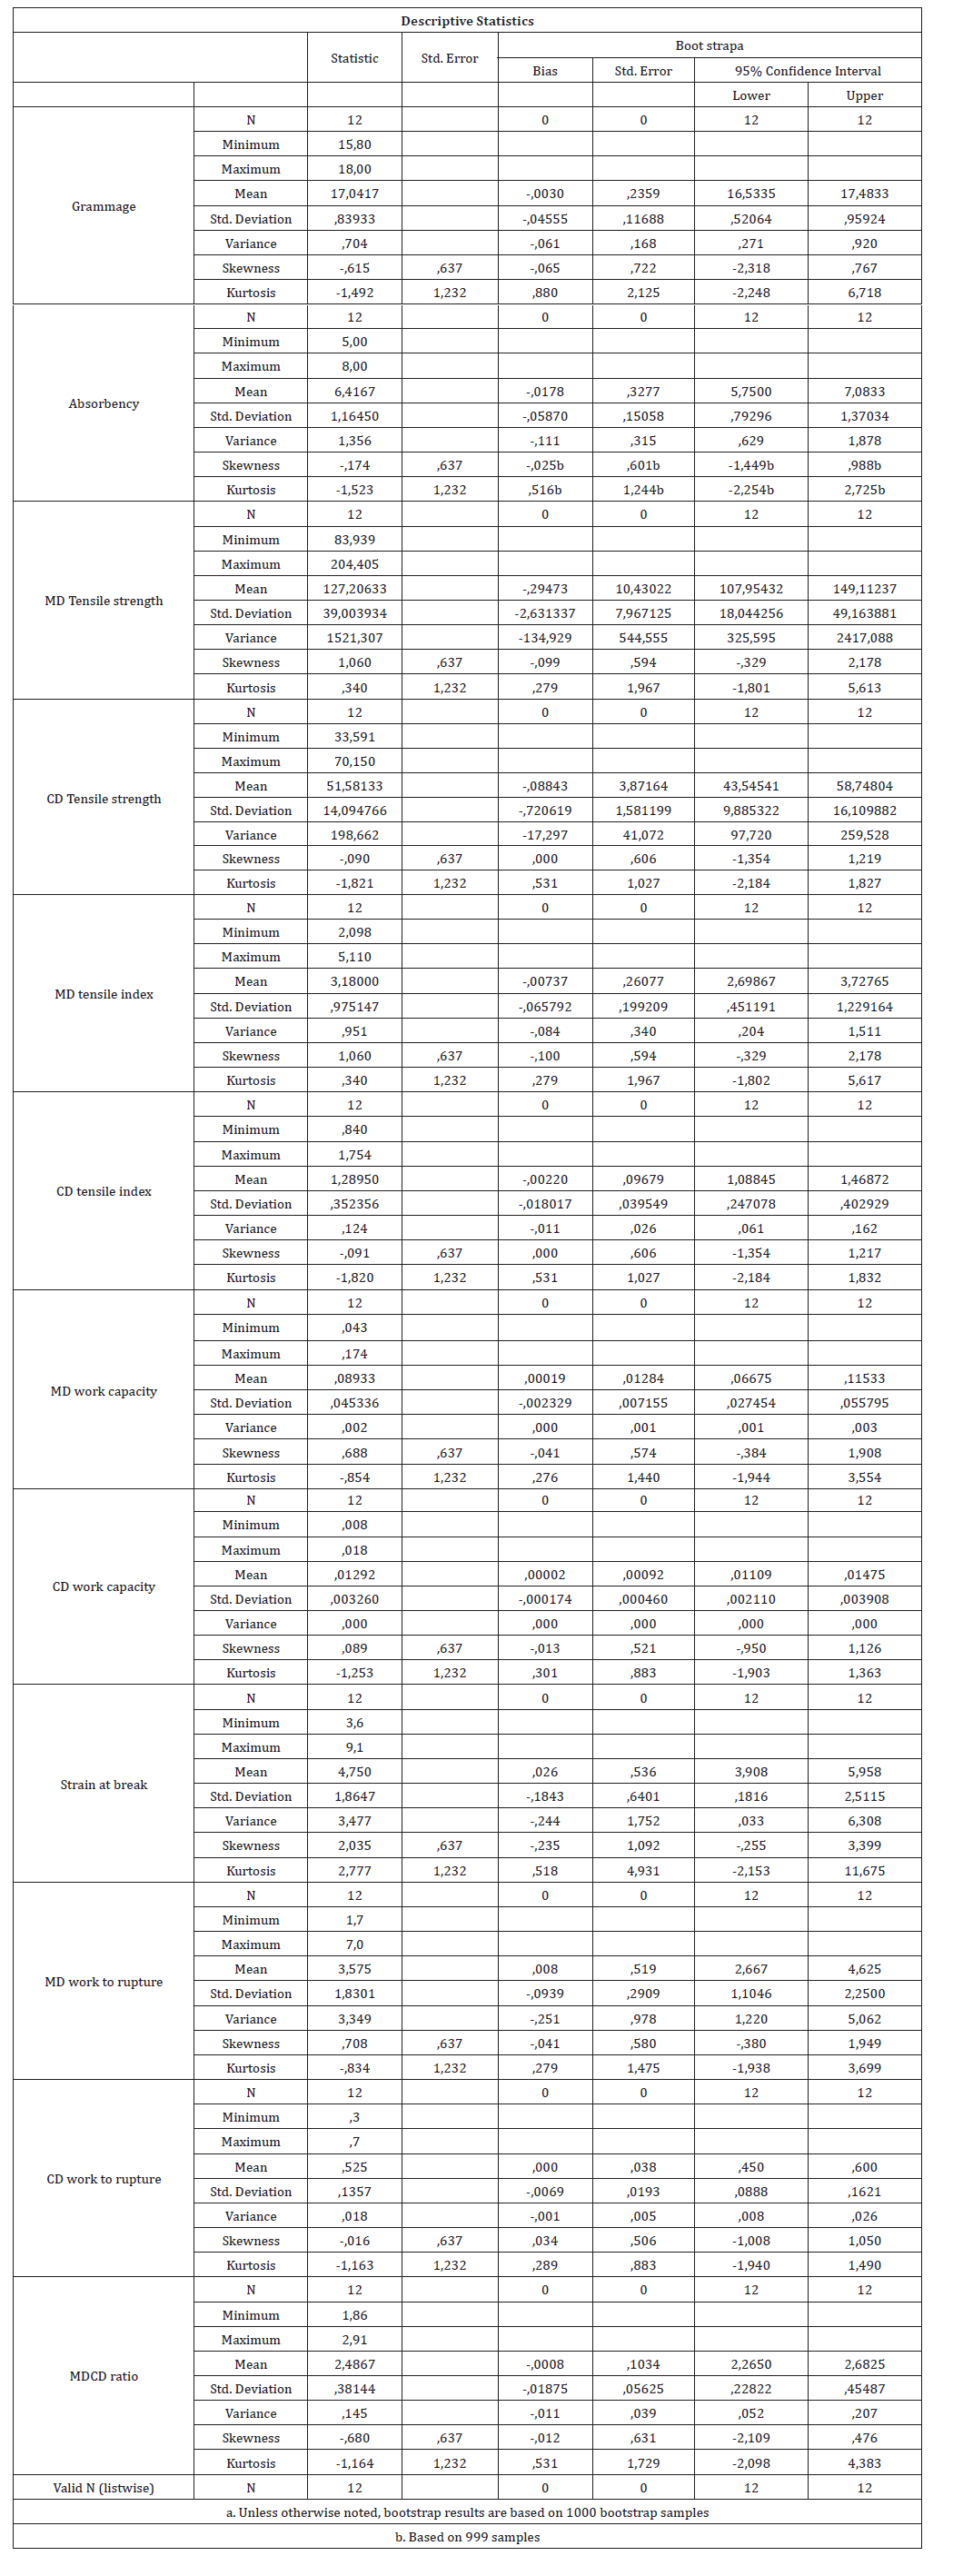
The tensile strength measurements revealed pronounced anisotropic behavior in all investigated tissue papers. The descriptive statistical analysis was presented in Figure 13. Across the twelve product/subsample combinations, grammage showed relatively limited variability, whereas MD tensile strength exhibited substantially greater dispersion. We then performed the Normality test for all variables.
Figure 13:Descriptive Statistics.
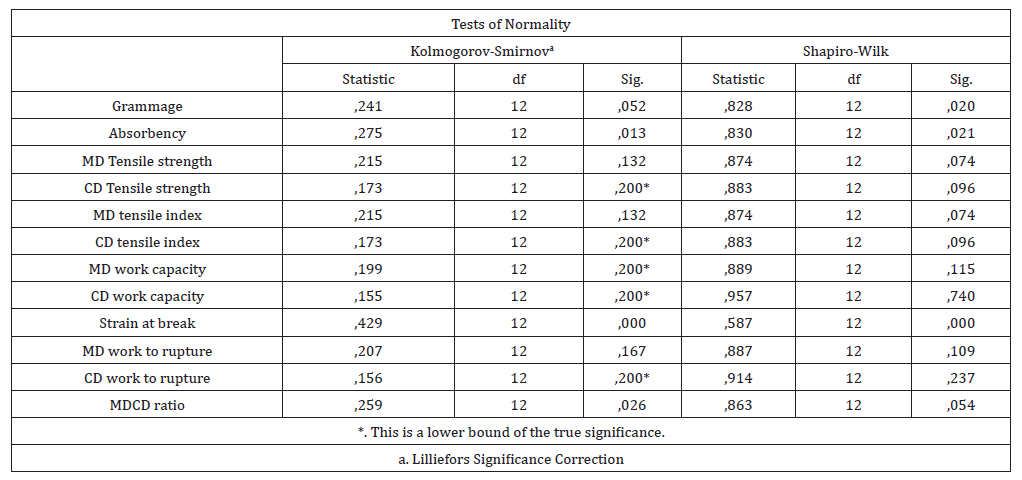
The normality assessment was presented in Figure 14. The Shapiro- Wilk test did not indicate significant departure from normality for MD tensile strength (p=0.074), CD tensile strength (p=0.096), MD tensile index (p=0.074), CD tensile index (p=0.096), MD work capacity (p=0.115), CD work capacity (p=0.740), MD work-to-rupture (p=0.109), or CD work-to-rupture (p=0.237). However, grammage (p=0.020), absorbency (p=0.021), strain at break (p<0.001), and the MD/CD ratio (p=0.054 for Shapiro-Wilk) required more cautious interpretation. In particular, strain at break showed clear evidence of non-normality, indicating that its distribution was more heterogeneous among the investigated products.
Figure 14:Tests of normality for the physical and mechanical properties of the investigated tissue paper products. The table presented the Kolmogorov-Smirnov and Shapiro-Wilk tests for assessing whether the distributions of the measured variables departed significantly from normality.
Those distributional characteristics reinforced the importance of considering both central tendency and variability rather than relying exclusively on product means. The results demonstrated that commercial tissue papers with broadly similar basis weights could exhibit markedly different tensile properties. Then, one-way ANOVA was used to determine whether different tissue products differed significantly. The one-way ANOVA results demonstrated significant differences among the six products for the major tensile parameters. For tensile strength, significant product effects were observed in both MD and CD (Figure 15):
MD tensile strength: F(5,6)=31.510, p<0.001
CD tensile strength: F(5,6)=62.978, p<0.001
Figure 15:One-Way ANOVA comparing the mechanical properties of the six tissue paper products.
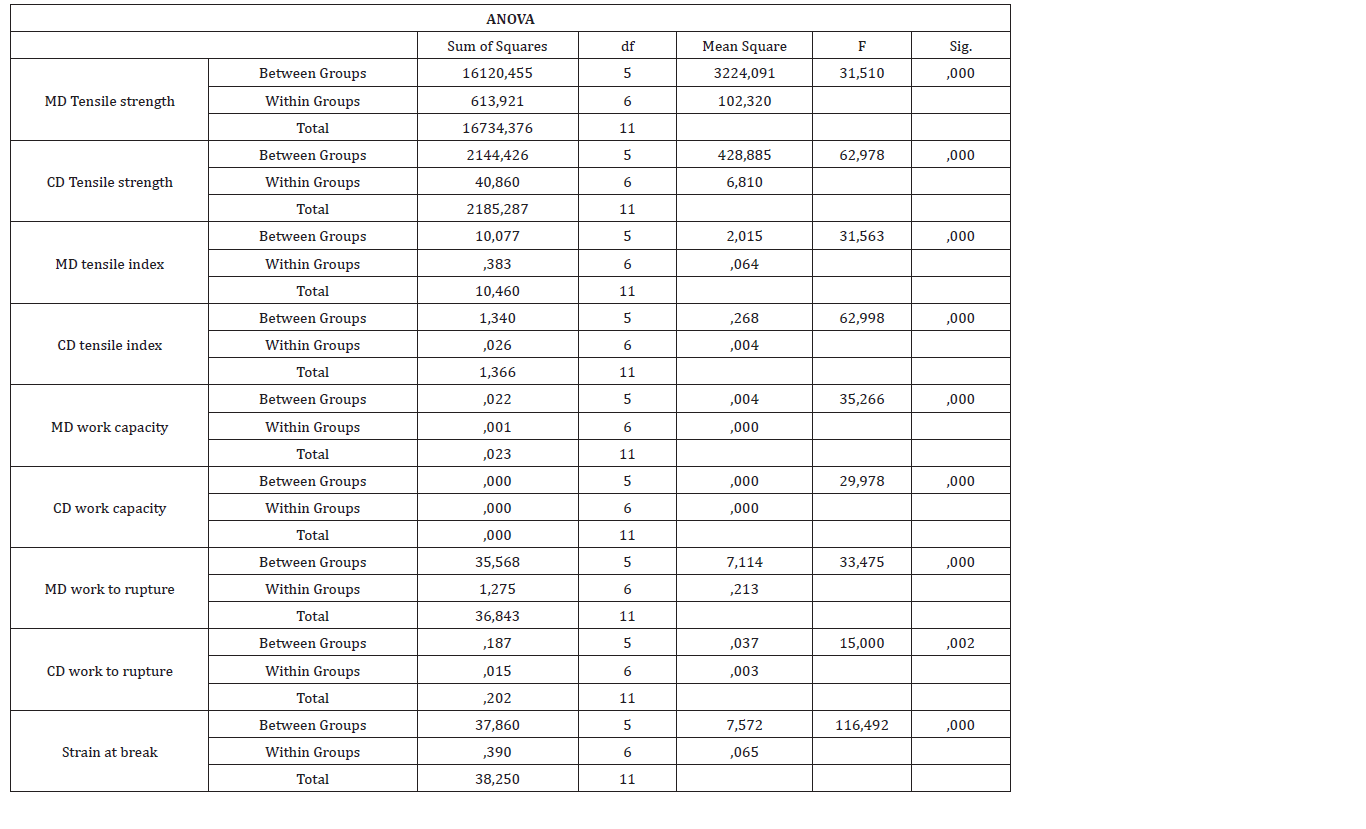
The one-way ANOVA results were summarized in Figure 15. Significant product differences were observed for MD and CD tensile index, work capacity, work-to-rupture, and strain at break. For tensile strength, the product effect was significant in both MD, F(5,6)=31.510, p<0.001 and CD, F(5,6)=62.978, p<0.001. Significant product effects were also observed for MD tensile index, CD tensile index, MD work capacity, CD work capacity, MD work-to-rupture, CD work to rupture, and strain at break. The F statistic for strain at break was particularly large, F(5,6)=116.492, p<0.001. The particularly large F values demonstrated that product type was strongly associated with the mechanical properties measured in the study
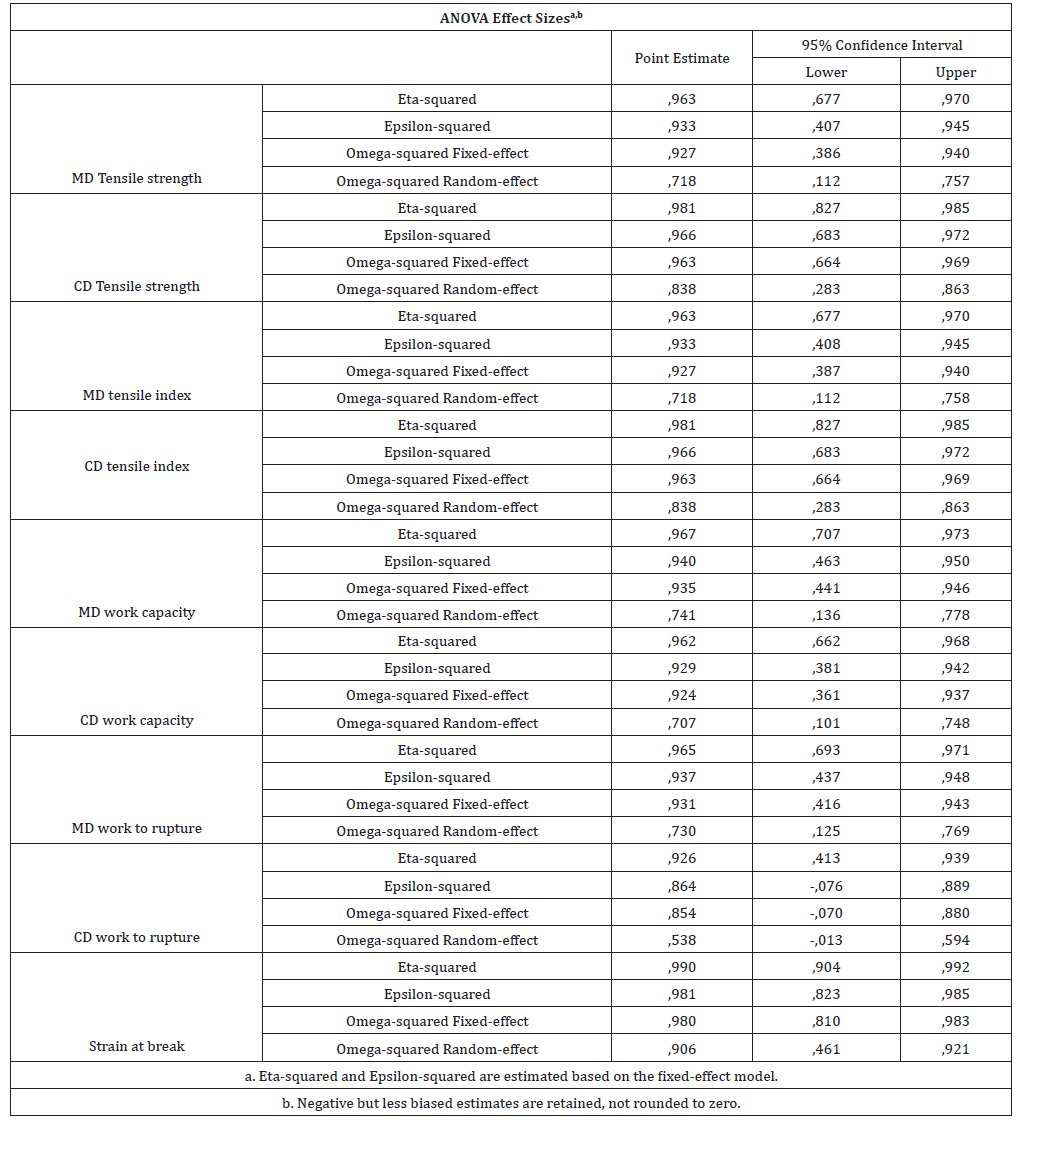
The effect-size analysis presented in Figure 16 indicated that these product effects were not merely statistically detectable but accounted for a large proportion of the observed variation. Etasquared values were 0.963 for MD tensile strength and 0.981 for CD tensile strength. Correspondingly high values were obtained for tensile index, work capacity, work-to-rupture and strain at break. For strain at break, eta-squared reached 0.990. These findings demonstrated that commercial product identity was strongly associated with the mechanical characteristics measured in this study. The magnitude of these effects should be interpreted in conjunction with the experimental structure and the relatively small number of product-level means used in the one-way comparisons. The subsequent factorial analysis based on all 240 observations provided a more comprehensive evaluation of tensile strength by simultaneously accounting for product and testing direction.
Figure 16:Effect-Size estimates for differences in mechanical properties among the six tissue paper products. The effect-size estimates included eta-squared, epsilon-squared, and omega-squared, in order to quantify the magnitude of the differences among products.
The product-level post-hoc comparisons were presented in Figures 17-19, including the multiple-comparison, bootstrap and Tukey HSD outputs. These analyses showed that Product 2 differed significantly from every other product in overall tensile strength. In contrast, Products 3 and 5 did not differ significantly from each other. Products 1,4 and 6 also showed no statistically significant differences among themselves in overall tensile strength. The Tukey homogeneous-subset analysis shown in the corresponding output in Figure 19, therefore separated the products into broad groups, products 3 and 5 occupied the lower mean-strength group, products 1,6, and 4 formed an intermediate group, and product 2 occupied a distinct higher-strength group.
Figure 17:Tukey HSD Multiple Comparisons analysis

Figure 18:Bootstrap-based multiple comparisons of the paper mechanical properties of the six tissue products, with confidence intervals for pairwise differences.

a. Unless otherwise noted, bootstrap results are based on 1000 bootstrap samples; b. Based on 82 samples; c. Based
on 80 samples; d. Based on 71 samples; e. Based on 66 samples; f. Based on 69 samples; g. Based on 70 samples; h.
Based on 64 samples; i. Based on 75 samples; j. Based on 73 samples; k. Based on 81 samples; l. Based on 79 samples;
m. Based on 76 samples; n. Based on 77 samples; o. Based on 72 samples
p. Based on 74 samples; q. Based on 86 samples; r. Based on 68 samples; s. Based on 58 samples; t. Based on 67
samples; u. Based on 62 samples
Figure 19:Tukey HSD post hoc to identify which products differ.
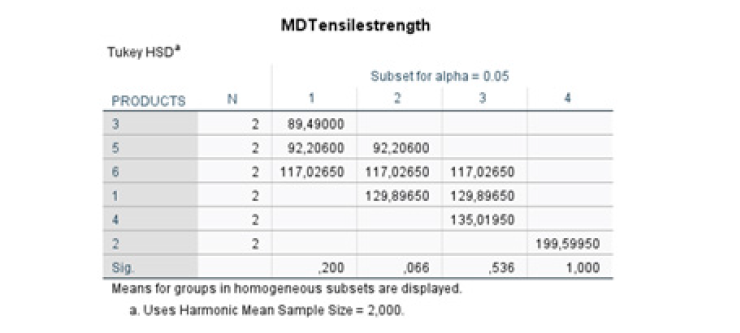
Figures 20-27 provided the additional post-hoc/comparative statistical outputs retained in this study. Taken collectively with Figures 17-19, these analyses reinforced the conclusion that the differences among commercial products were systematic rather than attributable simply to random specimen-to-specimen variation. The similarity between products 3 and 5 and between products 1,4 and 6 was particularly relevant because it demonstrated that commercially distinct products could exhibit statistically comparable tensile performance even though their individual structural characteristics may have differed. Now we should have performed TWO-WAY ANOVA.
Figure 20:Tukey HSD post hoc to identify which products differ.
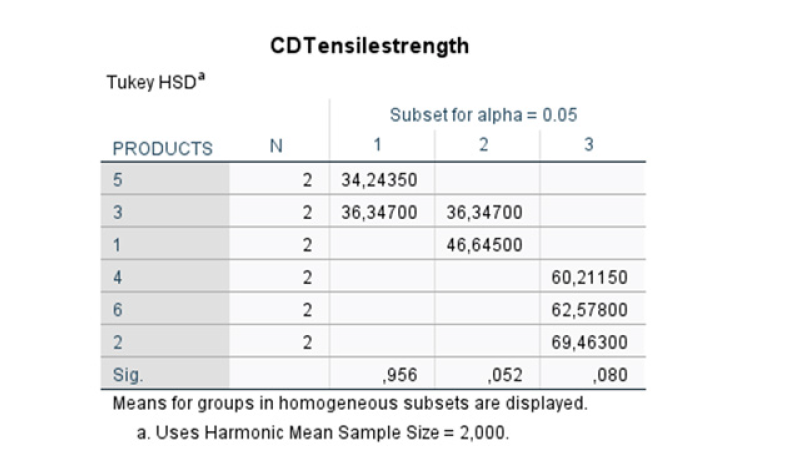
Figure 21:Tukey HSD post hoc to identify which products differ.
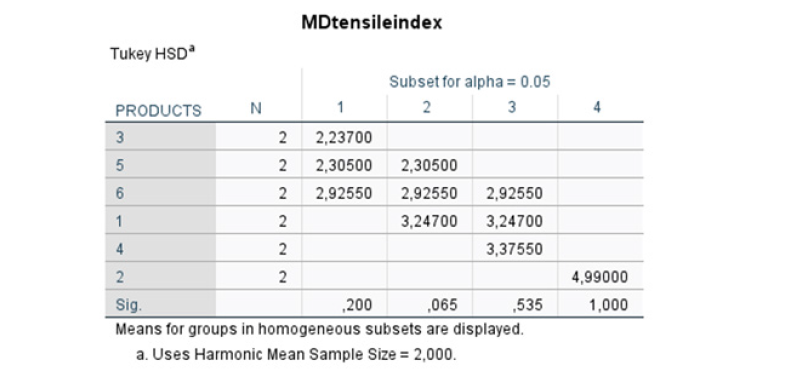
Figure 22:Tukey HSD post hoc to identify which products differ.
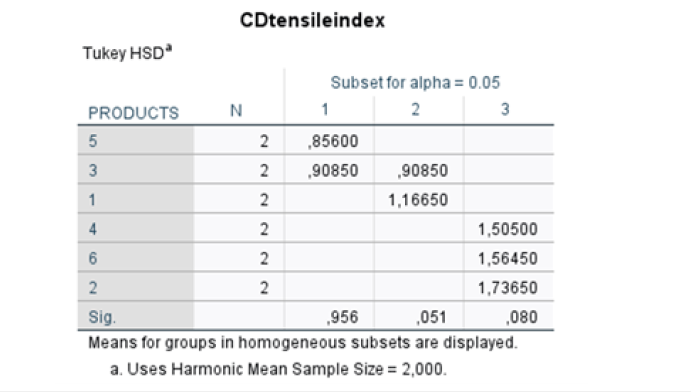
Figure 23:Tukey HSD post hoc to identify which products differ.
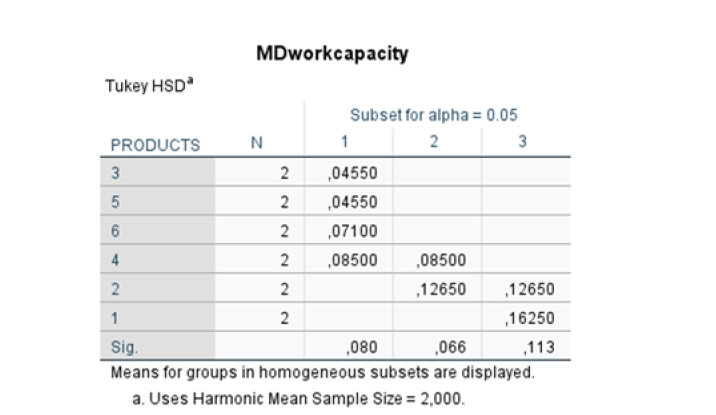
Figure 24:Tukey HSD post hoc to identify which products differ.
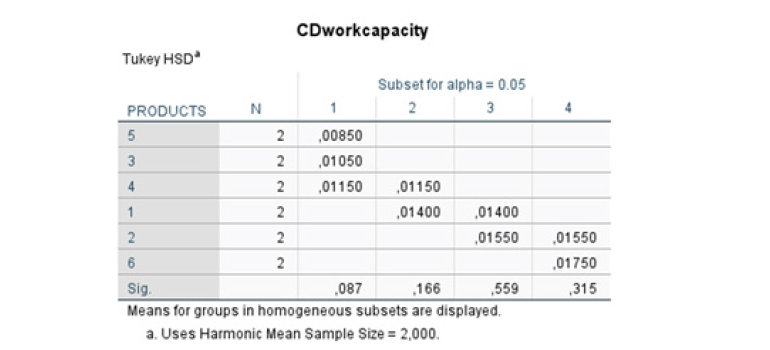
Figure 25:Tukey HSD post hoc to identify which products differ.
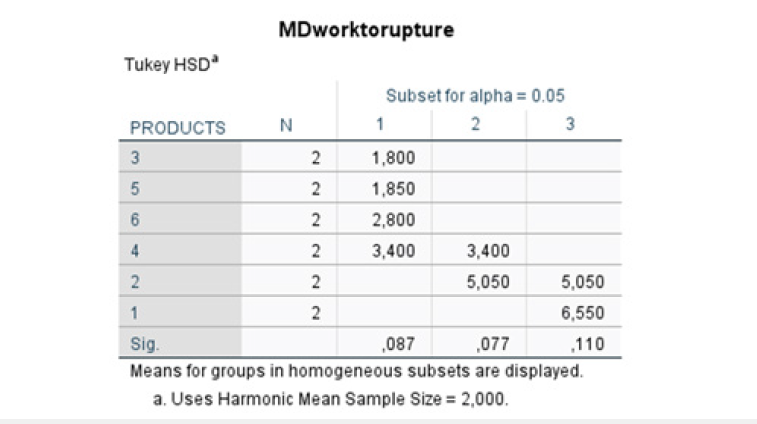
Figure 26:Tukey HSD post hoc to identify which products differ.
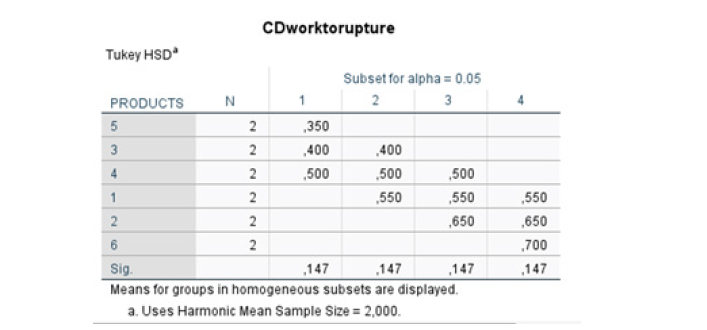
Figure 27:Tukey HSD post hoc to identify which products differ
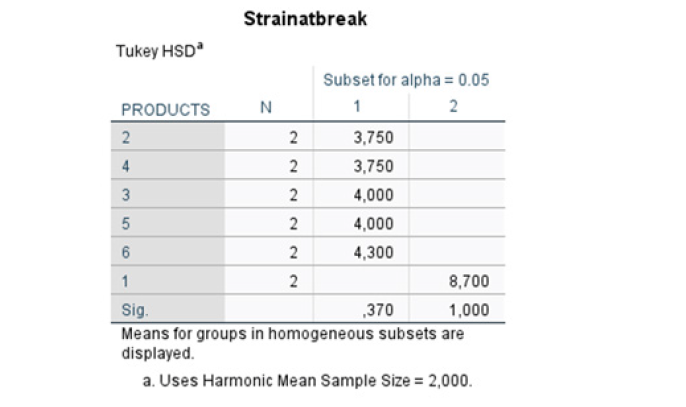
Figure 28:Descriptive Statistics.
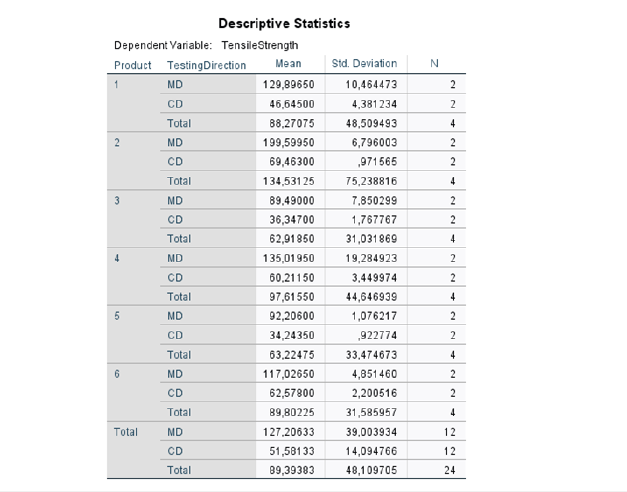
The table in Figure 28 provided an initial comparison of tensile strength among the six tissue-paper products, taking into account both the machine direction (MD) and the cross direction (CD). The estimated marginal means were 88.27, 134.53, 62.92, 97.62, 63.22 and 89.80N/m for Products 1-6, respectively (Figure 28).
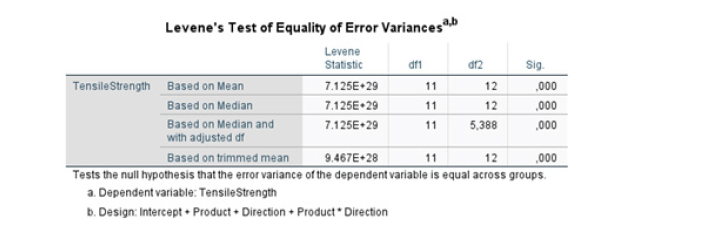
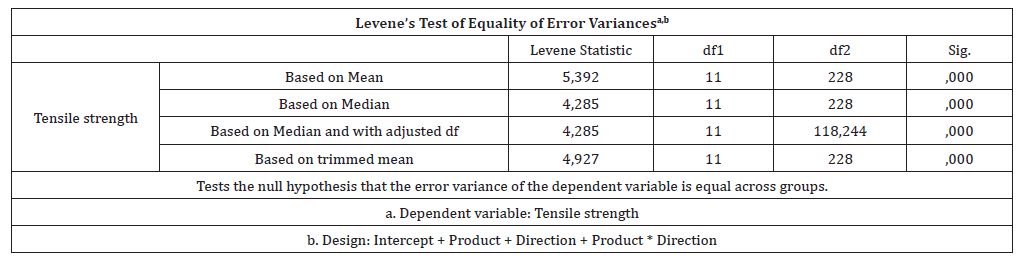
The homogeneity of error variances was assessed using Levene’s test before interpreting the two-way analysis of variance (ANOVA). For tensile strength. As shown in Figure 29, Levene’s test was statistically significant based on the mean, F(11,12), p<0.001. The same conclusion was obtained using the median, the median with adjusted degrees of freedom, and the trimmed mean.
Figure 29:Levene’s Test of equality of error variances for Tensile Strength.
The table in Figure 30 presented tests of Between-Subjects Effects for tensile strength, examining the effects of tissue paper product, testing direction, (machine direction, MD and cross direction, CD) and their interaction. The overall model was statistically significant and accounted for 98.8% of the observed variability in tensile strength within the analyzed dataset.
Figure 30:Tests of Between-Subjects Effects.
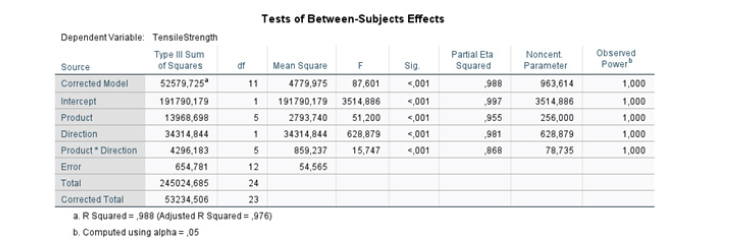
Figure 31:Tukey HSD Post Hoc Multiple Comparisons of Tensile Strength.
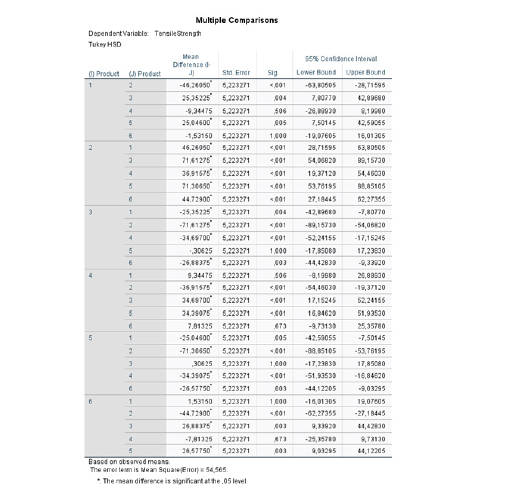
The Tukey HSD post-hoc test in Figure 31 identified which of the six commercial tissue paper products differed significantly in their mean tensile strength. The analysis used a significance level of α=0.05, with statistically significant differences indicated by an asterisk and supported by the corresponding p-values and 95% confidence intervals. The results demonstrated substantial differences in tensile strength among the six products.
The table in Figure 32 grouped the tissue paper samples based on whether their mean tensile strength values differed significantly from one another. The samples that shared the same column (subset) had means that were not statistically different from each other. The samples in different columns possessed statistically significant differences in tensile strength (Figures 33-35).
Figure 32:Homogeneous Subsets of tissue paper products identified by Tukey HSD post-hoc analysis of tensile strength.
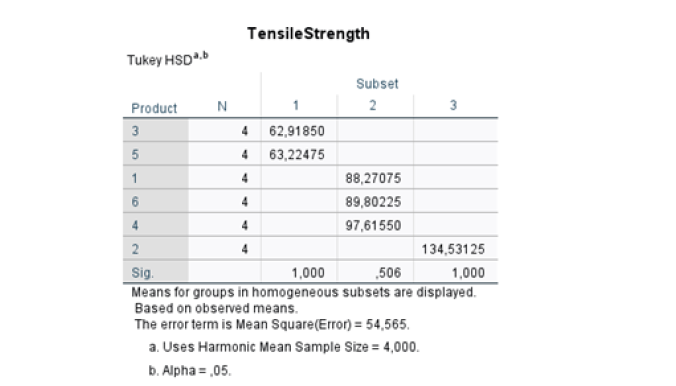
Figure 33:Correlation Analysis
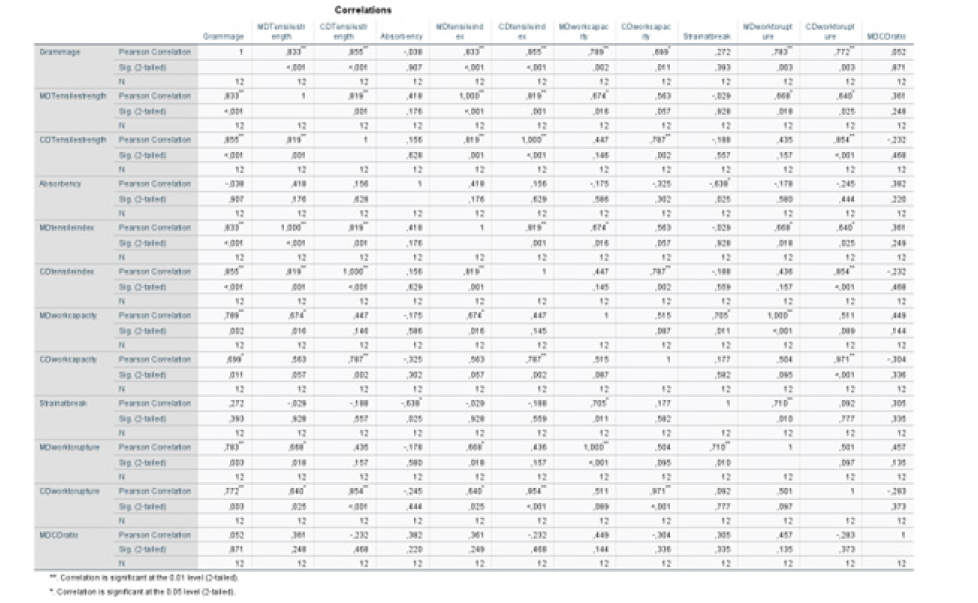
Figure 34:Factor Analysis- Principal Component Analysis.
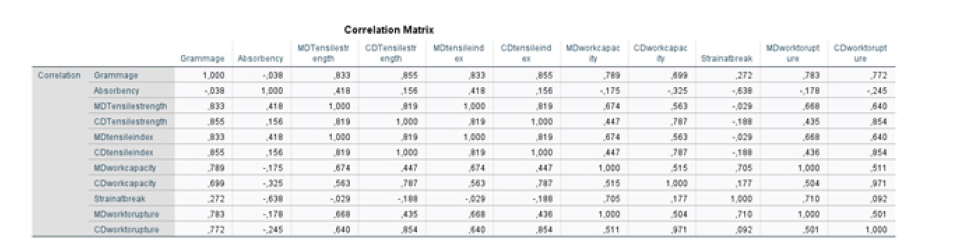
Figure 35:Kaiser -Meyer-Olkin (KMO) Measure of sampling adequacy and Bartllett’s test of sphericity.
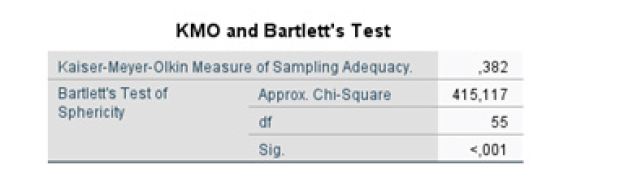
Figure 36:Anti-image Matrices for the factor analysis of tissue-paper properties.
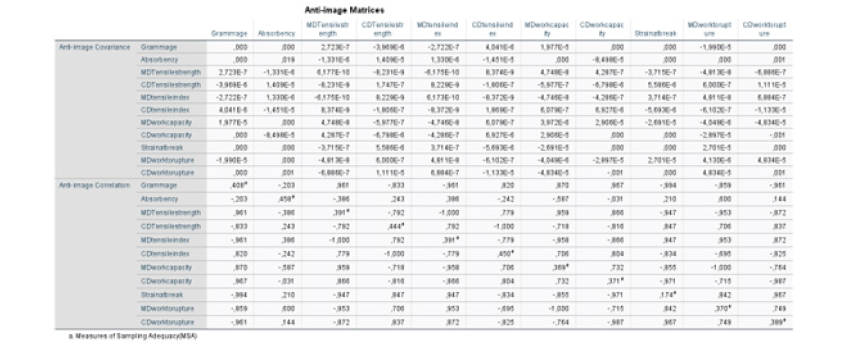
The anti-image correlation matrix in Figure 36 was examined to assess the suitability of the individual variables for inclusion in the factor analysis.
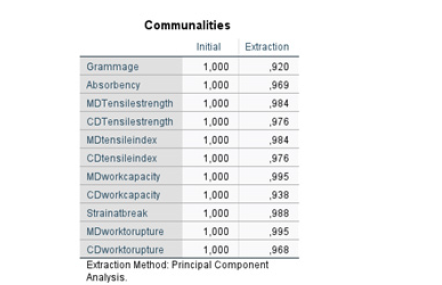
The table in Figure 37 presented the initial and extraction communalities for each variable included in the analysis.
Figure 37:Communalities of the variables included in the factor analysis of tissue-paper properties.
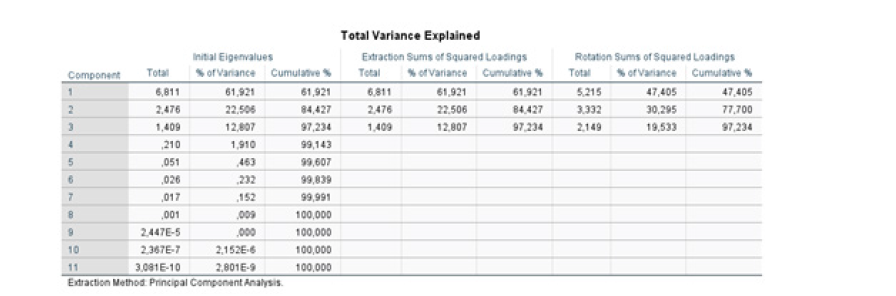
The table in Figure 38 presented the eigenvalues, percentage of variance and cumulative percentage of variance explained by each factor or component.
Figure 38:Total variance explained by the extracted factors in the Factor Analysis of Tissue-Paper Properties.
The plot in Figure 39, illustrated the contribution of each component to the total variance and facilitated the identification of the number of components to retain by examining the point at which the curve began to level off (the scree or elbow criterion). Components preceding this point accounted for a comparatively greater proportion of the total variance, whereas subsequent components contributed progressively less.
Figure 39:Scree plot of the principal component analysis (PCA), showing the eigenvalues of the extracted components in descending order.
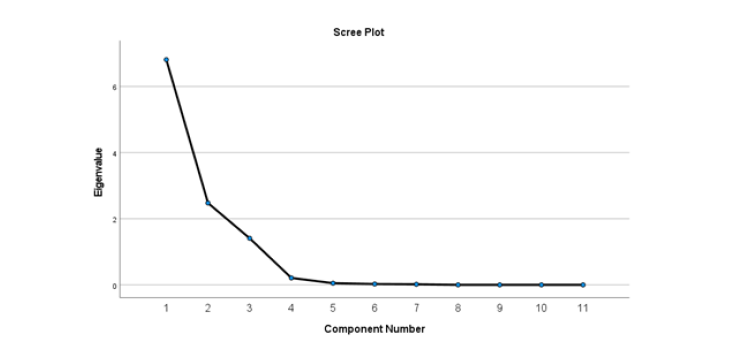
Figure 40:The Component Matrix obtained from principal component analysis (PCA), showing the loadings of the measured variables on the extracted components.
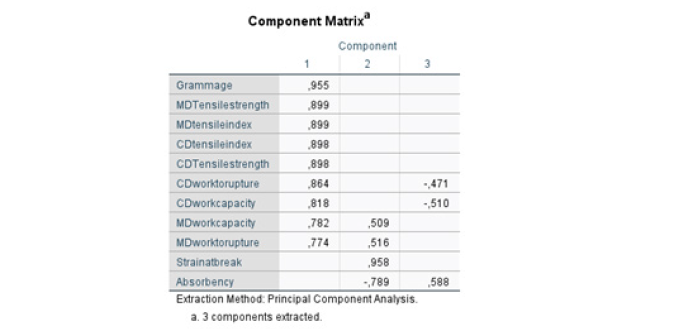
The table in Figure 40 displayed the component loadings, which were the Pearson correlation coefficients between each original observed variable and each extracted principal component. The rows represented the properties measured in the dataset and the columns represented the extracted principal components.
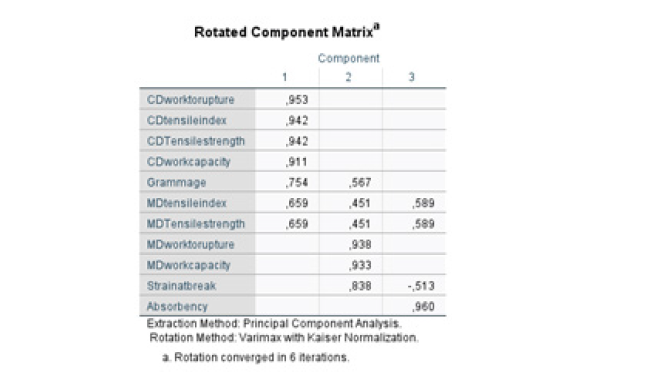
The table in Figure 41 showed the factor loadings of the measured physical and mechanical properties of the tissue paper samples after component rotation.
Figure 41:Rotated component matrix obtained from principal Component analysis (PCA).
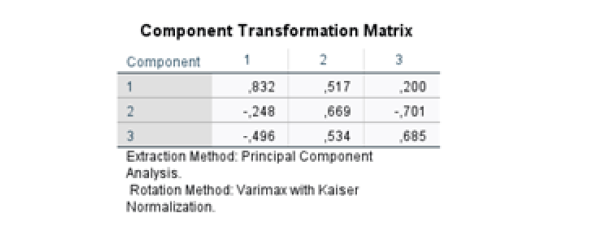
The table in Figure 42 showed the coefficients describing the rotation applied to the initial component solution.
Figure 42:Component transformation matrix obtained from principal component analysis.
Principal Component Analysis (Figure 43) revealed which properties-controlled tissue performance. Figures 33-43 presented correlation and principal component analysis (PCA) outputs.
Figure 43:Component plot illustrating the relationships between the physical and mechanical properties of the investigated tissue paper products in the principal component space.

Two-way analysis of variance
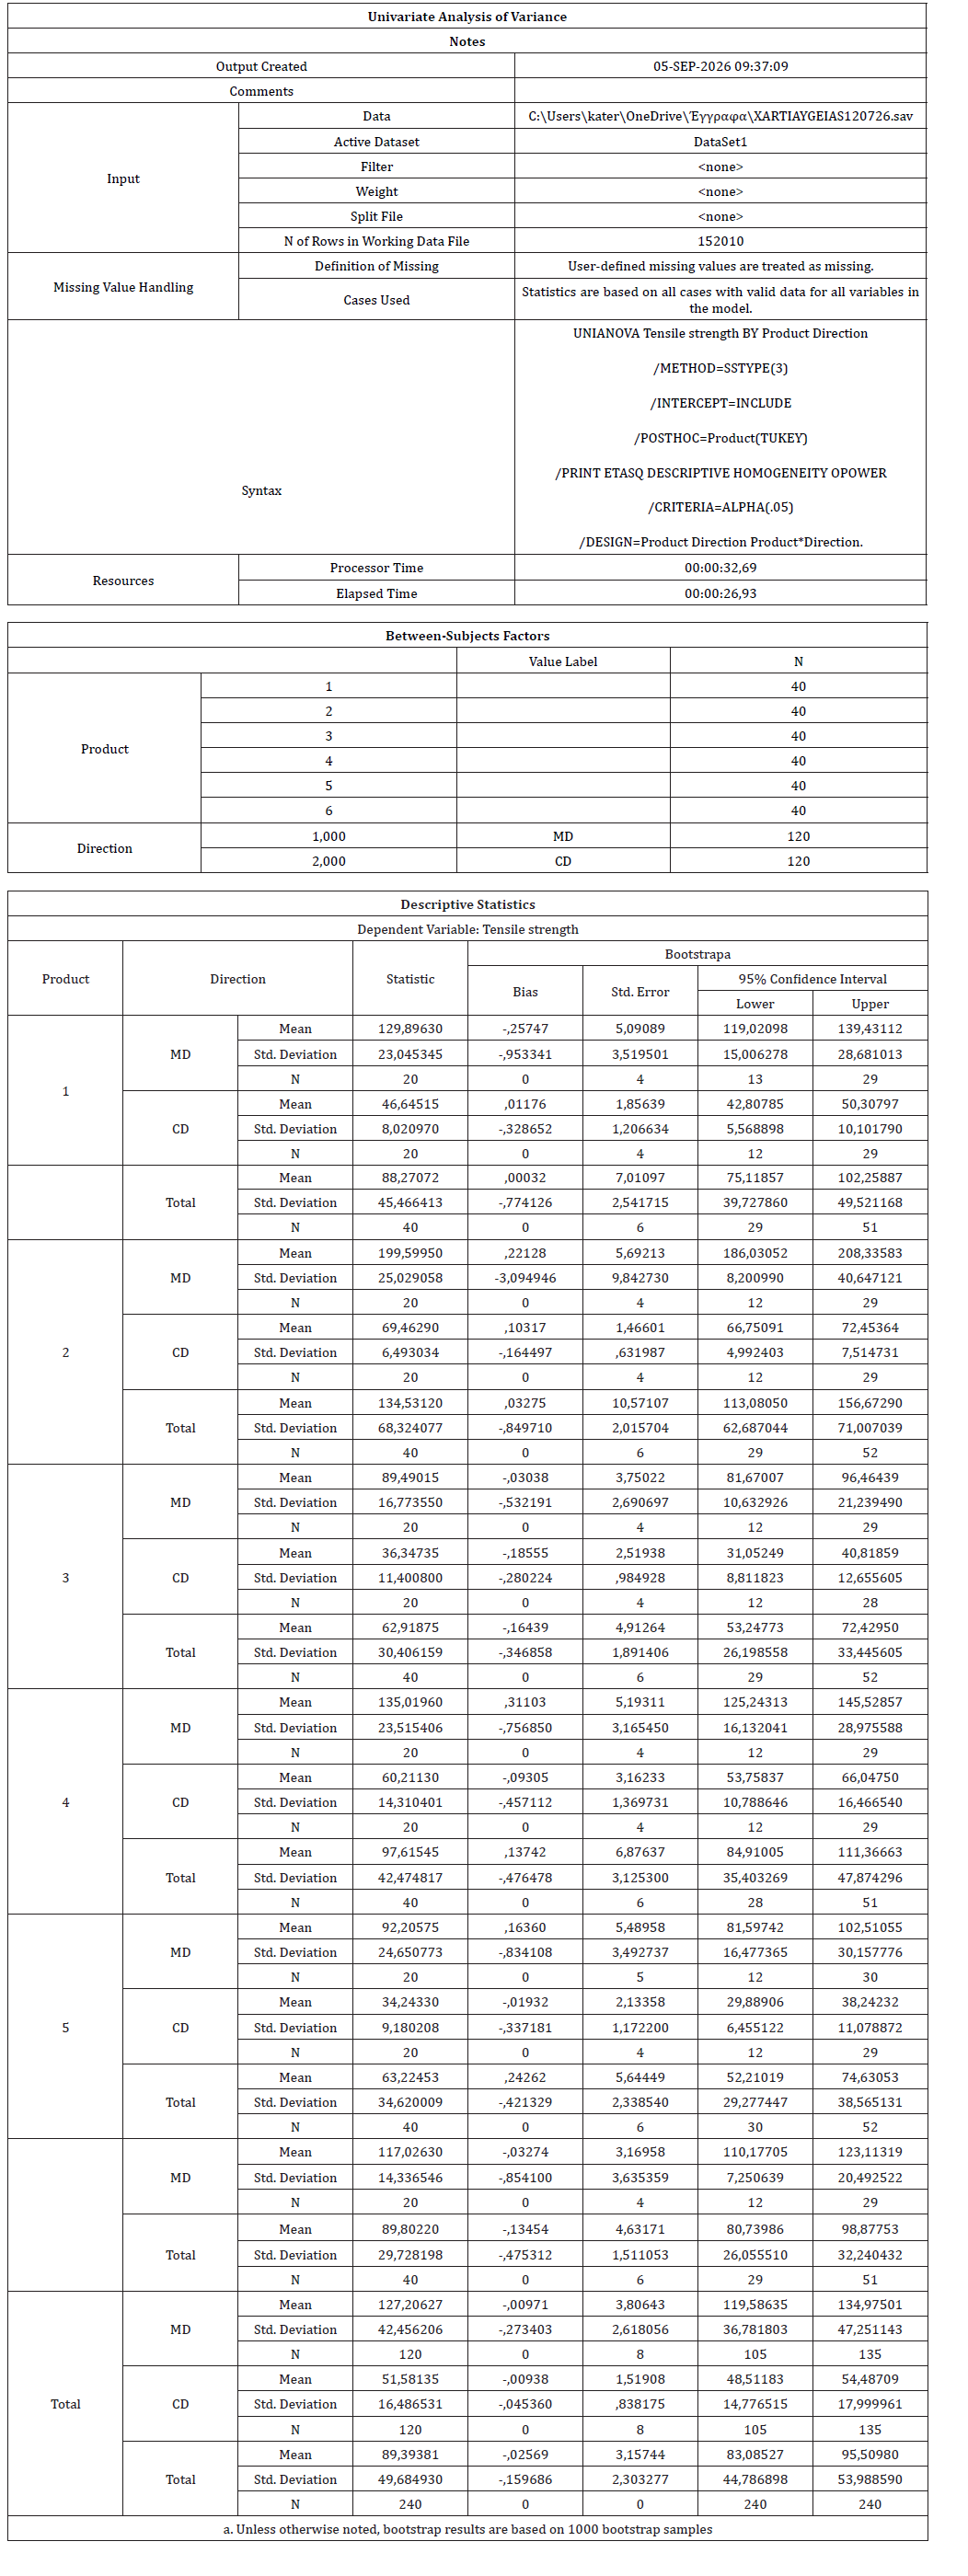
A two-way factorial ANOVA based on Table 5, was conducted using tensile strength as the dependent variable and product and direction as fixed factors. The experimental design was balanced, with 40 observations for each product and 120 observations for each testing direction. The factorial analysis was based on the complete 240-observation dataset.
Table 5:Physical and mechanical properties of the six commercial tissue paper products, related to Table 1.

The table in Figure 44 presented the descriptive statistical measures for the analyzed variables, together with bootstrap estimates used to assess the stability and uncertainty of these statistics.
Figure 44:Descriptive statistics with bootstrap estimates for the physical and mechanical properties of the tissue paper samples.
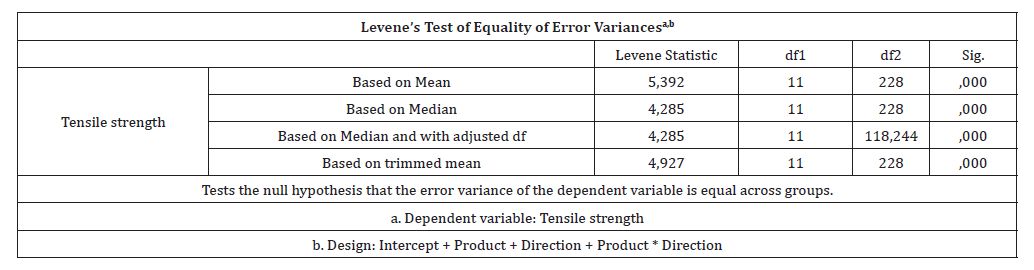
The Levene test (Figure 45), included in the two-way ANOVA output (Table 5), was significant, F(11,228) = 5.392, p<0.001, indicating heterogeneity of variance among the product x direction groups. This assumption violation should be acknowledged when interpreting the factorial ANOVA. However, the design was balanced and the observed effects were very large, making the principal patterns highly pronounced. The reported effect sizes should therefore be considered alongside, rather than independently of, this variance heterogeneity.
Figure 45:The Levene test.
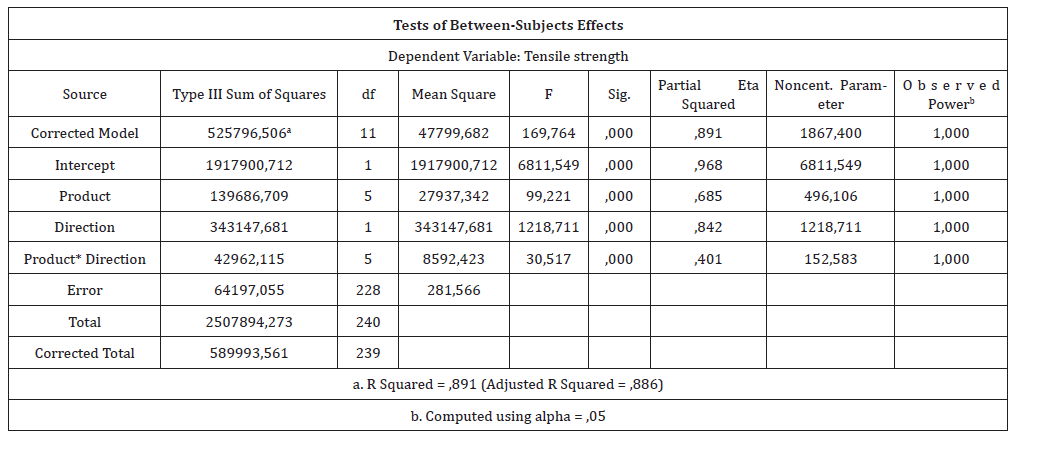
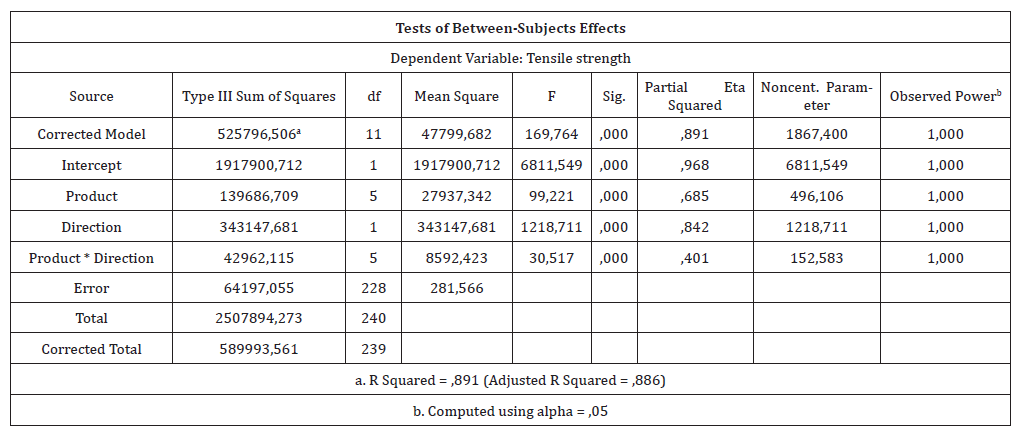
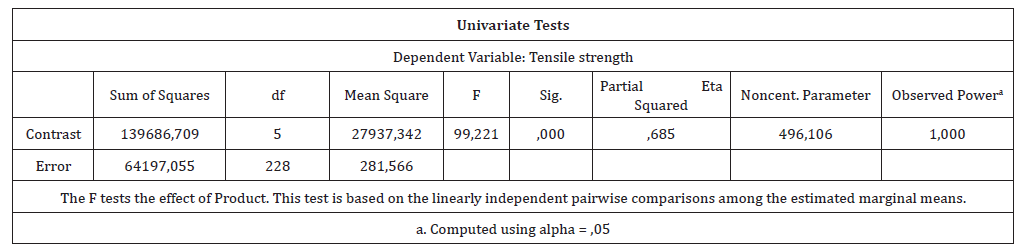
The main effect of product in Figure 46 was statistically significant, F(5,228)=99.221, p<0.001, ηp2=0.685. That confirmed that tensile performance differed substantially among the six commercial products even after the testing direction was included in the model. That represented a large product effect, indicating that the commercial products differed substantially in their overall tensile performance. The overall factorial model (Figure 46), was highly significant, F(11,228) =169.764, p<0.001, with ηp2 =0.891 and R2=0.891. Thus, the fitted model explained approximately 89.1% of the variance in tensile strength in the analyzed dataset.
Figure 46:Effect of product
The table in Figure 47 presented pairwise comparisons between group means, indicating the mean differences, standard errors, significance levels and confidence intervals. The results were used to identify statistically significant differences between groups following analysis of variance (ANOVA) with the Tukey HSD procedure controlling the family-wise error rate across multiple comparisons.
Figure 47:Multiple comparisons using Tukey’s honestly significant difference (HSD) test for the physical and mechanical properties of the tissue paper samples.
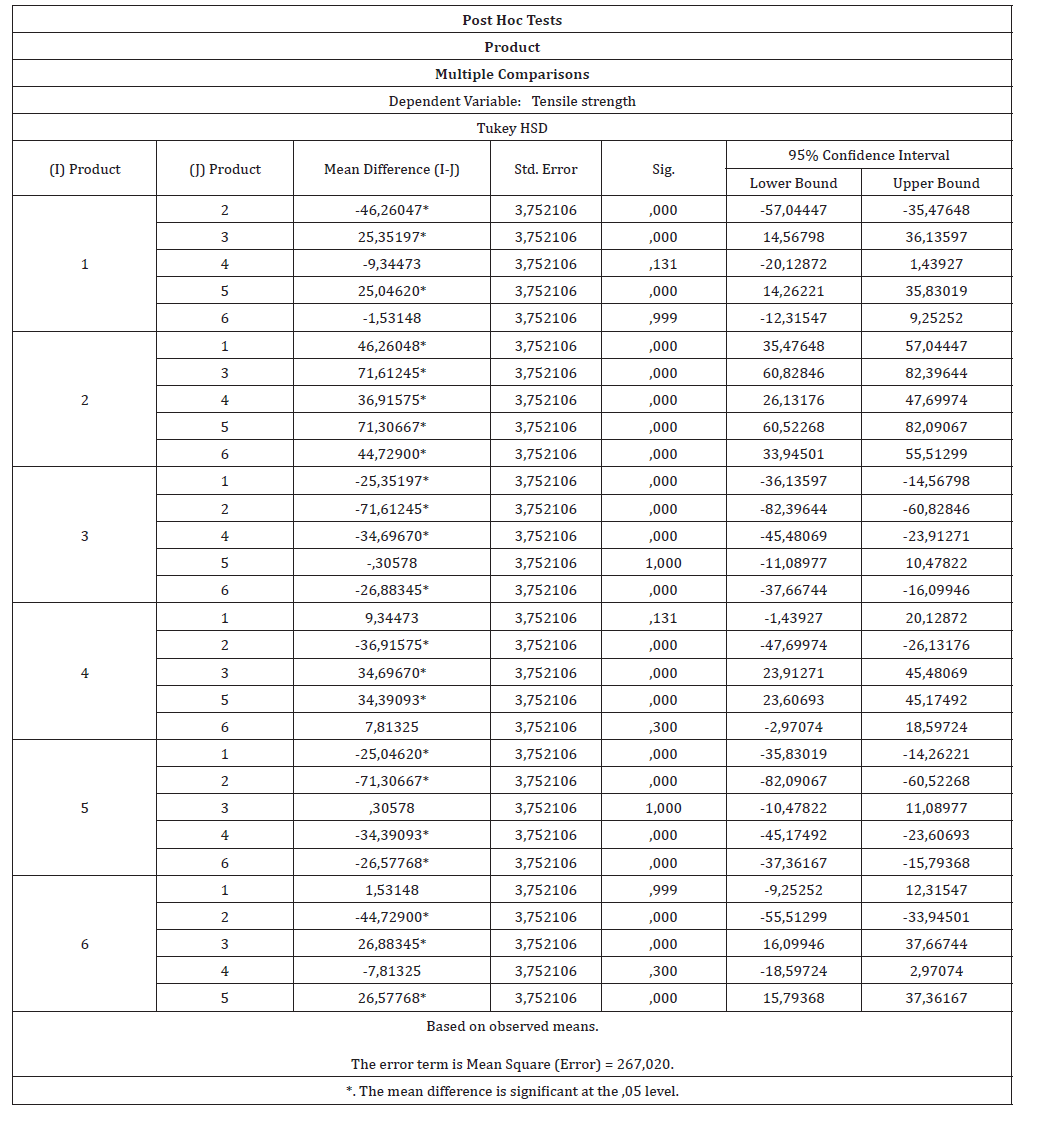
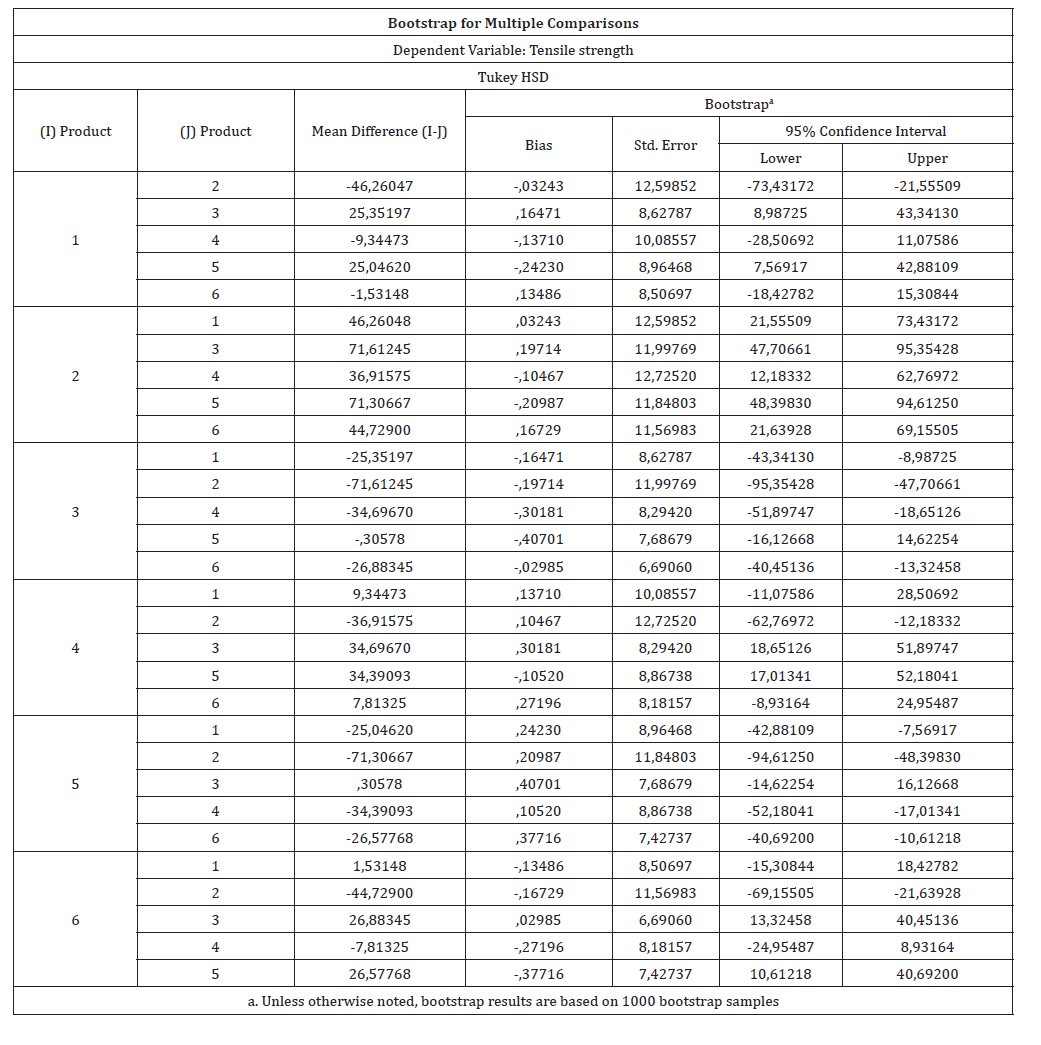
Figure 48:Table of Bootstrap results for multiple comparisons.
The table in Figure 49, grouped products with statistically comparable mean tensile strengths into homogeneous subsets at the 5% significance level (α=0.05). Products appearing within the same subset did not exhibit statistically significant differences in mean tensile strength according to the Tukey HSD procedure (Figures 50 & 51).
Figure 49:Homogeneous subsets of tensile strength for the six tissue paper products, identified using Tukey’s honestly significant difference post-hoc test.
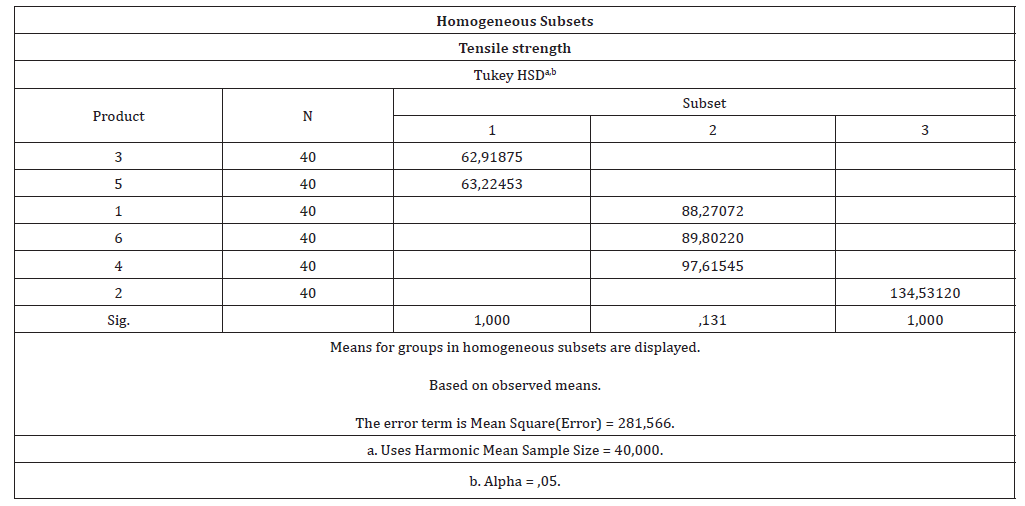
Figure 50:Table of Descriptive Statistics.
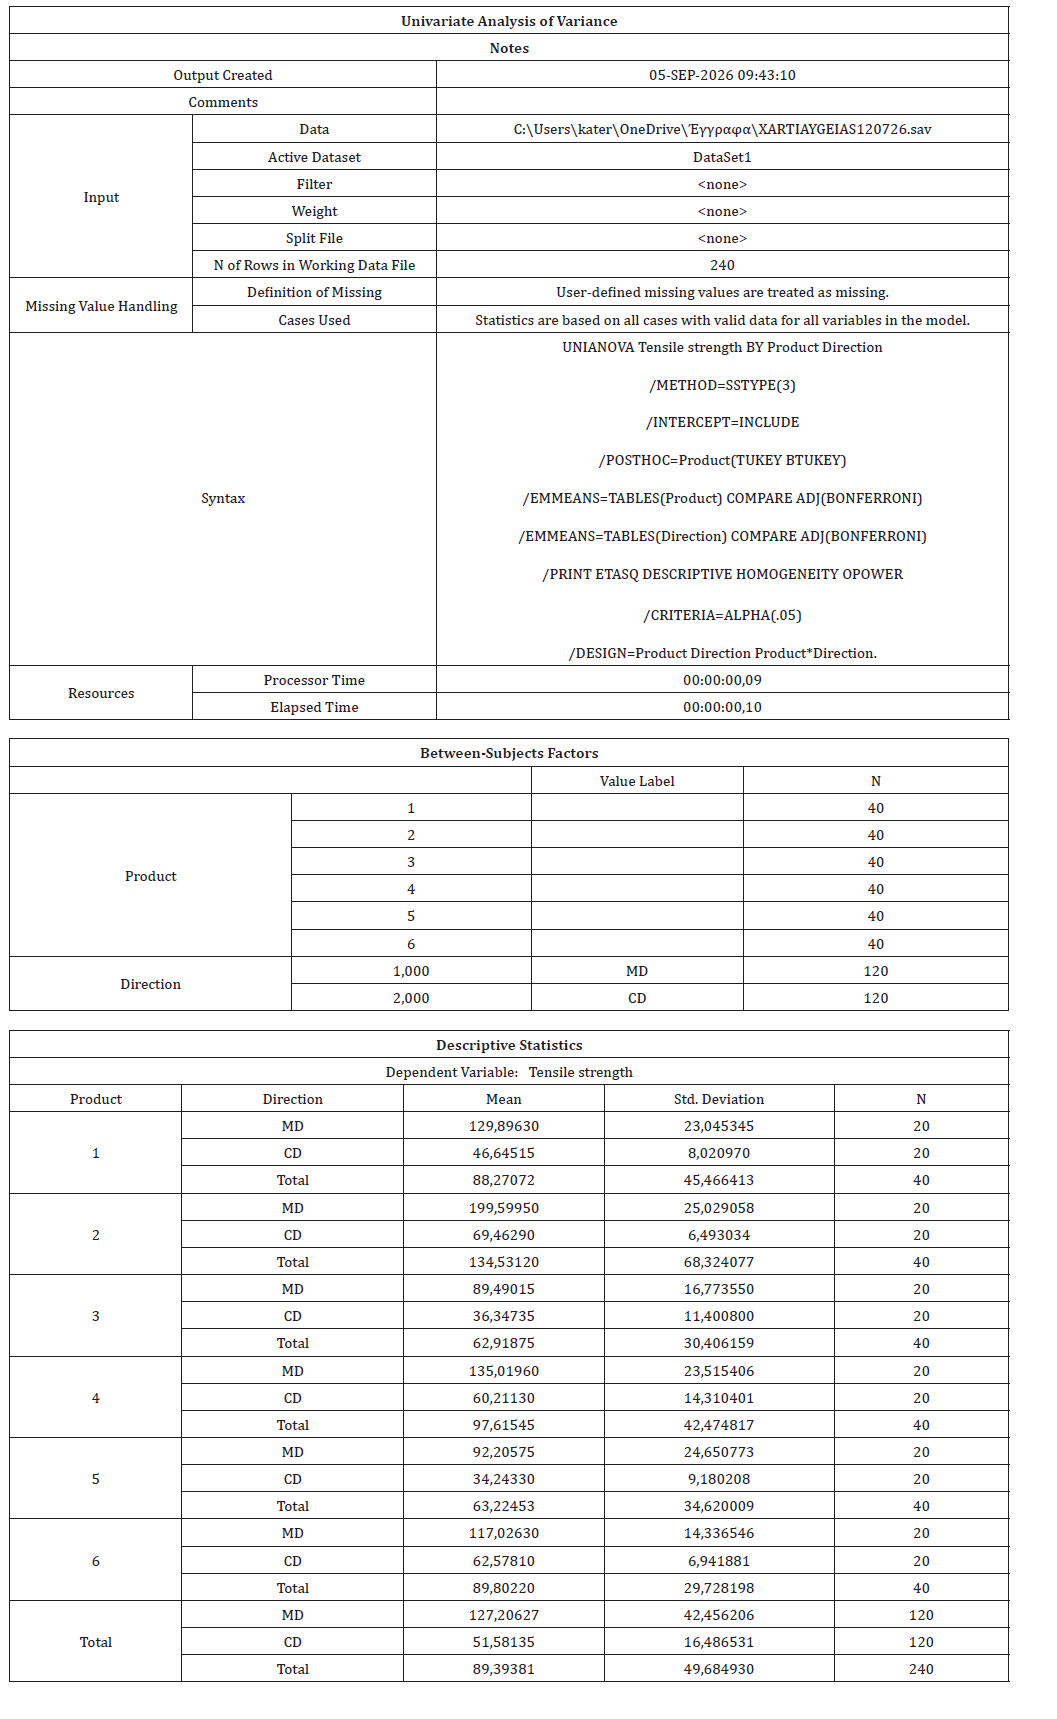
Figure 51:Table of Levene’s Test of Equality of Error Variances.
The interaction between product and testing direction was also highly significant, F(5,228)=30.517, p<0.001, ηp2=0.401 (Figure 52). That finding was particularly important because it demonstrated that the influence of testing direction was not identical for all six commercial products. Although every product was stronger in MD than in CD, the magnitude of the MD-CD difference varied among products. Therefore, the product type influenced not only absolute tensile strength but also the degree to which tensile performance depended on orientation. The interaction therefore provided statistical support for the product-specific differences in anisotropy identified through the MD/CD ratios. Therefore product 2 actually combined the highest tensile strength with the highest observed MD/CD ratio, whereas product 6, displayed the lowest directional ratio.
Figure 52:Table of Subjects Effects.
Estimated Marginal Means
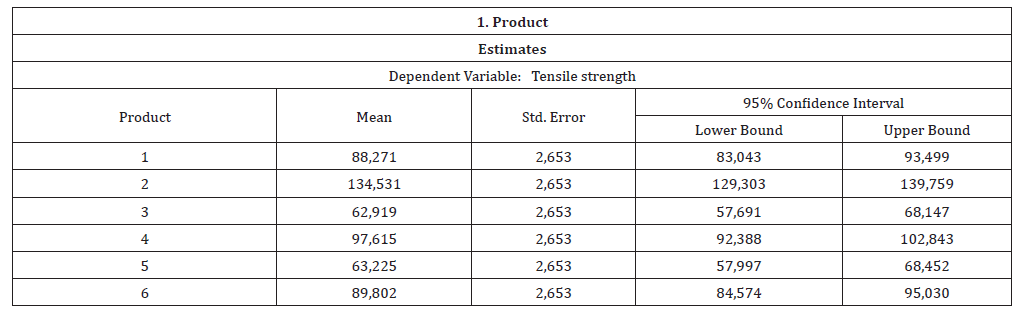
The estimated marginal means and their confidence intervals were presented in the factorial ANOVA output. The estimated marginal means were 88.27, 134.53, 62.92, 97.62, 63.22, and 89.80N/m for products 1-6, respectively (Figure 53). Product 2 had an estimated marginal mean of 134.53N/m, while products 3 and 5 had values of 62.92 and 63.22N/m respectively. Products 1, 4 and 6, occupied an intermediate range of 88.27-97.62N/m.
Figure 53:Table of Estimates.
The corresponding pairwise comparisons in Figure 54 further confirmed the significant differences involving product 2 and the similarity between products 3 and 5 and among products 1, 4 and 6 (Figure 55).
Figure 54:Table of Pairwise Comparisons
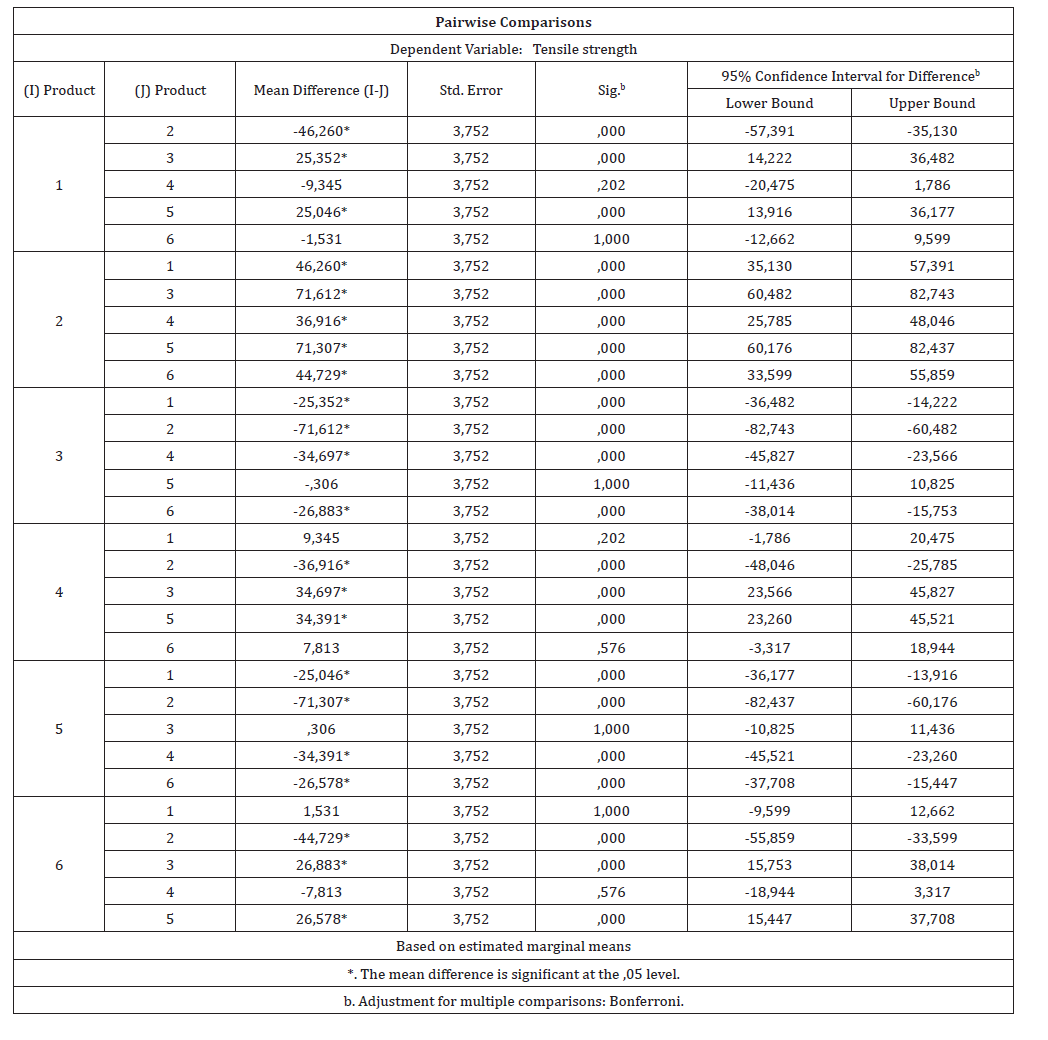
Figure 55:Table of Univariate Tests.
The estimated overall mean was 127.21N/m for MD and 51.58N/m for CD (Figure 56). The difference between directions was therefore approximately 75.63N/m (Figure 57). That very large effect confirmed that tissue-paper tensile strength was strongly direction- dependent. Thus, testing direction represented the largest modeled source of systematic variation in tensile strength.
Figure 56:Table of Estimates

Figure 57:Table of Pairwise Comparisons
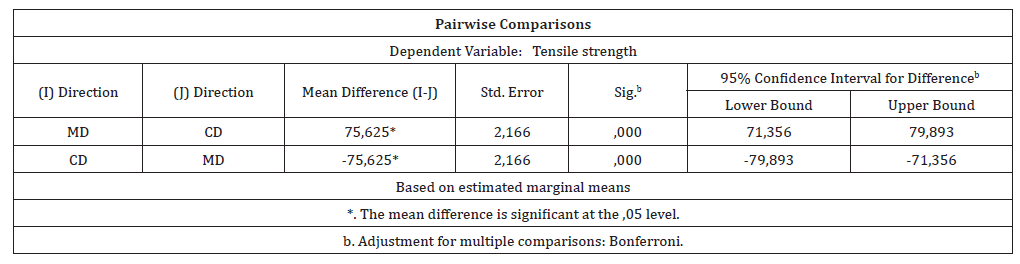
Figure 58:Table of Univariate Tests.
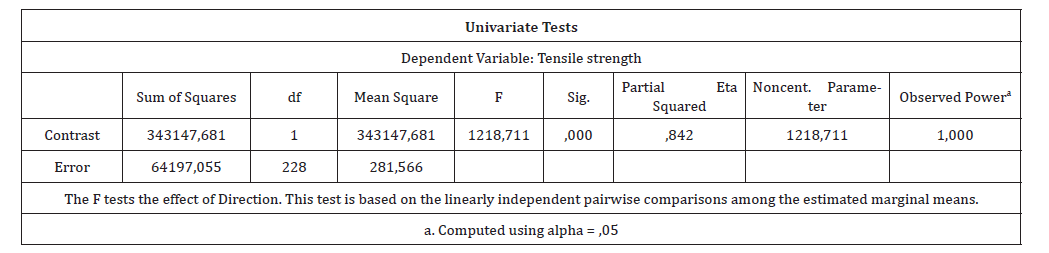
The effect of testing direction (Figure 58), was the largest main effect in the model, F(1,228)=1218.711, p<0.001, ηp2 =0.842.
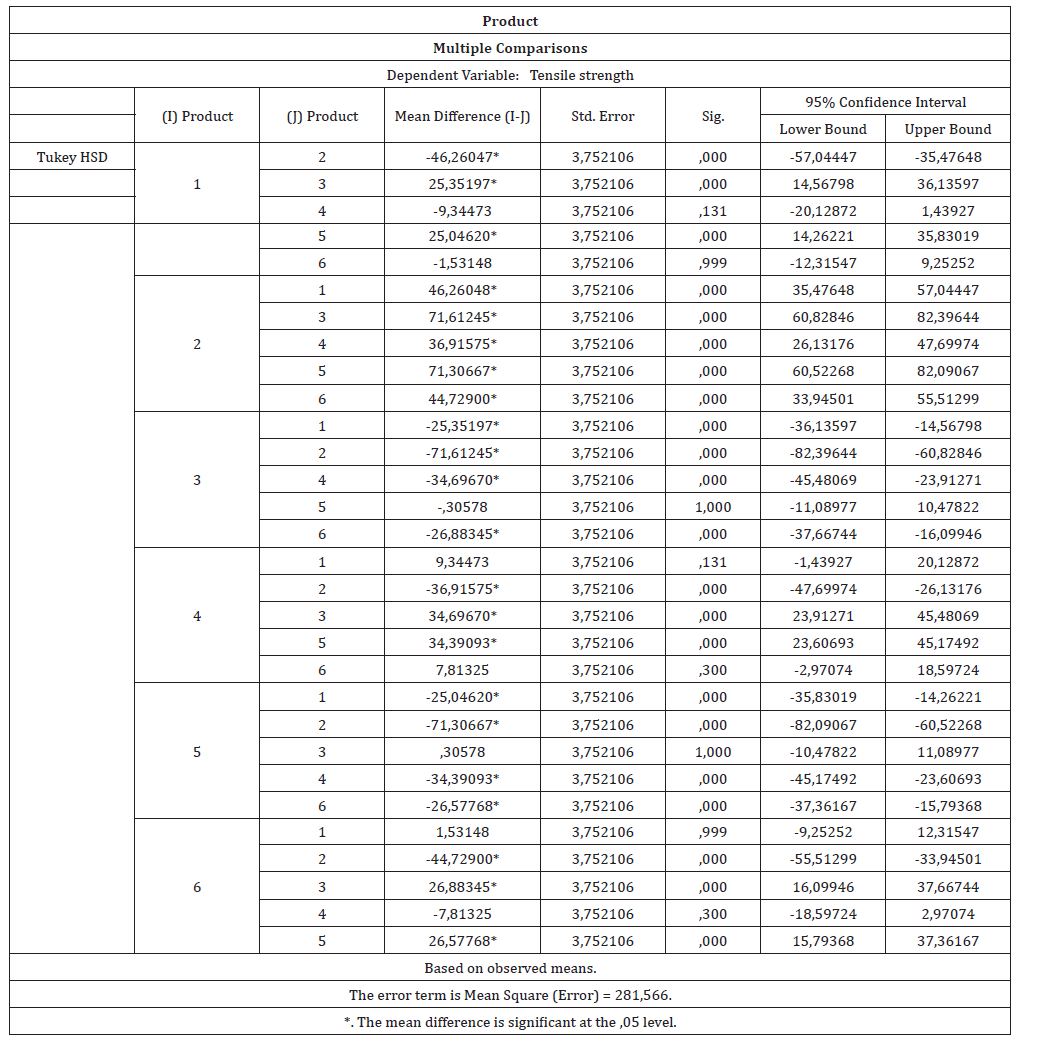
Figures 50-59 contained the additional factorial-analysis outputs. Figure 51 was identified as an ANOVA table, Figure 52 as an estimated-marginal-means or related comparison display, and Figures 53-59 as post-hoc comparisons and homogeneous-subset outputs.
Figure 59:Table of Multiple Comparisons.
Homogeneous Subsets
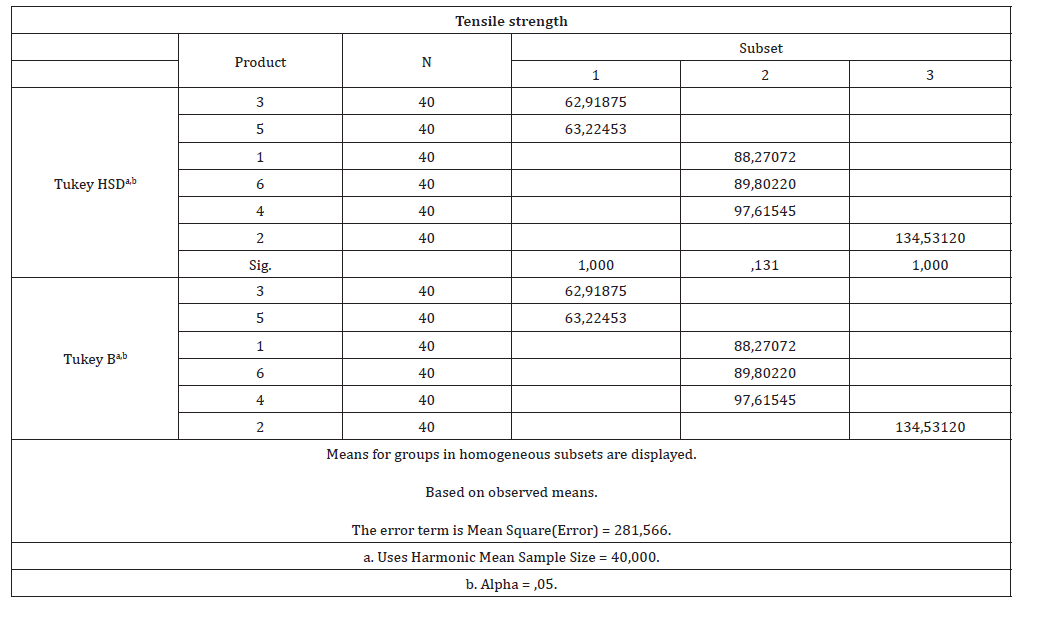
Tukey comparisons (Figure 60) showed that product 2 differed significantly from every other product. Products 3and 5 did not differ significantly, while products 1,4 and 6, formed an intermediate group with no significant differences among these three products. The products could broadly be classified into three tensile-performance groups. The lower-strength group comprising the products 3 and 5, the intermediate-strength group comprising products 1,4, and 6 and the highest-strength group comprising product 2.
Figure 60:Table of Homogeneous Subsets.
Finally, Figures 1-12 and Tables 1-3 demonstrated that the six commercial tissues were mechanically distinct despite their relatively narrow grammage range. The dominant characteristic was anisotropy. The two-way ANOVA confirmed this pattern statistically and showed that direction accounted for a very large proportion of the modeled variation. Product type exerted a substantial independent effect and the significant Product x Direction interaction demonstrated that the directional response depended on the particular commercial product. Product 2 illustrated that clearly, combining high absolute tensile strength with a high MD/CD ratio. Product 6, exhibited a lower MD/CD ratio, indicating a comparatively smaller directional difference. Products 3 and 5 showed similarly low overall tensile performance, while Products 1,4 and 6 occupied an intermediate range. The combined use of tensile strength, tensile index, MD/CD ratio, strain at break, work capacity and work-to-rupture provided a more complete mechanical characterization than any single parameter. The MD/CD ratio added structural information concerning directional dependence, while tensile index permitted comparison after accounting for basis weight and energy-related parameters characterized the behavior of the sheet up to failure.
Discussion
The most pronounced finding in this study was the strong anisotropy observed in every product. Mean tensile strength in MD was approximately 2.47 times the overall CD value. That behavior was consistent with the structural characteristics of paper, in which preferential fiber orientation developed during sheet formation and manufacturing. The large main effect of testing direction (ηp2=0.842) provided strong statistical evidence for this anisotropic behavior. That effect was larger than the product effect alone, although product type also exerted a substantial influence (ηp2=0.685). Consequently, both the identity of the product and the direction in which the sheet was loaded were important determinants of tensile performance. Product 2 was particularly distinctive. It showed the highest overall tensile strength, with a MD mean of 199.6N/m and a CD mean of 69.5N/m. Its average MD/ CD ratio of 2.87 was also the highest among the six products. That combination suggested a strongly direction -dependent structure and a comparatively high level of mechanical reinforcement along the machine direction. At the opposite end of the tensile-strength scale, products 3 and 5, exhibited very similar means, 62.92N/m and 63.22N/m, respectively. The post-hoc analysis confirmed that these two products were not significantly different in overall tensile strength. Their similar performance indicated that differences in commercial formulation or manufacturing structure may have produced comparable mechanical outcomes even when the products were independently manufactured. Products 1, 4, and 6 formed an intermediate group. Their overall means ranged from approximately 88N/m to 98N/m, and pairwise comparisons did not reveal significant differences among these products. However, their directional behavior was not identical. Product 6 had the lowest MD/CD ratio, 1.87 while product 1 had a ratio of 2.78 and product 4 a ratio of 2.24.
Thus, two products with relatively similar overall tensile strengths may have had different degrees of anisotropy. That observation was reinforced by the statistically significant product x direction interaction. The interaction indicated that the effect of direction depended on the product. It was therefore insufficient to report only an overall MD-versus-CD difference; the directional response of each commercial product should also be considered. The MD/CD ratio was particularly useful in this context because it separated directional structure from absolute strength to some extent. A high ratio indicated a pronounced difference between MD and CD performance, whereas a lower ratio indicated a comparatively more balanced directional response. In the present study, product 6 had the lowest ratio, suggesting a relatively less anisotropic tensile response, whereas product 2 showed the highest ratio. The tensile-index results showed patterns consistent with the tensile-strength results. Because tensile index normalized tensile strength with respect to grammage, its use was useful when comparing tissue products whose basis weights were not identical. The results in the present study suggested that the major differences in tensile performance could not be attributed simply to small differences in basis weight. The products had relatively narrow grammage ranges, while their tensile properties differed substantially.
The work-capacity and work-to-rupture results, also followed the general tensile-strength pattern. Products with greater tensile resistance generally exhibited greater energy absorption before rupture, although the magnitude of this relationship differed according to testing direction. This was physically reasonable because a tissue network capable of sustaining greater tensile stress over a deformation interval could generally absorb more mechanical energy before failure. Strain at break provided a complementary aspect of mechanical behavior. Unlike tensile strength, which described resistance to applied force, strain at break characterized the deformation experienced before failure. The results therefore indicated that tissue performance could not be adequately characterized by tensile strength alone. A tissue product may have possessed high tensile strength but a different deformation response from another product of comparable strength. An important statistical consideration was that the Levene test indicated significant heterogeneity of variance among the twelve product x direction groups. Consequently, the assumption of equal variances was not fully satisfied. Nevertheless, the experimental design was balanced, with 20 independent observations in every product x direction cell, and the observed effects were very large. The factorial ANOVA provided strong evidence for the existence of product, direction and interaction effects. The use of separate specimens for MD and CD was also important for interpretation. Because the two directions were not measured repeatedly on the same physical specimen, direction was appropriately treated as an independent between-specimen factor rather than as a repeated-measures factor.
That strengthened the suitability of the present factorial design for examining the independent and interactive effects of product and direction. Overall, the results indicated that commercial tissue papers should be regarded as structurally anisotropic materials whose mechanical performance depended strongly on both product characteristics and loading direction. The substantial differences observed between products despite relatively similar grammage demonstrated the importance of fiber-network structure and manufacturing history in determining tensile behavior [12].
Conclusion
The present study demonstrated differences in the mechanical behavior of six commercially available tissue paper products despite their relatively similar grammage. The experimental results obtained from 240 tensile observations showed a consistent and pronounced anisotropy, with tensile strength in the machine direction exceeding that in the cross direction for every investigated product. The overall mean tensile strength corresponded to an approximately 2.47-fold difference between the two testing directions. The individual product/subsample measurements presented in Figures 1-12 and summarized in Table 1 consistently demonstrated this directional behavior. The MD/CD tensile-strength ratio provided a useful quantitative descriptor of this anisotropy. As shown in Tables 2 and 3, the product-specific mean ratios ranged from 1.87 to 2.87.
The variation among products demonstrated that directional dependence was not uniform across commercial tissue papers and could therefore provide useful information concerning differences in sheet structure and fiber orientation. The statistical analyses further confirmed the observed differences. One-way ANOVA demonstrated significant differences among products for tensile strength, tensile index, work capacity, work to rupture and strain at break. The two-way factorial ANOVA demonstrated significant effects of product, testing direction and their interaction, with partial eta-squared values of 0.685, 0.842 and 0.401, respectively. The significant interaction was particularly important because it demonstrated that the magnitude of the MD-CD difference depended on the commercial product and could not be described solely by a common directional effect. The tensile-index, work-capacity and work-to-rupture results further showed that tensile strength should be considered together with deformation and energy-absorption characteristics. Products with greater tensile resistance, generally demonstrated greater capacity to absorb mechanical work before rupture, whereas strain at break revealed differences in extensibility that were not necessarily parallel to tensile strength. Finally, the study demonstrated that standardized tensile testing according to ISO 12625 provided an effective framework for differentiating commercial tissue papers and for characterizing their mechanical anisotropy. The combined evaluation of tensile strength, tensile index, MD/CD ratio, strain at break and work-to-rupture provided substantially more information about tissue performance than tensile strength alone. These parameters could therefore be useful for quality characterization, comparative product assessment and the interpretation of structural differences among commercial tissue papers..
References
- De Assis T, Reisinger LW, Pal L, Pawlak J, Jameel H, et al. (2018) Understanding the effect of machine technology and cellulosic fibers on tissue properties-A Review. BioRes 13(2): 4593-4629.
- Joanna C Vieira, Antonio de O Mendes, Ana M Carta, Paulo T Fiadeiro, Ana P Costa (2020) Experimental dataset supporting the physical and mechanical characterization of industrial base tissue papers. Data in Brief 33: 106434.
- Wang Y, Zambrano F, Venditti R, Dasmohapatra S, De Assis T, et al. (2019) Effect of pulp properties, drying technology, and sustainability on bath tissue performance and shelf price. BioRes 14(4): 9410-9428.
- Chi Wai Kan, Maggie Hoi Man Leung, Rattanaphol Mongkhoirattanasit (2016) Tensile properties analysis of paper towels, Applied Mechanics and Materials 848: 162-165.
- Takashi Yokoyama, Kenji Nakai, Tomoya Inagaki (2009) Orientation dependence of in-plane tensile properties of paper: Experiments and theories. Journal of the Japanese Society for Experimental Mechanics 9: 86-91.
- Shubham Agarwal, Prabhat Srivastava, Sheldon I Green, Srikantha Phani A (2023) The influence of microstructure on the tensile properties of a creped tissue paper: Modeling and experiments. Mechanics of Materials 176: 104505.
- ISO 12625-4 (2022) Tissue paper and tissue products-Part 4: Determination of tensile strength, stretch at break, and tensile energy absorption, pp. 1-9.
- ISO 187 (2022) Paper, board and pulps-Standard atmosphere for conditioning and testing and procedure for monitoring the atmosphere and conditioning of samples, pp. 1-7.
- ISO 186 (2002) Paper and board-Sampling to determine average quality, pp. 1-9.
- ISO 12625-6 (2016) Tissue paper and tissue products, Part 6: Determination of grammage, pp. 1-10.
- TAPPI T 432 cm-21 (2026) Water absorbency of bibulous papers, pp.1-3.
- Pawlak JJ, Frazier R, Vera RE, Wang Y, Gonzalez R (2022) Review: The softness of hygiene tissue. BioResources 17(2): 3509-3550.
© 2026 Katerina Chryssou. This is an open access article distributed under the terms of the Creative Commons Attribution License , which permits unrestricted use, distribution, and build upon your work non-commercially.
Editor In Chief







.jpg)































Signup for Newsletter

Quick Links
 Editorial Board Registrations
 Submit your Article
 Best Paper of the Volume
 Reprints
 Refer a Friend
 Advertise With Us
Our Recent Edition





Top Editors




.jpg)

















.bmp)
.jpg)
.png)
.jpg)













.jpg)






.png)

.png)




.png)




Financial Support

Sponsors

Latest e-Books

Latest Video

 a Creative Commons Attribution 4.0 International License. Based on a work at www.crimsonpublishers.com.
Best viewed in

 | Above IE 9.0 version