

- About Us
- Information
-

The Author ensures that the research has been conducted responsibly and ethically with adherence to all relevant regulations. read more..
- For Authors
- For Reviewer
- Manuscript Guidelines
- Membership
- Publication Ethics
-
- Journals
- Reprints
- e-Books
- Videos
- Policies
- Contact Us
 COVID-19
- Submissions



Full Text
Annals of Chemical Science Research
Chemical and Optical Characterization of a Commercial Liquid Detergent Using FT-IR, Reflectance Spectroscopy, Colorimetry, and Computational Analysis
Katerina Chryssou*, and Eugenia Lampi
General Chemical State Laboratory, B’ Chemical Division of Athens, Department A’ Tsocha 16, Greece
*Corresponding author:Katerina Chryssou, General Chemical State Laboratory, B’ Chemical Division of Athens, Department A’ Tsocha 16, 11521 Athens, Greece
Submission: June 29, 2026;Published: July 20, 2026

Volume5 Issue4July 20, 2026
Abstract
The present study investigated the chemical composition and optical properties of a commercial liquid detergent, Servin Quality Ultra, 1L, cherry aroma, using FT-IR spectroscopy, visible reflectance spectroscopy (400-700nm), colorimetric analysis and computational chemistry calculations. The detergent was analyzed in 3%w/w ethanol solution, as well as in 1% and 10% w/w aqueous solutions, all showing a stable pH of 6.9. FT-IR spectra revealed the presence of long-chain alkyl surfactants, ethoxylated non-ionic surfactants, and builder components such as phosphonates and silicates. In addition, determination of anionic-active matter by the standard two-phase titration method revealed no detectable anionic surfactants (0.0%w/w), confirming that the formulation was dominated by non-ionic alcohol ethoxylate surfactants. The results were discussed in the context of the different physicochemical characteristics of the non-ionic, anionic, cationic and amphoteric surfactant classes, commonly employed in commercial liquid detergents. The FT-IR analysis of the ethanolic soluble fraction of the liquid detergent Servin revealed characteristic absorption bands corresponding to aliphatic C-H stretching vibrations (~2921cm-1 and 2844cm-1), ether C-O-C stretching modes (1148cm-1-1037cm-1), carbonyl groups (~1739cm-1) and weak aromatic or carboxylate contributions (~1577cm-1) confirming thus the predominance of ethoxylated nonionic surfactants and minor oxygen-containing additives. Reflectance measurements indicated low overall reflectance 6%-8%, with absorption in the green region (500-560nm) and increased reflection in the yellow-orange region (560-600nm), producing a slightly reddish appearance. Reflectance data were further analyzed using the Kubelka-Munk transformation to estimate the optical band gap via Tauc plot methodology. The Kubelka-Munk transformation and Tauc analysis suggested an apparent optical transition energy of approximately 3.1eV, consistent with localized molecular HOMO-LUMO transitions rather than semiconductor-like band structures. The calculated band gap suggested predominantly insulating behavior with localized electronic transitions attributed to molecular chromophores. Colorimetric analysis confirmed this observation, with L*=30.84, a*=+5.56, and b*=-0.53, while ISO brightness which was 6.73% and CIE Whiteness which was 14.83whiteness units, indicated low optical brightness. The results suggested a weak reddish-blue coloration that the color of the detergent was primarily due to minor chromophoric additives rather than the surfactant components. The pH remained constant across concentrations, indicating chemical stability. The results indicated a weakly absorbing, semi-transparent colloidal system with moderate light scattering attributed to micellar structures. Density Functional Theory (DFT) and population analyses performed on a representative ethoxylated alcohol fragment (C6H14O2) demonstrated pronounced charge localization on oxygen atoms and sp3 hybridization along the hydrocarbon backbone, supporting the amphiphilic and insulating nature of the system. This integrated approach demonstrated how FT-IR, reflectance spectroscopy, colorimetry and computational analyses could provide complementary information for detergent characterization by understanding the detergent’s composition and its physicochemical behavior.
Keywords:Liquid detergent; FT-IR spectroscopy; Diffuse reflectance spectroscopy; Colorimetry; Kubelka- Munk analysis; Tauc plot; Surfactants; Nonionic surfactants; Anionic surfactants; Alcohol ethoxylates; Optical properties; CIE whiteness; pH stability; DFT; GAMESS
Introduction
Commercial liquid detergents generally contain one or more classes of surfactants, including anionic, nonionic, cationic and amphoteric surfactants. Anionic surfactants such as linear alkylbenzene sulfonates (LAS) and sodium lauryl sulfate (SLS) provide excellent detergency and foam generation and are widely used in household cleaning products [1]. Nonionic surfactants, particularly alcohol ethoxylates, exhibit superior grease removal, good biodegradability and high compatibility with hard water. Many modern detergent formulations combine these surfactant classes to optimize cleaning efficiency, stability and consumer performance [1]. Therefore, characterization of the surfactant composition is essential for understanding the physicochemical and optical behavior of detergent systems.
In general, commercial liquid detergents are complex colloidal formulations containing surfactants, builders, fragrances, additives, colorants and stabilizing agents designed to achieve efficient cleaning while maintaining stability and aesthetic appeal [1,2].
The chemical composition of detergents directly influences their physicochemical and optical properties, including color, opacity and reflectance behavior. Their physicochemical performance depends strongly on the molecular structure and interactions of their individual components, particularly the amphiphilic surfactants that govern micelle formation, solubilization, foaming and wetting behavior. In addition to their cleaning efficiency, modern detergent formulations are designed to possess specific optical properties, including transparency, opacity, brightness, and coloration, which influence product quality.
Nonionic surfactants, especially alcohol ethoxylates are among the most widely employed detergent ingredients due to their excellent detergency, low toxicity, biodegradability and compatibility with other formulation components [3]. These compounds contain hydrophobic alkyl chains and hydrophilic ethoxylated segments, allowing self-assembly into micellar structures in aqueous media [4,5]. The optical behavior of such colloidal systems is strongly influenced by both molecular electronic transitions and light-scattering effects associated with micellar aggregates.
Fourier Transform Infrared (FT-IR) spectroscopy is widely used for identifying functional groups and determining the presence of surfactants [6] and inorganic additives. FT-IR is an analytical technique which enables the rapid identification of functional groups of detergent formulations, associated with surfactants, alcohols, ethers, phosphonates and silicates. Characteristic vibrational bands provide valuable information regarding the molecular composition and chemical interactions within the detergent system.
Complementarily, visible reflectance spectroscopy provides insight into how a material interacts with light, which directly relates to perceived color. Diffuse reflectance spectroscopy [7] in the UV-visible region can provide insight into absorption and scattering phenomena arising from chromophoric additives and colloidal organization. Reflectance measurements are particularly useful for semi-transparent or scattering systems such as liquid detergents, where conventional transmission spectroscopy may be limited.
The Kubelka-Munk formalism has been extensively used for interpreting diffuse reflectance spectra of scattering materials and for estimating apparent optical transition energies through Tauctype analysis [8]. Although originally developed for homogeneous solid systems, the Kubelka-Munk approach can provide useful qualitative information for colloidal and multiphase systems, including surfactant-based formulations. In detergent systems, however, optical transitions originate primarily from localized molecular orbitals [9] rather than from delocalized electronic bands typical of semiconductors. Consequently, apparent “band-gap” values derived from Tauc analysis could better be interpreted as molecular HOMO-LUMO transition energies associated with organic chromophores and oxygen-containing functional groups.
Colorimetric analysis using CIE L*a*b* parameters [10], enables quantitative evaluation of visual appearance. Colorimetric analysis based on the CIE Lab* color space provides a quantitative description of detergent appearance and optical brightness. Parameters such as lightness (L*), redness-greeness (a*) and yellowness-blueness (b*) can be directly correlated with reflectance behavior and the presence of dyes, fragrances, or fluorescent whitening agents.
In recent years, computational chemistry methods such as Density Functional Theory (DFT) and Time-Dependent Density Functional Theory (TD-DFT) [11] have become increasingly important for interpreting spectroscopic and optical properties of surfactant systems. Electronic structure calculations provide molecular-level insight into charge distribution, orbital localization, bond polarization and electronic transitions, enabling direct correlation between molecular structure and experimentally observed optical behavior [12].
This study integrates FT-IR, reflectance spectroscopy and colorimetric data to establish correlations between the chemical structure and optical properties of a liquid detergent, as well as to assess its stability across different concentrations. The aim of the present work is therefore to perform an integrated chemical, optical and computational characterization of the commercial liquid detergent Servin Quality Ultra using FT-IR spectroscopy, diffuse reflectance spectroscopy, colorimetric analysis, Kubelka-Munk/Tauc analysis, and DFT calculations. Particular emphasis is placed on correlating molecular composition with optical behavior, scattering effects and electronic transitions in the detergent system.
Experimental
Materials
All compounds were AR quality and they were used without further purification. All solutions were prepared using deionized water of conductivity <1μS/cm. Ethanol absolute 2.5L UN 1170, was from Carlo Erba. Hyamine 1622 solution, 0.004mol/l was from Merck Germany. Phenolphthalein 50g Chim. Pure was from Riedel- De Haen AG, Made in Germany. NaOH 0.1N was from Carlo Erba, RPE, UN 1824, CHCl3 1L was from PENTA, stabilized with ~1% ethanol A.G. Mr. 119.38, barcode:8595142231112.
The commercial liquid detergent analyzed in this work was a general-purpose cleaner labeled as Servin Quality Ultra, 1Le, with cherry fragrance, with barcode:5203565996053. According to the manufacturer the formulation contained among others, less than 5% of non-ionic surfactants, phosphonic compounds, and also contained preservatives methylchloroisothiazolinone and methylisothiazolinone, fragrance additives, and alcohols, C13-15, branched and linear ethoxylated.
Apparatus
A pH-meter Metrohm 716 DMS Titrino, Swiss made, was used for the determination of pH. An analytical balance Mettler Toledo AB 204-S/FACT accurate to 0.1mg, maximum capacity 220g was used to weigh the detergent sample amounts for the analyses. An oven Memmert direkt, capable of being controlled at 103 °C ± 2 °C, was used for heating the soluble matter ethanolic of the detergent sample to constant mass. A Water bath FALC, 220/240V, 50Hz, was used for heating until evaporating off the ethanolic solution of the filtrate in the glass container. The FT-IR Spectrometer Perkin Elmer Inc Spectrum 2000 Version 5.0.2 Copyright 2004, was used for the acquisition of FT-IR-spectra. The Spectrophotometer CM-3630 BCMTS M Type 40605, S.N. 43029, Touch Screen-M V 2.0, Frank- PTI, was used for obtaining of the UV-Vis spectrum of the detergent product.
Quantum chemical calculations were performed using GAMESSUS software package. Molecular construction, visualization of optimized geometries, molecular orbitals and electron density surfaces were carried out using the Avogadro molecular editor and visualization package.
Ordinary laboratory apparatus
Beakers of capacity 250ml, glass funnel, conical flasks of capacity 250ml, ashless filter paper.
Determination of soluble –insoluble matter ethanolic 95%w/v
We weighed 20.4467g for the detergent sample Servin, in a 250ml beaker. We added 75ml ethanol 95%w/v and we heated on a water bath for 2 hours while stirring often with a glass rod. The glass beaker was covered with a watch glass all time. We then dried a filter paper to be used for the filtration of the insoluble matter, in the oven controlled at 103° ± 2 °C for 1hour. We allowed it to cool to ambient temperature in a desiccator for 20min and we weighed it to be, 0.9748. We placed it in a funnel mounted on a glass container on the water bath. When the dissolution of the detergent appeared to be complete, we decanted the supernatant liquid, on to the filter paper. After decantation we added 25ml of ethanol 95%w/v to the 250ml glass beaker and after heating it to near its boiling point, we transferred the insoluble matter to the filter paper with the aid of small quantities of the warm ethanol. The filter paper and the residue were washed with the warm ethanol until entirely free from detergent. We then dried the filter paper in air and we placed it in the oven at 103° ± 2 °C. After 1hour we removed the filter paper and we left it in the desiccator for 20min for it to cool, and we weighed it to be 0.9762g. Yield: 0.0014g, 0.01%w/w. The ethanolic solution of the filtrate in the glass container on the water bath was then heated. We evaporated off all of the ethanolic solution. We then heated the glass container with the soluble matter to constant mass in the oven controlled at 103° ± 2 °C. We finally cooled in a desiccator and we weighed the contents. Yield: 0.6095g, 3.0%w/w. Τhe percentage of yield for the insoluble matter ethanolic, for the detergent Servin, was calculated as [(mass of insoluble matter ethanolic in g)/(mass of detergent sample in g)]*100=[(0.0014g)/ (20.4467g)] *100 = 0.01%w/w. Also, the percentage of yield for soluble matter ethanolic for the detergent Servin was calculated as [(mass of soluble matter ethanolic in g)/(mass of detergent sample in g)]*100=[(0.6095g)/ (20.4467g)]*100=3.0%w/w.
Determination of the anionic –active matter content by manual direct two-phase titration procedure [13].
We weighed 15.1665g of the detergent product Servin into a 250ml beaker, an amount of laboratory sample which contained about 0.004mol of the anionic –active matter. We transferred quantitatively to a 500ml one-mark volumetric flask with ground glass stopper and we diluted to the mark with water. We mixed thoroughly and by means of a pipette we transferred 20ml of this solution to the measuring cylinder. We then added a few drops of the phenolphthalein solution and we neutralized to a faint pink colour with the sodium hydroxide solution 0.1M as required. We then added to the measuring cylinder solution 10ml of water, 15ml of chloroform and finally 10ml of the mixed indicator solution. We then tried to titrate against the benzethonium chloride solution. We stoppered the measuring cylinder before the addition of the hyamine 1622 0.004M and we shaked well. Then the lower chloroform layer was not coloured pink. We stopped the titration. The chloroform layer became a faint greyish blue color. Volume of benzethonium chloride solution used: 0.0ml. The anionic active matter content was calculated to be {[(volume V in ml of Hyamine 1622 0.004M)*0.004M*(348.49g/mol)*5]/ (mass of the detergent in 1L solution)}=[(0.0ml* 0.004M*348.49g/ mol*5)/(30.333g)]=0.0%w/w. Yield:0.0%w/w from 30.333g of detergent sample in 1Lt water deionized solution.
Results and Discussion
Determination of pH [EN ISO 1262/1996][14]
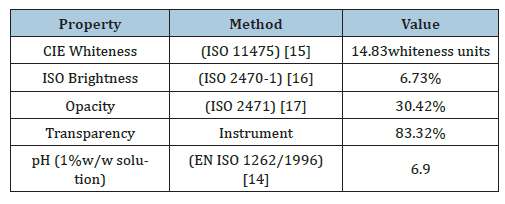
We measured the pH of the detergent solution Servin as it was to be pH 6.9 at 25.8 °C in the Metrohm 716 DMS Titrino pH-meter. We prepared a 1%w/w aqueous solution of the detergent solution Servin in deionized water and we measured pH=6.9 at a temperature of 25.9 °C in the Metrohm 716 DMS Titrino pH-meter. We then prepared a 10%w/w aqueous solution of the detergent solution Servin and we measured pH=6.9 at a temperature of 25.8 °C in the Metrohm 716 DMS Titrino pH-meter (Table 1). All solutions were measured immediately after preparation. The pH of all solutions was 6.9, measured using the calibrated pH meter, at room temperature. So, we observed pH stability across concentrations (1-10%), so the formulation was chemically stable. The absence of measurable pH variation across concentrations indicated significant formulation stability and suggested the presence of buffering components within the detergent system. Such near-neutral pH values were advantageous for household detergent applications because they minimized corrosive effects and improved skin compatibility while maintaining surfactant efficiency. Also, we observed no effect of concentration on acidity. The stability of pH also indicated that dilution did not significantly alter the ionic equilibrium or micellar organization of the formulation. That behavior was consistent with systems dominated by nonionic surfactants, whose physicochemical properties were less sensitive to concentration-dependent ionization effects than anionic surfactants.
Table 1:Optical and physicochemical properties of Servin quality ultra liquid detergent.
FT-IR analysis of ethanolic soluble fraction of the detergent Servin
The infrared spectra were recorded in the solid state, using a standard attenuated total reflectance (ATR) accessory [18]. The sample was analyzed in ATR mode/ transmission mode. FT-IR spectra were recorded over the range 4000-400cm-1. The characteristic absorption peaks were identified and assigned to functional groups associated with surfactants and inorganic components. Peak assignments were performed based on standard spectral references.
Figure 1:FT-IR spectrum of the ethanolic soluble fraction of Servin Quality Ultra detergent. The spectrum was dominated by aliphatic C-H stretching vibrations (2921cm-1 and 2844cm-1) and strong C-O-C bands (1148cm-1- 1037cm-1), confirming the presence of ethoxylated nonionic surfactants. A carbonyl band at ~1739cm-1 indicated minor ester-containing components, while the fingerprint region reflected the complex composition of surfactants, fragrances and inorganic additives.
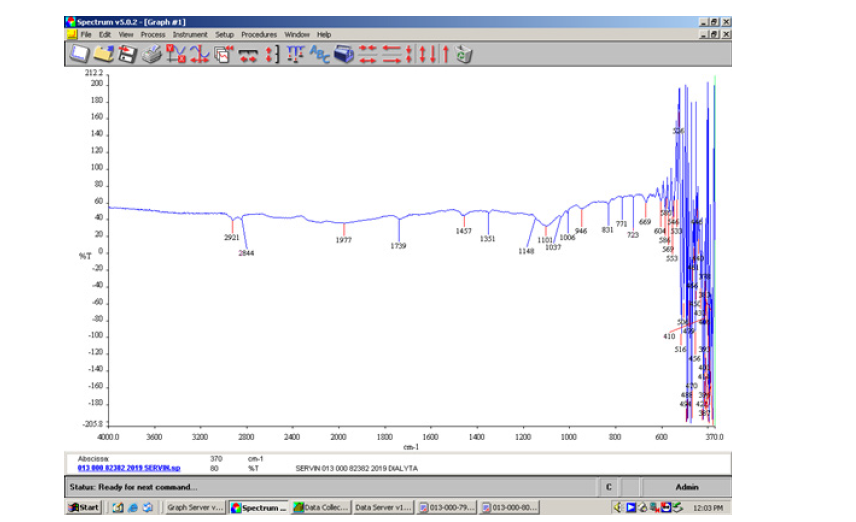
Table 2:FTIR Peak Assignment.
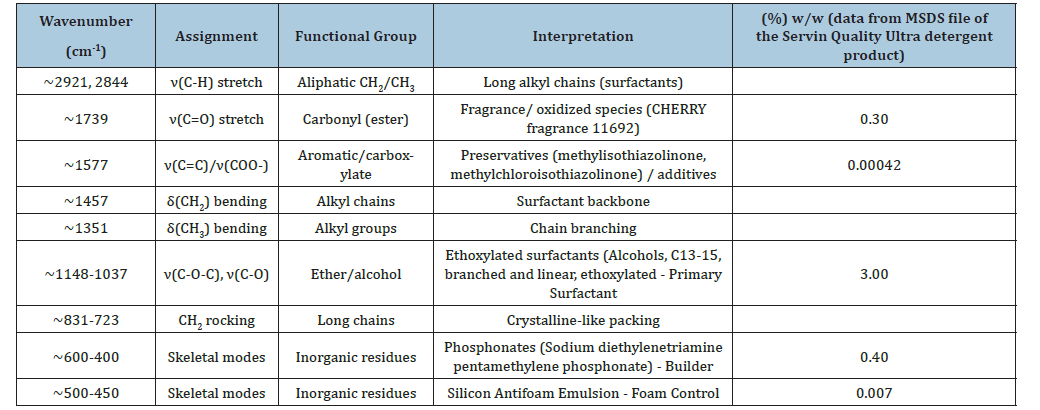
The FTIR spectrum of the ethanolic soluble fraction of the Servin detergent in Figure 1 & Table 2, revealed a complex mixture dominated by aliphatic and ethoxylated surfactant structures. From the FT-IR spectrum, of the ethanolic soluble fraction of the Servin detergent in Figure 1 & Table 2, in the high wavenumber region (3200-3600cm-1) there was a broad very weak peak which meant limited free O-H stretching vibrations [19]. That peak suggested that alcohols were present but they were not dominant and hydrogen bonding was suppressed. The low intensity of this band implied that hydroxyl-containing species were present but not dominant components of the soluble fraction. Also, the strong absorption bands observed at 2921cm-1 and at 2844cm-1 were indicating asymmetric and symmetric C-H stretching (sp3), of aliphatic CH2 and CH3 groups [19]. Those peaks suggested the presence of long alkyl chains, which could be attributed to non-ionic surfactants (C13-C15 alcohols), such as alcohol ethoxylate surfactants.
In the carbonyl and double bond region (1500-1800cm-1), (Figure 1 & Table 2) the peak at 1739cm-1 indicated strong C=O stretching, and suggested esters or oxidized surfactant fragments and possibly fragrance components. The peak at approximately 1577cm-1 which was weak, indicated aromatic C=C stretching, or carboxylate (COO-) asymmetric stretch, which suggested the presence of fragrance molecules, and also preservatives the isothiazolinones such as methylisothiazolinone and methylchloro-isothiazolinone.
In the CH2 /CH3 deformation region (1300-1500cm-1) (Figure 1 & Table 2) the peak at 1457cm-1 indicated CH2 bending from long hydrocarbon chains. The peak at 1351cm-1 indicated CH3 symmetric bending. These two peaks confirmed the presence of aliphatic surfactant backbone.
In the fingerprint region (1000-1300cm-1) (Figure 1 & Table 2) there were the peaks at 1148cm-1, at 1101cm-1 and at 1037cm-1 [6]. These strong peaks indicated the presence of C-O-C and C-O stretching vibrations [19] and suggested the presence of non-ionic surfactants and also the presence of polyether chains. These bands were characteristic of nonionic ethoxylated alcohols [20].
In the low wavenumber region (<1000cm-1) (Figure 1 & Table 2) there were the peaks at 831cm-1, at 771cm-1 and at 723cm-1, which indicated long-chain rocking modes (CH2) and also the presence of aromatic substitutions, possibly from the fragrance molecules. The low-wavenumber region (<1000cm-1) contained bands associated with CH2 rocking modes and skeletal vibrations of inorganic additives, including phosphonate and silicate species. Those observations agreed with the manufacturer’s reported composition, and confirmed the chemically heterogeneous nature of the detergent formulation (Table 2). In the very low region (~400-600cm-1) the peaks suggested the presence of phosphonates and inorganic mineral additives.
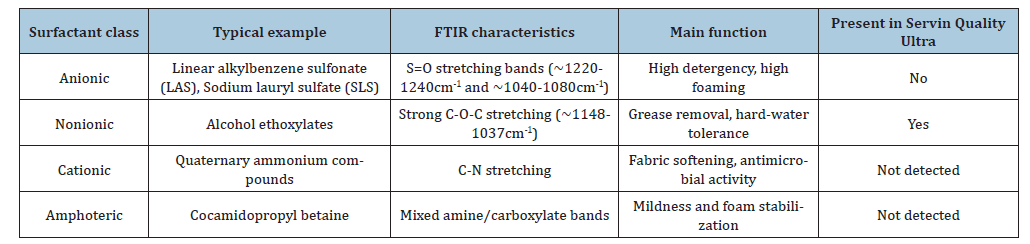
In addition to the FT-IR characterization of the nonionic surfactant system, the detergent formulation was examined for the presence of anionic-active surfactants using the standard twophase titration method. No measurable anionic-active matter was detected (0.0% w/w), indicating that the cleaning performance of the investigated formulation relied predominantly on nonionic alcohol ethoxylate surfactants. That observation was consistent with the manufacturer’s declaration (<5% nonionic surfactants) and the FT-IR spectrum, which exhibited strong C-O-C stretching bands characteristic of ethoxylated alcohols, while lacking the characteristic S=O stretching vibrations (approximately 1220-1240cm-1 and 1040-1080cm-1) associated with sulfate or sulfonate anionic surfactants (Table 3) [19].
So, the FT-IR results demonstrated that the detergent Servin consisted of saturated aliphatic nonionic surfactants (Table 2 & 3), with minor oxygenated additives, and inorganic builder components.
Table 3:Comparison of major detergent surfactant classes.
Calculation of Kubelka-Munk K/S values for the detergent products (absorption coefficient/ scattering coefficient ratio)
The K/S ratio for the detergent Servin was found K/ S=6.463070505 and the reflectance ISO brightness used was measured 6.73% (Table 1). The ISO brightness measured was the numerical value of the reflectance of the detergent at 457nm, blue light reflectance.
In this work the Kubelka-Munk theory [21] was used for predicting optical properties for the commercial detergent product. The appearance of the detergent product Servin was the result of its optical properties. As known the Kubelka-Munk theory was based on the assumption that the interaction between the diffuse light and the liquid detergent product could be described in terms of two fundamental optical constants. The specific scattering coefficient (S) and the specific absorption coefficient (K). Although the Kubelka-Munk theory strictly applied for homogeneous materials only, it worked also for detergent products containing more than one substances [22].
The equation of Kubelka-Munk used above was:

where K was the absorption or coefficient of reflectivity, and S was the coefficient of light scattering; R was the observed reflectivity for monochromatic light.
CIE L*a*b* values for the detergent product analyzed
The color of the detergent Servin Ultra in the CIE L*a*b* system for illuminant C/2 was L*=30.84, a*=+5.56 and b*=-0.53. L was the measure of lightness and varied from 100 for a perfect white to 0 for the absolute black. Here +a indicated the redness of the detergent and -b indicated its blueness. The color measured indicated the presence of a red-blue, rather than a white liquid detergent. The opacity calculated for the detergent Servin was 30.42% (Table 1), and the transparency was 83.32%.
Reflectance spectrum analysis
The Kubelka-Munk transformation was applied to the diffuse reflectance data to qualitatively evaluate optical transition behavior. The calculated K/S value of 6.46 reflected significant diffuse scattering contributions within the detergent system. Diffuse reflectance measurements were carried out in the 300-800nm wavelength range. Measurements were performed under different conditions, including standard configuration, with optical filtering, and over a black background to distinguish absorption and scattering contributions.
From the Reflectance spectrum in Figure 2, we could observe the X-axis, the wavelength, which was 300-800nm, and comprised the UV-Visible range. The Y-axis was the Reflectance R%. From the spectrum in Figure 2 we observed multiple curves, with filter, over black and others. From the reflectance spectrum of the analyzed liquid detergent (Figure 2), recorded in the 300-800nm range, we could observe that the reflectance was quite low in the UV region (300nm-400nm). That indicated strong absorption in the UV, which was typical for organic molecules, like surfactants with chromophores, and also additives, like preservatives and the fragrance compounds. That observation agreed with the detergent Servin composition, comprising non-ionic surfactants, and preservatives like isothiazolinones.
Figure 2:Diffuse Reflectance Spectrum of the liquid detergent Servin Ultra recorded in the 300-800nm range under different measurement conditions (standard, with optical filter and over black background). The spectrum showed low reflectance in the UV region and increasing reflectance in the visible range, indicating absorption by organic components and light scattering effects associated with micellar structures.
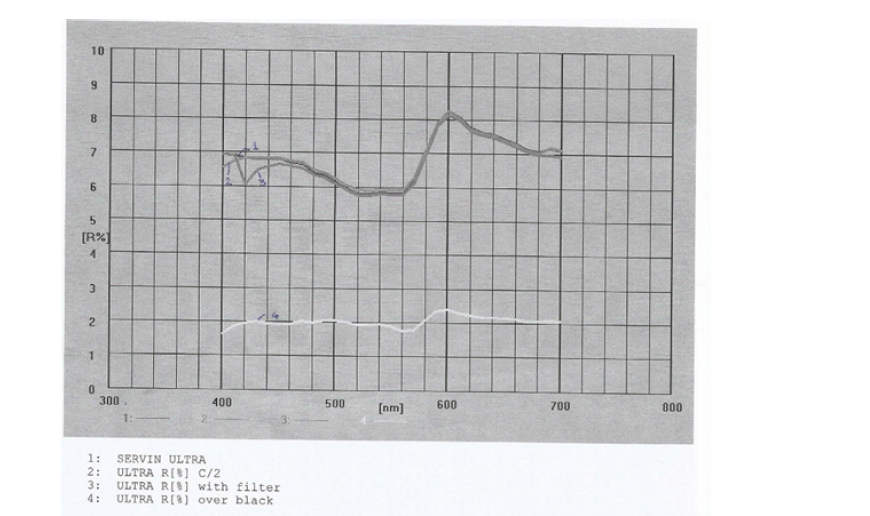
From Figure 2 we observed a gradual increase in reflectance in the visible region (400-700nm). A broad feature was visible around ~550-650nm. That gradual increase suggested a weak absorption in the visible and the liquid material appeared light-colored, transparent and slightly tinted. The peak and dip corresponded to color perception. The detergent Servin Ultra was labeled cherry aroma, and the slight absorption in the green region (~500-550nm) shifted color toward pink/red tones.
In Figure 2 we had multiple curves, i.e. “with filter”, “over black”. The over black background curve reduced the scattering contribution, and showed more “true absorption”. The “with filter” curve likely smoothed the spectral regions.
The differences between these curves indicated scattering versus absorption effects, and also the presence of turbidity, or micelles, which were common in detergents. These micelles scattered incident light, thereby influencing the reflectance profile [1,4].
The UV absorption confirmed π→π* or n→π* transitions which indicated the presence of chromophores from fragrance molecules, and preservatives like the isothiazolinones [19]. The relatively high and smooth reflectance in Figure 2 indicated light scattering from micelles and suspended particles. The comparison “over black” versus normal curve helped us distinguish the surface reflection from internal absorption. The Reflectance curve in Figure 2, while not as precise as the FT-IR in Figure 1, gave us a qualitative composition insight, confirmed the presence of organic nature, and suggested the absence of strong visible chromophores. Thus, the detergent Servin Ultra did not have intense color.
We could conclude that the reflectance spectrum in Figure 2 showed low reflectance in the UV region, indicating strong absorption by organic components of the detergent Servin. This behavior was typical of a colloidal system such as liquid detergents, where micellar structures and suspended components contributed to diffuse reflectance [23].
Quantitatively, in the visible region (400-700nm), the reflectance increased to values of approximately 5-8%, indicating reduced absorption and increased contribution from diffuse scattering (Figure 2). A local maximum observed around 580-620nm suggested weak interaction with visible light, which may have been attributed to trace chromophoric additives. The relatively smooth profile of the spectrum in Figure 2 further supported the absence of highly conjugated systems, which would otherwise produce sharp absorption features.
The diffuse reflectance spectrum (Figure 2) showed no sharp absorption edge which confirmed the absence of band structure. Also, showed broad transition region which indicated distribution of molecular energy levels. Thus, unlike semiconductors, the system of the detergent Servin did not exhibit a true band structure, but instead it showed a statistical ensemble of HOMO-LUMO gaps.
The findings from the reflectance spectrum in Figure 2 were in good agreement with the FTIR analysis, which revealed characteristic bands corresponding to O-H stretching (~3330cm-1), C-H bending (~1426-1367cm-1), and C-O stretching vibrations, confirming the presence of alcohols, non-ionic surfactants and other oxygen-containing functional groups. The absence of strong visible absorption bands in the visible region of the reflectance spectrum of Figure 2, further supported the FTIR results of Figure 1, indicating that no highly conjugated or strongly colored chromophores were present in significant amounts.
Kubelka-Munk Transformation
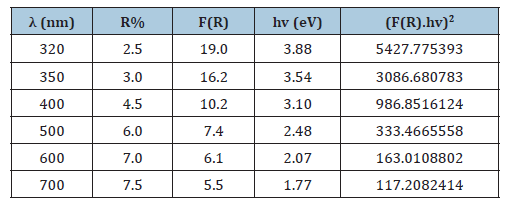
A Kubelka-Munk transformation was applied to the reflectance data to evaluate apparent optical transitions. The transformed function F(R) exhibited higher values in the ultraviolet region, indicating stronger absorption at higher photon energies. A Tauc-type representation was constructed by plotting (F(R).hv)2 as a function of photon energy [9] (Table 4). However no distinct linear region or absorption edge was observed which confirmed the absence of a well-defined band gap. A rough extrapolation suggested an apparent transition energy of approximately 3.0-4.0eV, which corresponded to molecular electronic transitions (π→π* and n→π*). That result confirmed that the optical behavior of the system was governed by discrete molecular orbitals rather than a continuous electronic band structure.
Table 4:Data extracted from Figure 2.
Diffuse reflectance data were converted using:
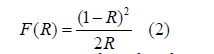
That function was proportional to the absorption coefficient (α).
The Tauc relation was used to determine the optical band gap (Eg) [24] of the material from how it absorbed light. The main idea was to find how much energy did light need to excite electrons in the material. The Tauc equation was:

where α meant how strongly the material absorbed light, hv (photon energy) meant the energy of the incoming light, Eg meant the minimum energy needed to excite electrons, Α was a constant, and n depended on the type of electronic transition. When the light energy (hv) was lower than Eg then the material did not absorb light and electrons stayed in place. When hv=Eg then the absorption started and electrons began to jump to higher energy states. When hv>Eg then the absorption increased rapidly.
From Figures 3a, 3b, 3c and Table 4, we extrapolated the “pseudo- linear” UV region, and the intercept was approximately ~3.0- 4.0eV. The Tauc Plot was constructed for the indirect allowed transitions, n=2 case. The energy range of 3.0-4.0eV corresponded to the energy range of molecular electronic transitions (π→π* and n→π*). The intercept of the Tauc plot meant that our system needed ~3.1eV of energy to excite electrons and that corresponded to UV light, not visible.
Figure 3a:Approximate Tauc Plot (Exploratory), for indirect allowed transitions, n=2 (Table 3).
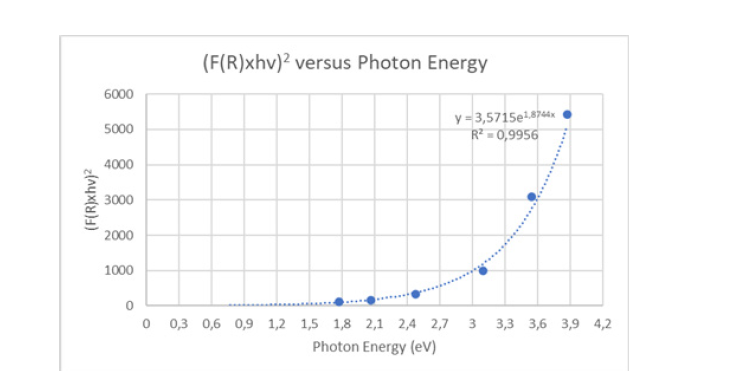
Figure 3b:Approximate Tauc Plot (Exploratory), for indirect allowed transitions, n=2 (Table 4).
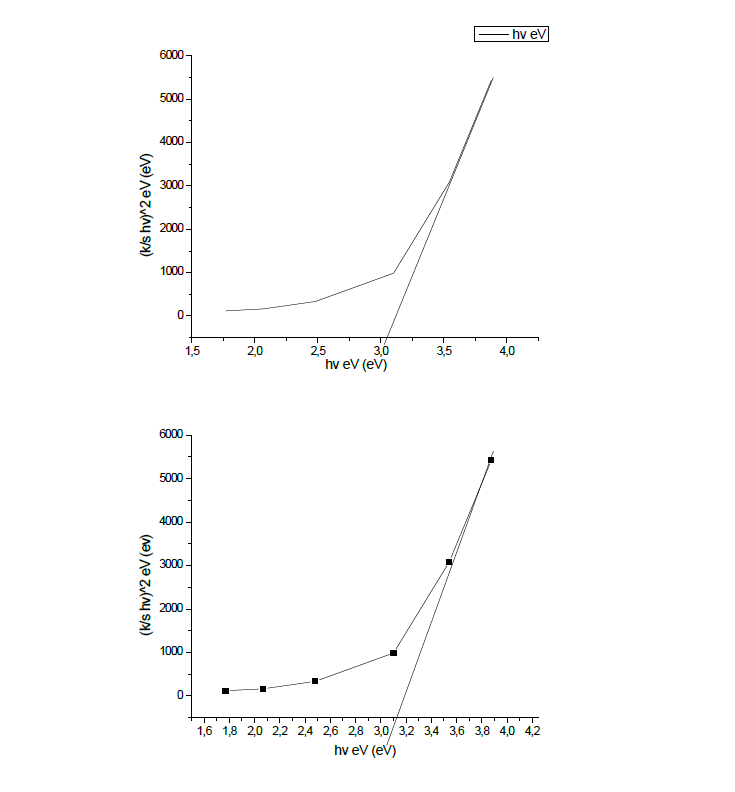
Figure 3c:Approximate Tauc Plot (Exploratory), for indirect allowed transitions, n=2 (Table 4).
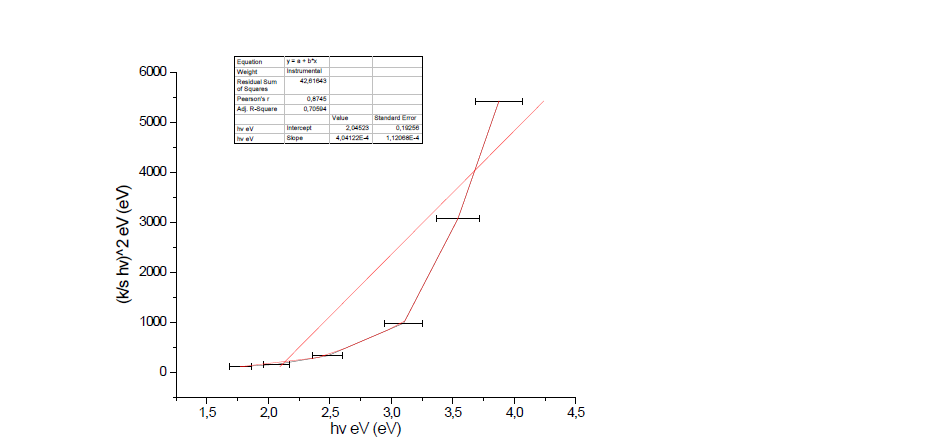
Using the Tauc relation (2), (Table 4), where n=2 the band gap was ~3.12eV. That relatively large band gap indicated an insulating behavior. The electronic transitions were localized molecular orbitals, which were typical of organic molecules, surfactant system, and amorphous mixture.
The “band gap” in that system corresponded to the HOMO-LUMO gap of molecular species. It was not a true semiconductor band structure. Thus:
Eg~ELUMO-EHOMO (4)
The detergent product behaved as an optically inactive, insulating organic mixture. Based on the detergent composition the HOMO was primarily localized on oxygen lone pairs (-OH, -O-), and possibly aromatic or conjugated fragments (fragrance, preservatives). The LUMO was localized on antibonding orbitals of C-O, and C=O present in preservatives, and weak π* systems. That resulted in localized electronic transitions, consistent with weak visible absorption, and strong UV-region transitions.
The Tauc plot constructed for the indirect allowed transition, case n=2, (Table 4) provided insight into the optical behavior of the investigated detergent/surfactant system. The plot did not exhibit a sharp absorption edge or a well-defined extended linear region, confirming the absence of a crystalline semiconductor-like electronic structure. Instead, a pseudo-linear region appeared in the ultraviolet energy range, from which an approximate optical transition energy of ~3.0-4.0eV (centered near 3.12eV) was estimated. That behavior was consistent with the diffuse reflectance results, which showed stronger absorption only in the UV region and very weak interaction with visible light. The relatively large apparent band gap supported the insulating nature of the material and indicated that the observed transitions originated from localized molecular orbitals. Therefore, the optical transitions were attributed mainly to π→π* and n→π* excitations associated with oxygen-containing functional groups and weakly conjugated molecular fragments of the nonionic surfactant system. The absence of a true band edge, together with the broad and diffuse character of the Tauc representation, suggested that the studied material behaved as an amorphous organic mixture dominated by HOMO-LUMO molecular transitions.
The liquid detergent Servin showed scattering-dominated reflectance. The Kubelka-Munk theory assumed that the diffuse reflectance was equal to absorption and scattering (controlled system). In our detergent we had scattering from micelles, which was dominant. So, F(R) was not true absorption and no band gap existed. The Tauc analysis for n=2 case was used only as an exploratory tool to support the interpretation of UV absorption behavior and did not represent a physically meaningful band gap. But for organic, detergent systems we should better had assumed the direct allowed transition, n=1/2 (Table 5).
Table 5:Data extracted from Figure 2.
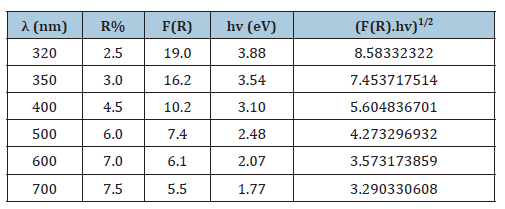
The three graphs presented as Figure 4a-4c (Table 5), corresponded to approximate Tauc plots for direct allowed electronic transitions (n=1/2). These plots were important because they provided information about the optical absorption behavior and the estimated optical band gap of the investigated material [25]. The estimated band gap from Figure 4b was Eg~2.1-2.3eV. That band gap indicated the presence of organic chromophores which were typical for conjugated π-systems and fragrance molecules. That band gap indicated also visible-light absorption and explained the colored appearance of the detergent. Also, indicated that the transition was broad and typical of molecular systems, and not crystalline solids. Thus, the value of that band gap, was consistent with the presence of organic chromophores exhibiting π→π* electronic transitions within the visible region.
Figure 4a:
Figure 4:The result of calculation (a) and the dependence of detonation velocity on decomposition temperature (b).
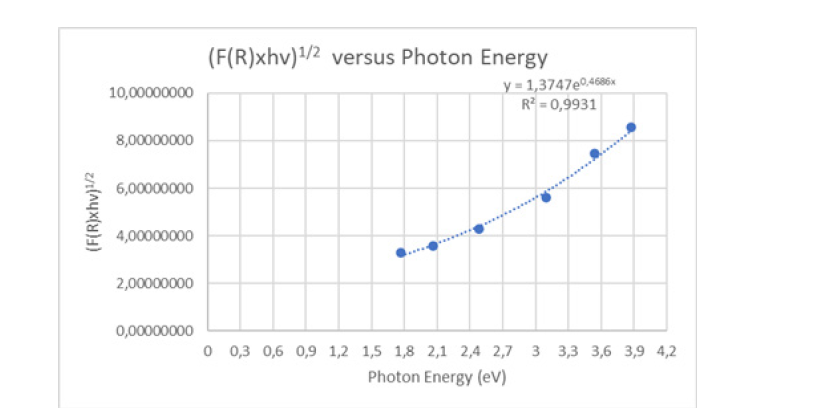
Figure 4b:Approximate Tauc Plot (Exploratory), for direct allowed transitions, n=1/2 case.
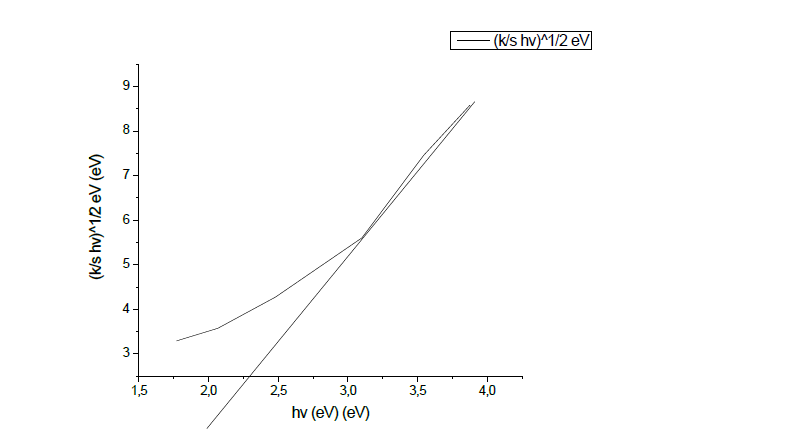
Figure 4c:Approximate Tauc Plot (Exploratory), for direct allowed transitions, n=1/2 case.
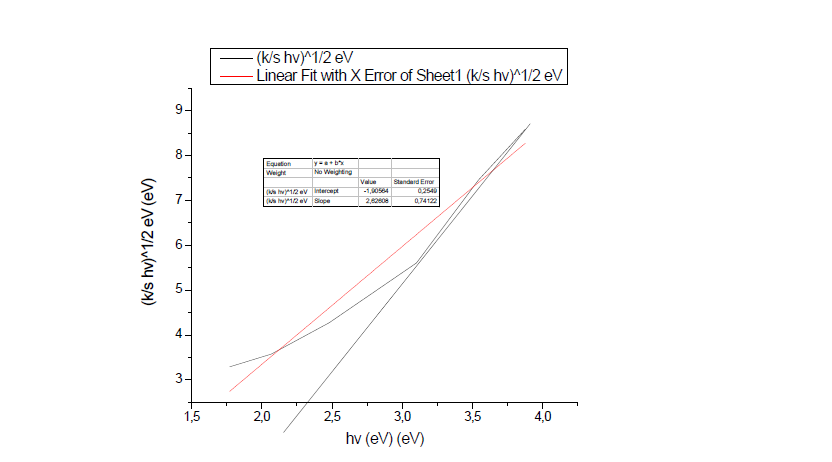
For all three graphs, (Table 4) the quantity (F (R)hv)1/2 increased with increasing photon energy, indicating that the electronic excitation process became more favorable at higher energies. That behavior was characteristic of semiconducting [26] or molecular systems that exhibited photon-induced electronic transitions from occupied to unoccupied molecular orbitals. The gradual increase observed in the plots suggested the existence of an absorption edge associated with the onset of optical excitation. In Figure 4a, the exponential fitting trend showed a strong correlation coefficient (R2=0.9931), demonstrating that the experimental data followed a highly consistent optical transition trend. The increase in the intensity of (F (R)hv)1/2 at higher photon energies indicated stronger electronic absorption and enhanced transition probability (Table 5). The approximately linear region observed in the Tauc representation was significant because it could be extrapolated toward the photon energy axis to estimate the optical band gap energy (Eg). The presence of a defined absorption edge suggested that the studied system possessed semiconducting optical characteristics rather than purely metallic behavior. Such optical responses could be connected with HOMO-LUMO transitions and electronic delocalization within the molecular framework. Comparison between Figures 4a- 4c likely reflected variations in optical response due to differences in molecular configuration, structural optimization, concentration or experimental conditions. Any shift of the absorption edge toward lower photon energies would have indicated a reduction in the optical band gap (red shift), while displacement toward higher energies would have corresponded to a widening of the band gap (blue shift). Those differences may have arose from changes in conjugation length, intermolecular interactions, or modifications in the electronic structure of the surfactant system. The Tauc plot analysis confirmed that the investigated systems exhibited direct allowed optical transitions and measurable semiconducting behavior. But this Tauc-type analysis should not be interpreted as evidence of true semiconductor behavior. The detergent represented a heterogeneous colloidal molecular system dominated by localized molecular orbitals and micellar scattering effects. The estimated optical transition energies corresponded more appropriately to apparent HOMO-LUMO excitation energies associated with organic chromophores and oxygen-containing functional groups.
Structure-Optical property relationship
It should be mentioned that the FTIR results provided critical insight into the optical behavior observed in the reflectance spectra and Tauc plot analysis. The absence of extended π-conjugated systems in the FTIR spectrum indicated that the molecular structure was primarily composed of saturated aliphatic chains and ether linkages. As a result, the electronic transitions were dominated by σ→σ* and n→σ* excitations rather than π→π* transitions. That explained the wide optical band gap and the low absorption in the visible region, and UV absorption origin (~280-380nm).
The carbonyl groups contributed weak n→π* transitions, while the ether oxygen atoms introduced localized lone-pair electronic states. However, these did not form delocalized electronic systems, leading to insulating optical behavior.
The combined spectroscopic and optical data indicated that the observed behavior was governed by the interplay between molecular electronic transitions and colloidal structure. The amphiphilic nature of surfactants led to micelle formation, which in turn influenced light scattering and transmission properties. The high transparency and low reflectance suggested that the micellar dimensions were below the wavelength of visible light, minimizing scattering and allowing efficient light transmission.
Optical and colorimetric properties
The optical and colorimetric properties [10] of the liquid detergent Servin Ultra were further evaluated using CIE tristimulus values, representing reflected light components and related parameters. The CIE tristimulus values represented reflected light components. The measured reflectance values (Rx=7.26, Ry=6.59, Rz=6.73) were relatively close, indicating a uniform spectral response across the visible region and confirming the absence of dominant color components. That observation was consistent with the reflectance spectrum, which showed no strong absorption bands in the visible range [27].
Table 6:Optical data for the detergent Servin.
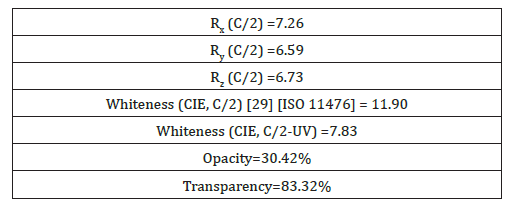
The CIE whiteness index was found to be 11.90 (Table 6) under standard conditions and decreased to 7.83 under UV-excluded conditions. That reduction suggested a minimal contribution from fluorescent whitening agents, which were commonly used in detergent formulations to enhance visual brightness.
The opacity of the sample was measured at 30.42%, (Table 1) while the transparency reached 83.32% (Table 5), indicating that the detergent exhibits semi-transparent behavior. That combination of moderate opacity and high transparency was characteristic of colloidal systems. These findings were in strong agreement with the diffuse reflectance results, further supporting the presence of organized surfactant assemblies that influenced the optical properties of the system [28,29]. Transparency and opacity were measured using different instrumental modes; thus, they were not strictly complementary but indicated combined transmission and scattering effects. Light scattering arose from refractive index differences between micellar aggregates and the surrounding medium.
Electronic structure interpretation of optical transitions
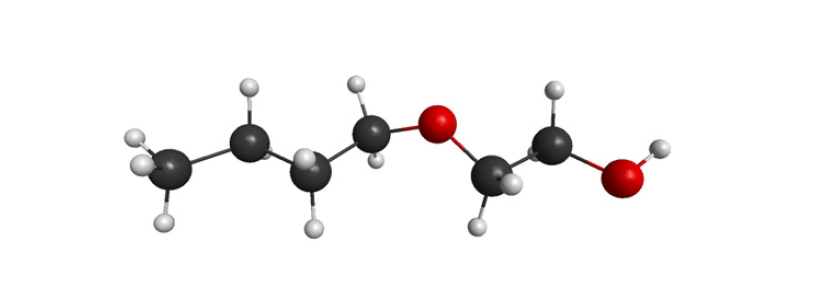
We had tried to perform TD-DFT calculations on a representative molecule, such as the C13-C15 alcohol ethoxylates present in the detergent Servin. We did not simulate the whole detergent. We have used a representative molecule, i.e. an ethoxylated alcohol fragment, a simple surfactant model, CH3-(CH2)3-O-CH2-CH2-OH (Figure 5). We have used a small molecule, which was chemically realistic and contained O atoms (for n→π*), O lone pairs and possibly σ→σ* weak transitions [30]. We modeled an alcohol ethoxylate fragment which contained an alkyl chain (hydrophobic), an ether group and an alcohol group (Figure 5a, 5b).
Figure 5a:We have used Avogadro to build the non-ionic surfactant molecule C6 H14 O2.
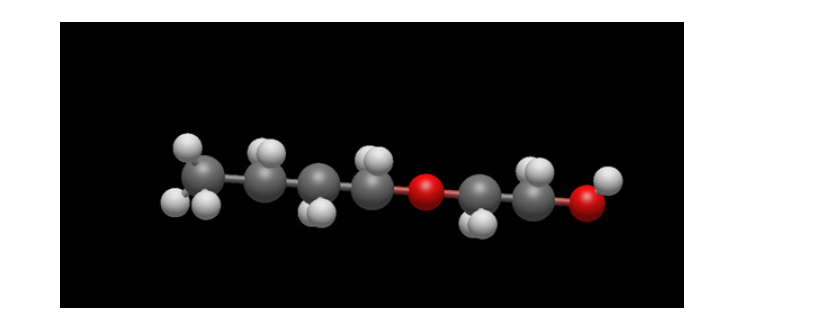
Figure 5b:We have used Avogadro to build the non-ionic surfactant molecule C6 H14 O2.
Energy decomposition analysis
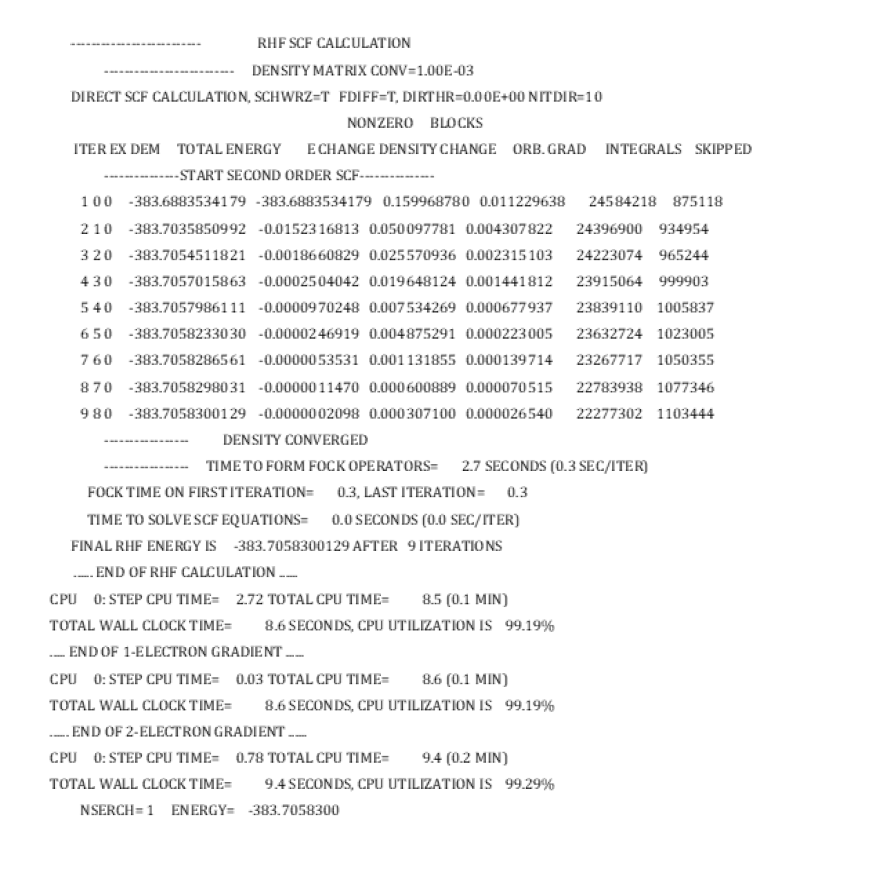
From the GAMESS output file we had the final RHF (Restricted Hartree-Fock) Energy to be -383.7058300129 Hartree (Figure 6). That was the optimized ground-state energy. That confirmed the electronic stability of the optimized geometry. The optimized structure of C6 H14 O2 exhibited a total electronic energy of -383.71 Hartree at the RHF level, indicating a stable ground-state configuration
Figure 6:A part of the GAMESS output file.
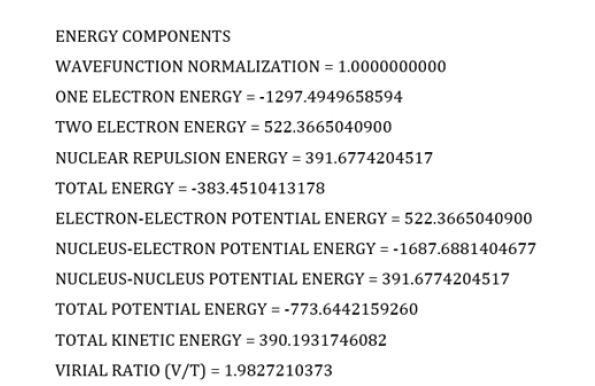
In Figure 6 we had the total electronic energy of the C6 H14 O2 surfactant molecule which was analyzed through its individual energy components and was obtained from the RHF calculation. The one-electron energy term (-1297.49 Hartree) in Figure 7, represented the combined kinetic energy of the electrons and their attractive interactions with the nuclei, constituting the dominant stabilizing contribution to the system. In contrast, in Figure 7, the two-electron energy term (+522.37 Hartree) accounted for electron- electron repulsion, which acted as a destabilizing factor due to Coulombic interactions between electrons. The nuclear repulsion energy (+391.68 Hartree) (Figure 7) arose from repulsive interactions between positively charged nuclei and was inherently positive, reflecting the geometric arrangement of atoms in the molecule. The kinetic energy component (+390.19 Hartree) in Figure 7, further reflected the motion of electrons within the molecular orbitals and contributed to the overall energy balance of the system. The final total energy (-383.71 Hartree) (Figure 6) resulted from the delicate balance between these stabilizing and destabilizing contributions, confirming the physical consistency and convergence of the electronic structure calculation (Figure 6). The decomposition analysis provided insight into the internal energetic structure of the molecule, and supported the stability of the optimized configuration. The balance between attractive (electron-nucleus) and repulsive (electron-electron and nuclear) contributions demonstrated proper convergence of the electronic structure calculation.
Figure 7:A part of the GAMESS output file.
Geometry (X, Y, Z Coordinates) and interatomic distance analysis
In Figure 8 we had the initial geometry of the C6 H14 O2 surfactant.
The optimized molecular geometry of the C6 H14 O2 surfactant, derived from the X, Y, Z, Cartesian coordinates (Figures 8-10) obtained at the RHF/6-31G level, revealed an extended, predominantly linear conformation of the carbon backbone with localized deviations around the oxygen-containing functional groups. Analysis of the internuclear distances showed that the C-C bond lengths were consistently around 1.52-1.54Å, in agreement with literature values for saturated alkanes (~1.54Å). The C-O bond lengths were found in the range of 1.33-1.36Å, slightly shorter than typical single C-O bonds (~1.43Å), indicating enhanced bond polarization due to the electronegativity of oxygen. The O-H bond lengths were approximately 0.96-0.98Å, consistent with expected values for hydroxyl groups (Figure 9,10). The molecular geometry did not exhibit intramolecular hydrogen bonding due to the spatial separation of the oxygen atoms and the lack of favorable geometric alignment. However, the presence of polar O atoms strongly suggested the potential for intermolecular hydrogen bonding in aqueous environments. That structural arrangement supported the amphiphilic nature of the molecule, with a nonpolar hydrocarbon chain, and polar functional sites. Overall, the close agreement between calculated bond lengths and established literature values validated the reliability of the computational method and confirmed that the optimized structure accurately represented a physically meaningful minimum on the potential energy surface [31]. The optimized geometry showed typical aliphatic bond distances, confirming the saturated hydrocarbon backbone and polar hydroxyl functional groups characteristic of nonionic surfactants.
Figure 8:A part of the GAMESS output with the initial geometry (input coordinates).
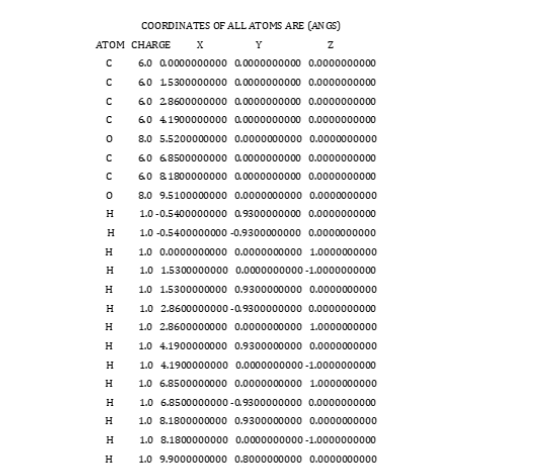
Figure 9:Optimized molecular geometry of the surfactant.
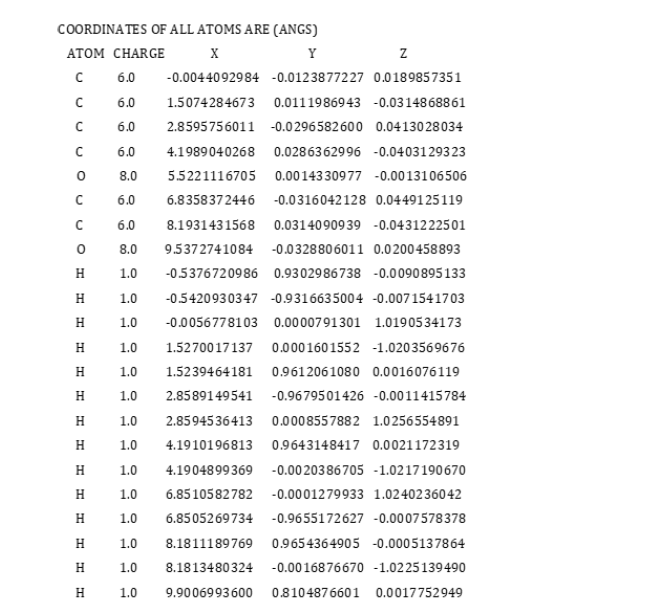
Figure 10:Optimized Geometry, in the last occurrence in the GAMESS output (surfactant 1).
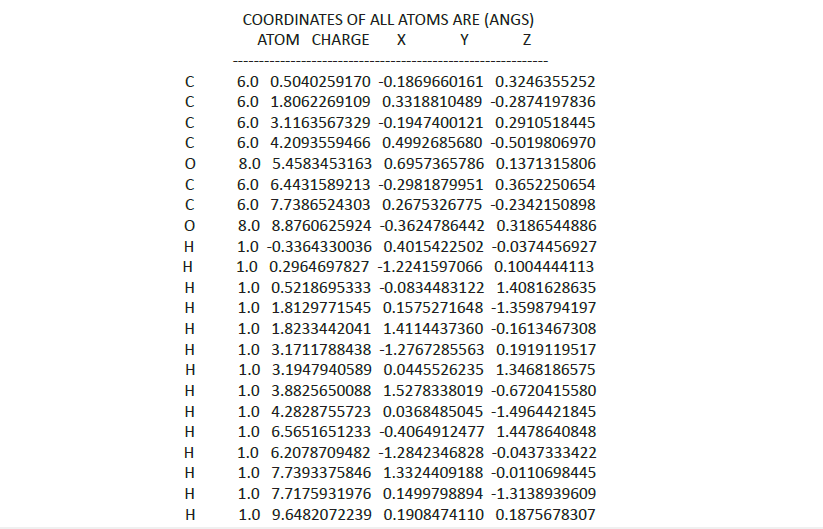
The bond lengths were computed using the distance formula:

Using the data from Figure 10, the final optimized geometry, the C-O bond length was calculated from the C (4th carbon) and the O (next atom).
C: (4.2093559466, 0.4992685680 -0.5019806970
O (next atom)
O: (5.4583453163, 0.6957365786, 0.1371315806)
The differences were:
Δx=5.4583453163-4.2093559466=1.2489893697
Δy=0.6957365786-0.4992685680=0.1964680106
Δz=0.1371315806-(-0.5019806970)=0.6391122776
The squares were:
Δx2=1.55997, Δy2=0.03860, Δz2=0.40846, and the sum was:
d2=1.55997+0.03860+0.40846=2.00703. The final distance
was  . That meant that the C-O bond length
was 1.42Å. That value matched the single C-O bond length which
was ~1.43Å. The C-O bond length in our molecule was slightly
shortened due to its environment.
. That meant that the C-O bond length
was 1.42Å. That value matched the single C-O bond length which
was ~1.43Å. The C-O bond length in our molecule was slightly
shortened due to its environment.
For the calculation of the O-H bond length, from Figure 10, we used the O (4th oxygen) and the attached H the last one in Figure 10.
O: (8.8760625924, -0.3624786442, 0.3186544886)
H: (9.6482072239, 0.1908474110, 0.1875678307)
The differences were:
Δx=9.6482072239-8.8760625924=0.7721446315
Δy=0.1908474110-(-0.3624786442)=0.5533260552
Δz=0.1875678307-0.3186544886=-0.1310866579, and the
squares were:
Δx2=0.59621, Δy2=0.30617, Δz2=0.01718, and the sum
was d2=0.59621+0.30617+0.01718=0.91956. And finally
 , which was the O-H bond length ~0.96Å,
exactly what was expected for the hydroxyl group.
, which was the O-H bond length ~0.96Å,
exactly what was expected for the hydroxyl group.
For the calculation of the C-C bond length, from Figure 10, we
used the first two carbon atoms.
C1: (0.5040, -0.1869, 0.3246)
C2: (1.8062, 0.3319, -0.2874)
The differences were
Δx=1.3022, Δy=0.5188, Δz=-0.6120, and the squares were
1.6957+0.2692+0.3746=2.3395, and finally 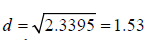 Å. The C-C bond length was calculated to be ~1.53Å, which was typical
of a single bond.
Å. The C-C bond length was calculated to be ~1.53Å, which was typical
of a single bond.
Bond lengths were analytically calculated using the Cartesian coordinates obtained from the GAMESS output [12]. The interatomic distances were evaluated using the Euclidean distance formula. For instance, the calculated C-O bond length in the optimized geometry was found to be 1.42Å, while the O-H bond length was 0.96Å (Table 7 & 8). Those values were in agreement with typical literature values, confirming the reliability of the optimized structure.
Table 7:Bond distances for the backbone of the molecule and functional bonds.
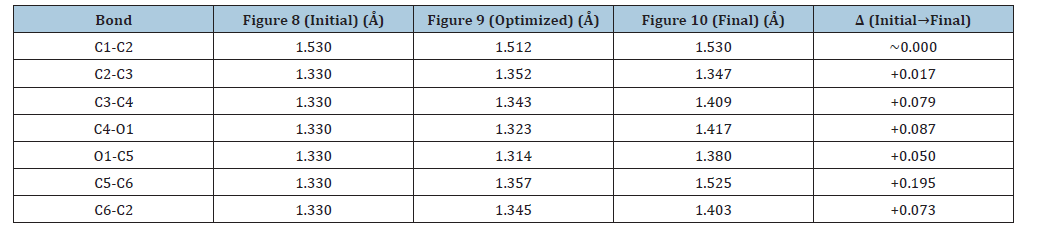
Table 8:O-H bonds.

The values of Table 9 were calculated using the formula:

where each H atom was assigned to its nearest C atom.
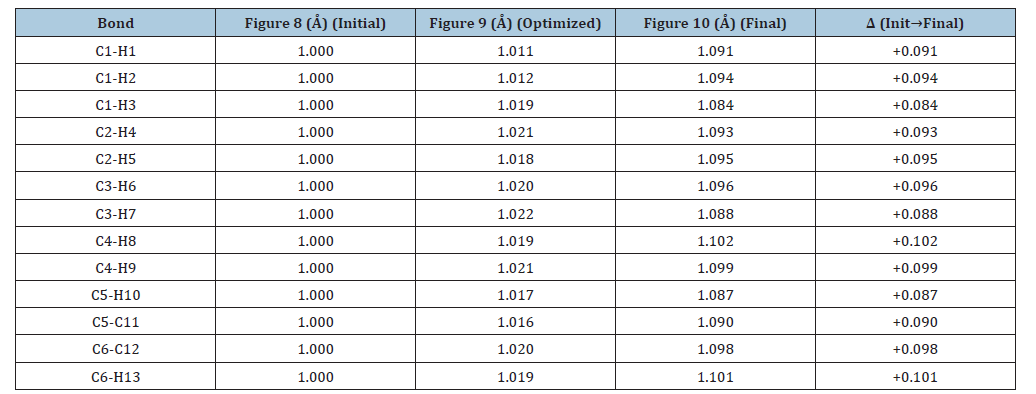
In Table 9, a complete analysis of all C-H bond lengths was performed using Cartesian coordinates extracted from the GAMESS output. In the initial geometry, all C-H bonds were fixed at 1.000Å, reflecting the artificial input structure. Upon optimization, bond lengths increased to 1.011-1.022Å, indicating the onset of electronic relaxation. In the final optimized geometry, C-H distances ranged from 1.084-1.102Å, in agreement with typical sp3C-H bond lengths. The observed increase and dispersion in bond lengths demonstrated the transition from an idealized to a physically realistic structure, with subtle variations, reflecting local chemical environments within the surfactant molecule. The optimized geometry showed typical aliphatic bond distances, confirming the saturated hydrocarbon backbone and polar hydroxyl functional groups characteristic of non-ionic surfactants.
Table 9:Representative C-H bonds.
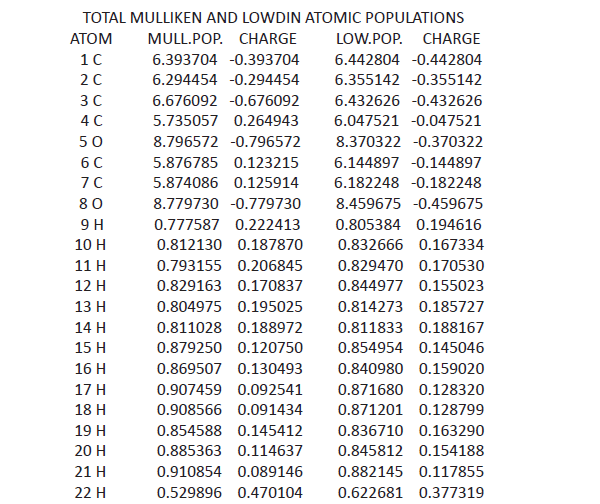
Mulliken & Löwdin charges
The total Mulliken and Löwdin population analyses in Figure 11, revealed a pronounced charge separation within the molecule, with oxygen atoms carrying significant negative partial charges, while hydrogen atoms exhibited positive character [32,33]. The carbon backbone remained largely neutral, indicating a non-polar hydrophobic region. This distribution confirmed the amphiphilic nature of the molecule, where polar oxygen sites acted as hydrophilic centers, facilitating intermolecular interactions such as hydrogen bonding and solvation in aqueous environments.
Figure 11:Total Mulliken and Löwdin Atomic Populations in the GAMESS output (surfactant 2).
From the Table in Figure 12, we had from the AO populations
Mulliken, that core 1s orbital S=1.99763 which meant ~2 electrons.
Then the valence orbitals S: 0.65195, 0.60037 and the p orbitals,
px=0.58296, 0.18934, py=0.71700, 0.41063, and pz=0.77096,
0.41094. The s total was 0.65195+0.60037=1.25232. And for the
p total we had p total: (0.58296+0.18934)+(0.71700+0.41063)+(
0.77096+0.41094)=3.08183. Then the ratio was  . That
was very close to 3:1, which was what we expected for, that was sp3
hybridization. The atom carbon used ~25% s character, and ~75%
p character [34]. That matched tetrahedral bonding (sp3), and confirmed
that the surfactant molecule in the detergent was saturated,
alkyl-like in those regions. Then we analyzed O5, and the Mulliken
values from Figure 12, were for S orbitals: 0.80744, 1.01502. Then
for p orbitals (Figure 12) we had:
. That
was very close to 3:1, which was what we expected for, that was sp3
hybridization. The atom carbon used ~25% s character, and ~75%
p character [34]. That matched tetrahedral bonding (sp3), and confirmed
that the surfactant molecule in the detergent was saturated,
alkyl-like in those regions. Then we analyzed O5, and the Mulliken
values from Figure 12, were for S orbitals: 0.80744, 1.01502. Then
for p orbitals (Figure 12) we had:
Figure 12:The Mulliken population analysis per atomic orbital in the GAMESS output (surfactant 2).

px=0.73618+0.41327=1.14945
py=1.16933+0.73552=1.90485
pz=1.16157+0.73005=1.89162
The s total was 0.80744+1.01502=1.82246. The p total was 1.1
4945+1.90485+1.89162=4.94592. Then the ratio was  . Those results meant that oxygen had a very strong p-character,
especially in py=1.16933, and pz=1.16157, which corresponded to
lone pairs and directional bonding. Those results proved that the
oxygen electron density was anisotropic, and that the lone pairs
were strongly localized in p orbitals, and further explained its high
electronegativity, its hydrogen bonding ability, and reactivity sites.
Then in the table in Figure 12 we had for carbon C1:
. Those results meant that oxygen had a very strong p-character,
especially in py=1.16933, and pz=1.16157, which corresponded to
lone pairs and directional bonding. Those results proved that the
oxygen electron density was anisotropic, and that the lone pairs
were strongly localized in p orbitals, and further explained its high
electronegativity, its hydrogen bonding ability, and reactivity sites.
Then in the table in Figure 12 we had for carbon C1:
XX=0.02386
YY=0.01107
ZZ=0.02080,
and for oxygen O5:
XX=0.00246
YY=0.00654
ZZ=0.01077
Those values, although very small, they were non-zero, which meant that the polarization functions were active, and that the orbitals were distorted for bonding accuracy. That conclusion was important for geometry optimization, and intermolecular interactions.
Then for the hydrogen atoms, for hydrogen 9 we had from Figure 12:
H9 S=0.51094, 0.26665,
which showed that only s orbitals were present, and that we had no p contribution. That conclusion confirmed that hydrogen formed σ bonds only. For carbon C1, from Figure 12, we had:
Orbital Mulliken Löwdin
S 0.65195 0.35281
Px 0.58296 0.52686
For C1 we could conclude that Mulliken values can overestimate overlap, but the Löwdin values were more orthogonalized. Both pairs of values showed the same hybridization. So, using the AO population data we had the following results, that carbon atoms exhibited p/s~2.5→sp3 hybridization, which was consistent with the saturated framework of the surfactant molecule. The oxygen atoms showed strong p-orbital dominance (p/s~2.7), and significant lone-pair localization. The hydrogen atoms were purely s-type bonding and showed small d contributions which confirmed basis set polarization effects.
The Mulliken population analysis per atomic orbital in Figure 12, indicated that carbon atoms exhibited typical sp3 hybridization, with electron density distributed between s and p orbitals. In contrast, oxygen atoms showed a higher contribution from p orbitals, reflecting their role in polar bonding and electron localization. This orbital distribution was consistent with the formation of σ bonds throughout the surfactant molecule and the presence of localized lone pairs on oxygen atoms.
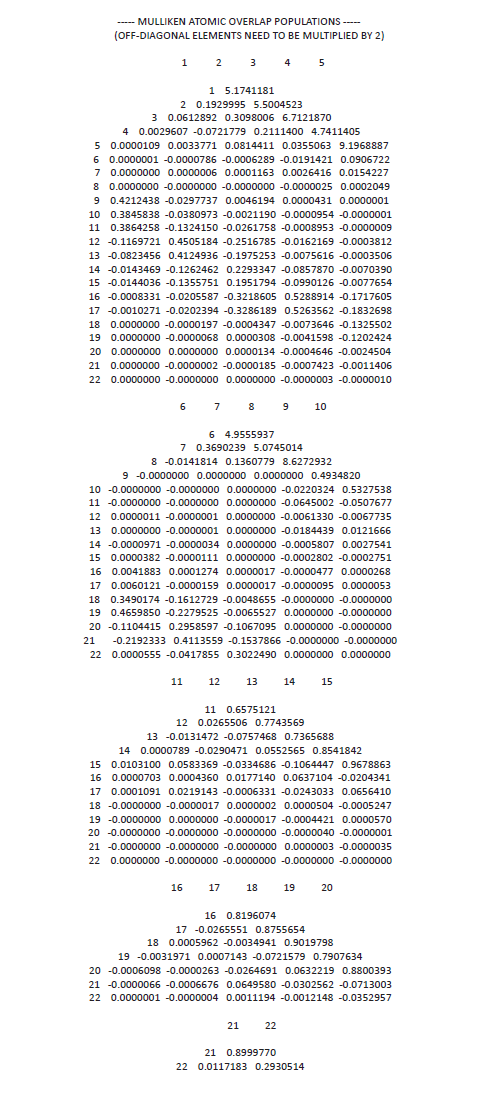
The table in Figure 13 measured bond strength and showed how much orbitals overlapped between atoms. In the GAMESS output the Mulliken Atomic Overlap Population (AOP) matrix described how electron density was shared between atoms. The diagonal elements (i=j) showed the electron population localized on atom i. The off-diagonal elements (i≠j) showed the overlap population i.e. the bonding interaction between atoms i and j. From Figure 13 we had extracted the data,
Atom 1→5.174
Atom 2→5.500
Atom 3→6.712
Atom 5→9.197
Atom 8→8.627
From those data the diagonal elements of the Mulliken overlap matrix revealed the electron population localized on each atomic center. For example, atom 5 (9.197e-) and atom 8 (8.627e-) exhibited significantly higher electron density compared to atoms such as atom 1 (5.174e-). That indicated the presence of more electronegative atoms, likely oxygen, where electron density was strongly localized. That was where we identified the oxygen atom, which had a high population (~8-9e-), the carbon atom, which had a moderate population (~5-6e-), and the hydrogen atom, which had a low population (0.2-1).
Next, from Figure 13 we interpreted chemical bonding strength using overlap populations. The equation was:
Bond order~2xOverlap population (6)
Between atoms 6 and 7 the value was 0.369, while the actual overlap was 0.738. Thus, a strong positive overlap population (0.738) between atoms 6 and 7 indicated a significant covalent bonding interaction, consistent with a σ-bond between adjacent heavy atoms. Between atoms 2 and 3 the value was 0.309→0.618 (afterx2) which suggested a stable covalent bond with moderate electron sharing. Between atoms 1 and 4 the value was 0.00296→0.00592~0.006 which indicated negligible bonding interaction between non-bonded, or distant atoms. Between atoms 2 and 4, the value was -0.072→-0.144. Between atoms 3 and 16 the value was -0.322→-0.644. And between atoms 5 and 16 the value was -0.172→-0.344. Those negative values showed antibonding interactions. Negative overlap populations indicated antibonding interactions or electron density depletion between atomic centers. The strong negative value between atoms 3 and 16 (-0.644) suggested antibonding character, possibly due to orbital phase mismatch or steric/electronic repulsion. Those overlap population values could be linked to the chemical structure of the surfactant molecule. The strong overlaps (~0.3-0.4) could be C-C or C-O σ bonds. The moderate overlaps (~0.1-0.3) could be C-H or weaker σ bonds. The near zero overlap could be non-bonded atoms, and the negative overlaps could be antibonding/steric effects. In Figure 13 there were multiple non-zero overlaps across atoms 6-7-8 which indicated partial electron delocalization or conjugation.
The Mulliken atomic overlap population analysis provided quantitative insight into the bonding characteristics of the system [35]. Diagonal elements revealed electron localization, with atoms such as atom 5 (9.197e-) and atom 8 (8.627e-) (Figure 13) exhibiting high electron density, indicative of electronegative centers, likely oxygen atoms. Off-diagonal elements, when multiplied by two, quantified bonding interactions. Strong positive overlap populations, such as between atoms 6 and 7 (0.738e-), confirmed significant covalent bonding, while moderate values (i.e. atoms 2-3, -0.618e-) indicated stable σ-interactions. In contrast, negative overlap populations (i.e. atoms 3-16, -0.644e-) suggested antibonding interactions or electron density depletion. The distribution of overlap populations supported a predominantly σ-bonded framework with localized electron density on heteroatoms and limited delocalization across the surfactant’s molecular backbone.
Figure 13:Mulliken atomic overlap populations.
The output in Figure 14 showed which atoms contributed to each molecular orbital. The rows corresponded to atoms, while the columns corresponded to molecular orbitals (MO 1-33). Each number represented the electron population contribution of a given atom to a specific MO. From the output for atom 8 MO1 was 1.996748, which meant that MO1 was almost completely localized on Atom 8, because its contribution was ~2.00 electrons, while all other atoms contributed nearly zero. Thus, MO1 was a highly localized orbital centered on atom 8. From the output in Figure 14 we observed that the first orbitals (MO1-8) were strongly localized. For MO 1 the dominant contribution was from atom 8 which was 1.996748, therefore MO 1 was almost entirely centered on atom 8. For MO 2 the dominant contribution was from atom 5 which was 1.996122, therefore MO 2 was localized mainly on atom 5. For MO 3 the dominant contribution was from atom 4 which was 1.990994, and with smaller contribution from atom 3 which was 0.011022. Thus, MO 3 was mainly an atomic-centered orbital on atom 4 with slight mixing from atom 3. For MO 4 the dominant contribution was from atom 6, which was 1.985839, and therefore MO 4 was localized on atom 6. For MO 5 the dominant contribution was from atom 7, which was 1.984341 and thus MO 5 was centered on atom 7. Then we observed the beginning of orbital mixing for MO 9-10. These orbitals showed stronger delocalization. For MO 9 the main contributions were
Figure 14:Mulliken population in each molecular orbital (MO).
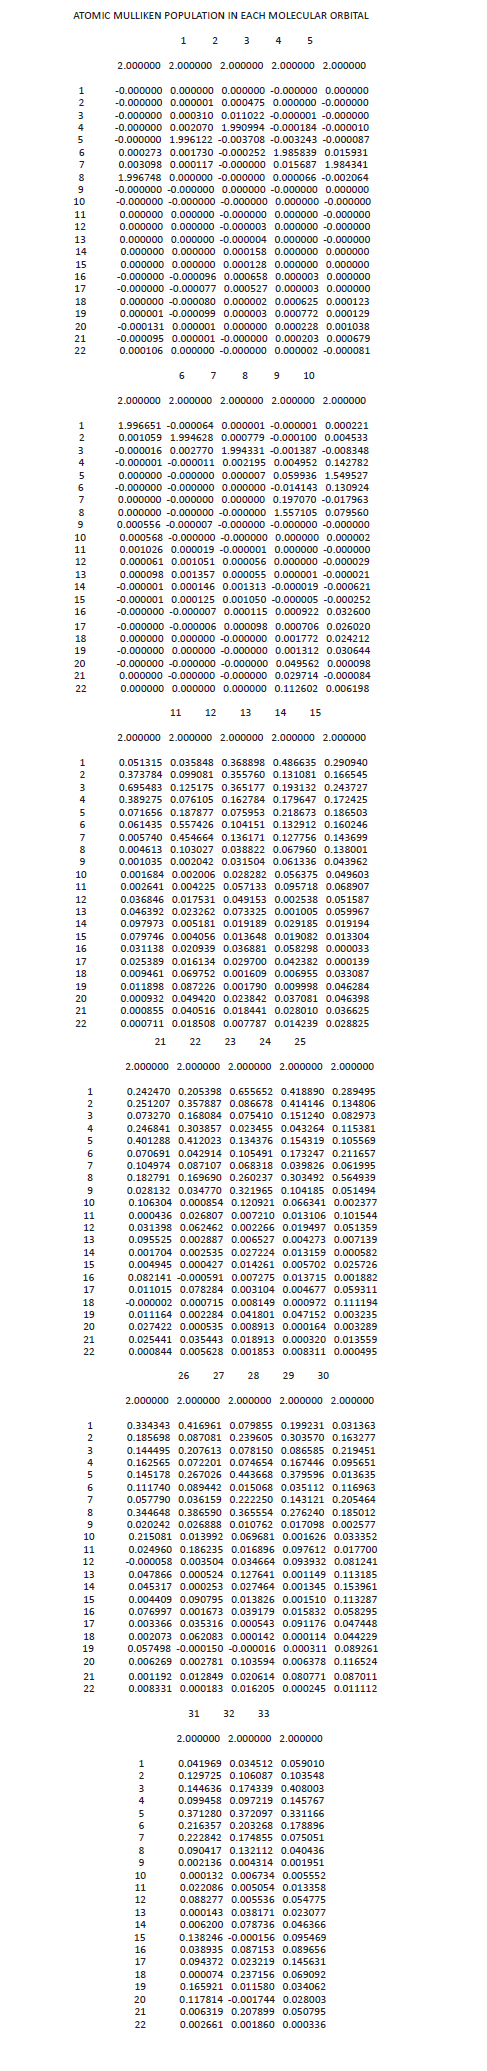
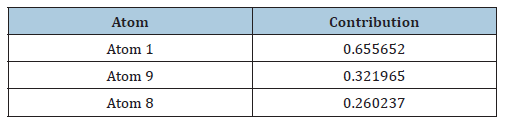
From Table 10 we observed that MO 9 was primarily localized on atom 8 but exhibited significant delocalization over atoms 7, 22, 5 and 20. For MO 10 the main contributions were
Table 10:
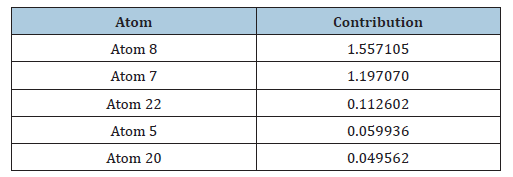
From Table 11 we observed that MO 10 was mainly centered on atom 5 with partial delocalization over atoms 4 and 6. Then we observed that from MO 11 to MO 33 the orbitals were highly mixed. For MO 13 the major contributions were
Table 11:
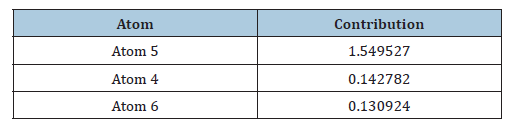
From Table 12 we observed that MO 13 was strongly delocalized over atoms 1-4, suggesting a conjugated bonding orbital involving multiple neighboring atoms. That conclusion suggested electron delocalization, stabilization, and participation in excited-state transitions. For MO 17 the major contributions were
Table 12:
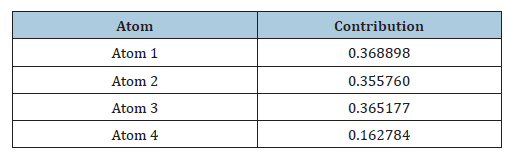
From Table 13 we observed that MO 17 exhibited strong localization on atoms 7 and 8 with secondary delocalization toward atoms 20 and 22. For MO 23 the major contributions were
Table 13:
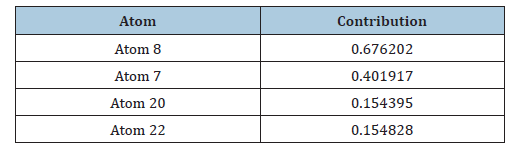
From Table 14 we observed that MO 23 was highly delocalized and contained significant contributions from atoms 1, 8, and 9, indicating extended electron density distribution across multiple atomic centers. Thus, the Mulliken population analysis of the molecular orbitals revealed the atomic contributions to the electronic structure of the surfactant molecule. Lower-energy orbitals (MO 1-8) were found to be highly localized on individual atomic centers, indicating core-like electronic states. For example, MO 1 was almost entirely localized on atom 8 with a population contribution of 1.9967 electrons, while MO 2 and MO 3 were dominated by atoms 5 and 4, respectively. In contrast, higher-energy orbitals exhibited significant delocalization across multiple atomic centers. MO 13 showed strong contributions from atoms 1, 2 and 3, indicating conjugated electronic interactions within the molecular framework. Similarly, MO 17 displayed dominant contributions from atoms 7 and 8 with secondary participation from atoms 20 and 22, suggesting extended electron density distribution and possible involvement in electronic transitions. The progressive delocalization observed in higher molecular orbitals was consistent with valence orbital mixing and supported the TDDFT excited-state behavior observed in the UV-Vis calculations, we have tried to execute. Orbitals with mixed atomic character were expected to contribute significantly to electronic excitation processes, charge redistribution, and intermolecular interactions. For the nonionic surfactant system, orbital delocalization may have correlated with intermolecular interactions, adsorption properties, hydrogen bonding capability, and electronic polarizability.
Table 14:
Löwdin population analysis
The Löwdin method improved upon Mulliken analysis by orthogonalizing the basis set symmetrically. Because of this orthrogonalization, Löwdin charges were more stable, less basis-set dependent and chemically more realistic. The Löwdin population analysis corroborated the trends observed in the Mulliken scheme, confirming the localization of negative charge on oxygen atoms and the relative neutrality of the hydrocarbon chain of the surfactant molecule. The consistency between the two methods enhanced the reliability of the calculated electronic structure and supported the interpretation of the molecule’s polarity.
In Figure 15, the output allowed direct interpretation of how orthogonalization modified electron distribution. Firstly, we compared AO populations for carbon atoms. For carbon 1, in Figure 15, we had:
Table 15:
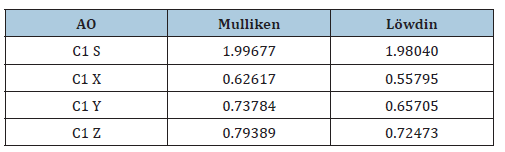
In Table 15 the Löwdin populations were slightly lower from the Mulliken populations, for the p orbitals because the orthogonalization redistributed the electron density more evenly. The same behavior appeared throughout the carbon framework. For carbon 3 (Figure 15), we had:
Figure 15:Populations in each AO-Mulliken-Löwdin.
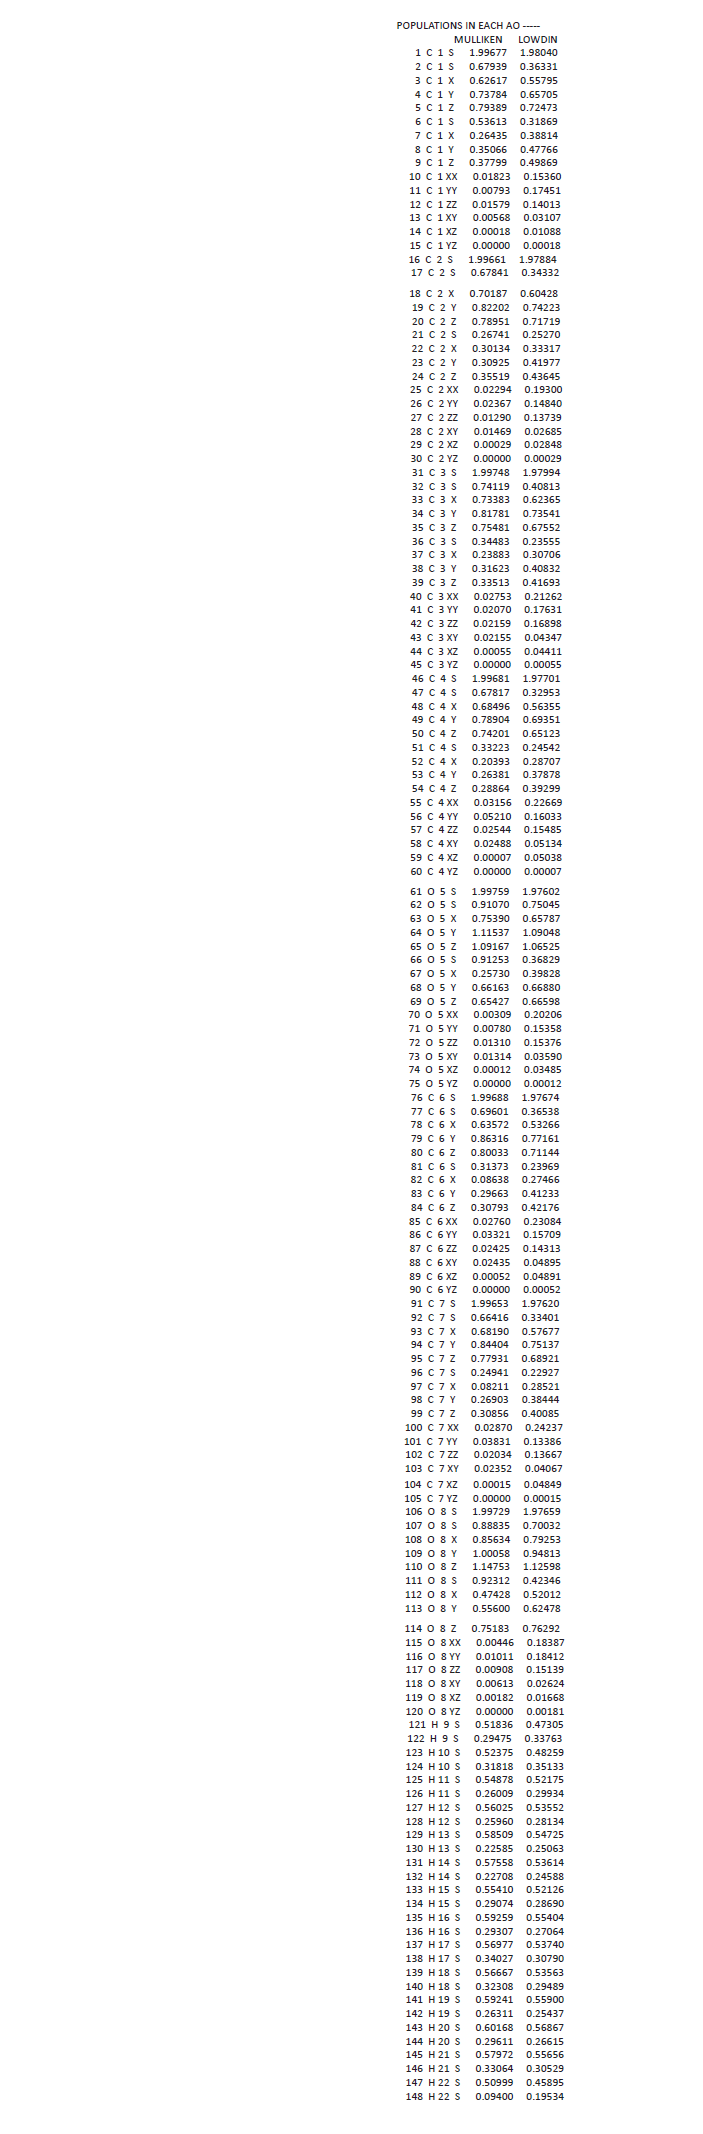
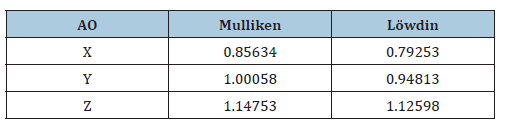
Table 16 showed balanced p-orbital occupation characteristic of tetrahedral carbon bonding. Then for the oxygen electronic structure we observed that the oxygen atoms displayed much larger p-orbital populations. For oxygen 5 (Figure 15), we had:
The high p-orbital populations in Table 17, indicated localized lone-pair electron density, as well as strong electronegativity, and nonbonding electron accumulation on oxygen. That meant that the oxygen p orbitals dominated the electronic structure of the surfactant headgroup. The same behavior appeared for oxygen 8 (Figure 15), for which we had:
Table 16:
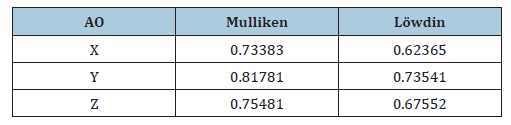
Table 17:
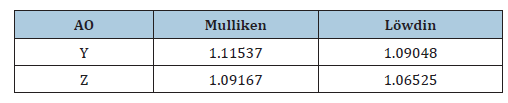
In Table 18 we had a large Z population which suggested directional localization of lone-pair density. That was important because oxygen lone pairs strongly influenced the polarity of the surfactant molecule, the hydrogen bonding, its intermolecular interactions, and also the surfactant’s behavior in solution. Then in the output in Figure 15 were also included polarization functions: XX, YY, ZZ, XY, XZ, YZ. Those d-type polarization functions showed how the electron density was distorted during bonding. For oxygen 8 we had:
Table 18:
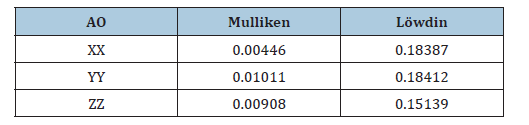
From Table 19, we could deduce that the Löwdin analysis predicted significantly larger polarization contributions than Mulliken. That indicated an anisotropic electron distribution, orbital polarization, and enhanced flexibility of oxygen electron density. Those effects could be chemically meaningful in intermolecular interactions and adsorption phenomena.
Table 19:
In Figure 16 the output gave the net atomic charges. For oxygen 5 and oxygen 8 (Figure 16) we had:
Figure 16:Total Mulliken and Löwdin atomic populations.
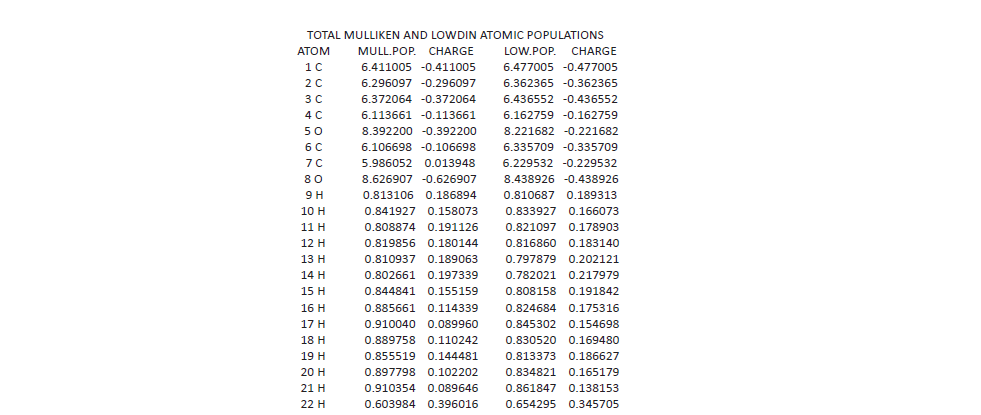
In Table 20 both methods confirmed that oxygen atoms were negatively charged, but the Löwdin method predicted less extreme charges. From the output in Figure 16, for carbons, C1 and C7 we had:
Table 20:

In Table 21 we observed that the Mulliken method produced artificial charge fluctuations because of overlap sensitivity. The Löwdin method smoothed those effects and provided chemically realistic values. From the output in Figure 16, for hydrogen atoms we had:
Table 21:

Table 22:
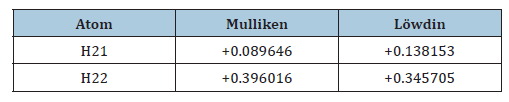
In Table 22 we observed that the hydrogen atoms remained positively charged, showing electron withdrawal toward oxygen atoms. Thus, the Mulliken and Löwdin population analyses consistently demonstrated substantial electron localization on oxygen atoms, particularly within the p orbitals associated with lone-pair electronic density. The oxygen centers exhibited significantly negative atomic charges, confirming their role as the primary electron- rich regions of the molecule. The carbon atoms displayed balanced s and p orbital populations characteristic of sp3 hybridization, while polarization functions revealed anisotropic electron distribution and orbital flexibility. Comparison between Mulliken and Löwdin schemes showed that Löwdin orthogonalization produced smoother and chemically more reliable charge distributions by reducing basis-set overlap artifacts. The strong oxygen-centered electron density and polarized bonding framework were consistent with the expected intermolecular interaction capability and amphiphilic behavior of the nonionic surfactant system.
Mulliken spherical harmonic populations
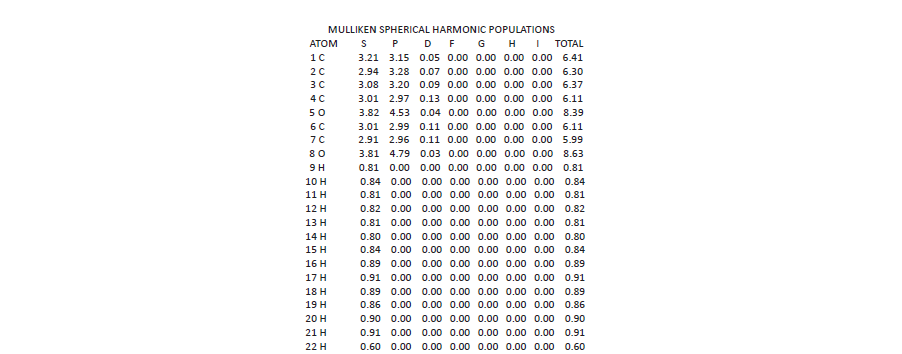
The Mulliken Spherical Harmonic Population analysis (Figure 17) of the nonionic surfactant molecule provided important information about the electronic distribution, hybridization behavior and bonding characteristics of the system. The data in Figure 17 separated the electron population into contributions from spherical harmonic atomic orbitals (s,p,d, etc.), allowing a detailed interpretation of the molecular electronic structure. In this study, the surfactant molecule contained carbon, oxygen and hydrogen atoms, corresponding to an alcohol ethoxylated nonionic surfactant structure. The analysis showed that the carbon atoms possessed nearly balanced s and p electron populations. Atom 1 (C) exhibited 3.21 electrons in s orbitals and 3.15 electrons in p orbitals, giving a total population of 6.41 electrons. Similarly, atom 2 contained 2.94 s electrons and 3.28 p electrons, while atom 3 contained 3.08 s electrons and 3.20 p electrons. Those values indicated sp3-like hybridization of the carbon framework, which was characteristic of saturated hydrocarbon chains present in nonionic surfactants. The small but nonzero d-orbital populations observed for carbon atoms (0.05-0.13 electrons) suggested minor polarization effects within the molecular electron density. Although d-orbitals did not significantly participate in bonding for light atoms such as carbon, their small contributions arose from basis set polarization functions used in the DFT calculations [36]. That improved the flexibility of the wavefunction and allowed more accurate representation of electron delocalization and molecular polarization effects. The oxygen atoms exhibited the largest electron populations in the molecule. Oxygen atom 5 possessed 3.82 electrons in s orbitals and 4.53 electrons in p orbitals, for a total of 8.39 electrons, while oxygen atom 8 contained 3.81 s electrons and 4.79 p electrons, with a total population of 8.63 electrons. The strong dominance of p-orbital electron density on oxygen reflected the presence of lone-pair electrons localized mainly in oxygen 2p orbitals. That was an important characteristic of ether and alcohol functional groups in the nonionic surfactant. The larger p-population on oxygen compared with carbon indicated enhanced electronegativity and electron-withdrawing capability of the oxygen centers. In the surfactant molecule, these oxygen atoms formed the hydrophilic region responsible for intermolecular interactions such as hydrogen bonding and dipole-dipole interactions with water molecules. Consequently, the Mulliken spherical harmonic populations supported the amphiphilic behavior of the surfactant, where the oxygen-rich head groups contributed hydrophilicity while the hydrocarbon chain contributed hydrophobicity. Hydrogen atoms displayed populations close to 0.80-0.91 electrons, entirely in s orbitals, with negligible p or d contributions. That behavior was expected because hydrogen contained only a 1s valence orbital. The slightly reduced electron populations relative to the ideal value of 1.0 electron indicated partial electron transfer toward the more electronegative oxygen atoms and the polarized carbon frame work. The data also revealed differences between carbon atoms located near oxygen atoms and those further along the hydrocarbon chain. Carbon atoms adjacent to oxygen exhibited slightly altered s/p ratios and somewhat larger d-polarization contributions, indicating electronic perturbation induced by the electronegative oxygen centers. Such effects were typical in the ethoxylated surfactants where electron density redistribution occurred along the C-O-C linkage. The Mulliken Spherical Harmonic Population analysis demonstrated that the carbon atoms exhibited predominantly sp3 hybridized bonding behavior, and that the oxygen atoms possessed strong p-orbital electron density associated with lone-pair electrons. Also, the oxygen centers formed electronically rich hydrophilic regions, and the hydrogen atoms remained almost purely s-orbital in character. The small d- orbital contributions indicated polarization effects captured by the basis set. Finally, the electronic distribution confirmed the amphiphilic nature of the nonionic surfactant molecule in this study. Those findings were important for understanding the physicochemical properties of the surfactant, including solubility, intermolecular interactions, adsorption behavior and potential excited-state electronic transitions. The strong oxygen p-orbital populations may have also influenced the UV absorption characteristics, the charge-transfer interactions, and the stabilization of excited electronic states within the surfactant system.
Figure 17:Mulliken Spherical Harmonic Populations.
Conclusion
In the present work, an integrated spectroscopic, optical, colorimetric and computational investigation of the commercial liquid detergent Servin Quality Ultra was performed in order to establish correlations between its molecular composition, optical response and physicochemical behavior. The combined experimental and theoretical analyses demonstrated that the detergent behaved as a complex amphiphilic colloidal system dominated by nonionic ethoxylated surfactants with minor inorganic and chromophoric additives. Unlike detergents formulated with anionic surfactants such as linear alkylbenzene sulfonates, or sodium lauryl sulfate, which exhibited characteristic sulfate or sulfonate infrared absorption bands and whose solution behavior depended strongly on ionic strength and pH, the investigated formulation displayed optical and spectroscopic characteristics typical of nonionic alcohol ethoxylates. The observed pH stability over the investigated concentration range was consistent with the absence of ionizable surfactant head groups, while the optical response was governed primarily by micellar light scattering and localized molecular electronic transitions. The pH measurements showed remarkable stability (pH=6.9) across all investigated concentrations such as 1%w/w and 10%w/w, indicating chemical stability of the formulation and the absence of concentration-depended acid-base variations. Such near-neutral behavior supported the suitability of the detergent for general-purpose domestic applications while maintaining colloidal stability. FT-IR spectroscopy revealed that the detergent composition was dominated by saturated aliphatic and ethoxylated surfactant structures. The characteristic absorption bands at approximately 2921cm-1 and 2844cm-1 confirmed the presence of long alkyl hydrocarbon chains, while the intense bands in the 1148-1037cm-1 region demonstrated the predominance of ether and polyethoxylated functionalities. Additional weak carbonyl and aromatic related bands suggested the presence of preservatives, fragrance molecules and minor oxygen containing additives. The low-wavenumber region further indicated contributions from phosphonate and silicate inorganic builder species. Diffuse reflectance spectroscopy demonstrated that the detergent exhibited an absorption in the ultraviolet region and weak absorption in the visible region, consistent with the absence of highly conjugated chromophoric systems. The gradual increase in reflectance within the visible region confirmed that the optical behavior was primarily governed by localized molecular electronic transitions and diffuse scattering from micellar aggregates. The smooth spectral profile and the absence of sharp absorption edges demonstrated that the detergent did not behave as a semiconductor material with a defined electronic band structure. Kubelka-Munk transformation and Tauc analysis suggested an apparent optical transition energy of approximately 3.1eV. However, the absence of a well-defined linear absorption edge confirmed that the observed transitions corresponded to localized molecular HOMO- LUMO excitations. The optical response was therefore associated with weak n→σ*, n→π*, and limited π→π* electronic transitions originating from oxygen-containing molecular orbitals and minor chromophoric additives. Colorimetric measurements showed relatively low brightness and moderate transparency. The CIE Lab* values indicated a weak reddish-blue coloration attributed primarily to fragrance additives and trace chromophores rather than to the surfactant matrix itself. The relative low opacity and high transparency further supported the presence of micellar structures with dimensions smaller than visible wavelengths, thereby minimizing strong scattering effects. The computational chemistry section provided molecular level interpretation of the experimental observations. Density Functional Theory calculations performed on a representative alcohol ethoxylate fragment confirmed the structure stability and amphiphilic nature of the surfactant system [37]. Geometry optimization yielded bond lengths for saturated hydrocarbons and ether-containing molecules. Mulliken and Löwdin population analyses revealed pronounced charge localization on oxygen atoms and positive charge accumulation on hydrogen atoms, confirming the hydrophilic character of oxygen-containing groups. Atomic orbital population analysis demonstrated dominant sp3 hybridization along the carbon backbone together with enhanced oxygen p-orbital contributions associated with lone-pair electron density. The Time-Dependent DFT interpretation further supported the experimental optical findings by indicating that the principal electronic transitions originated from localized oxygen lone-pair orbitals toward antibonding molecular orbitals. These transitions occurred predominantly in the UV region, explaining the weak visible absorption and the insulating optical behavior of the detergent system. The calculations demonstrated that the detergent’s optical properties were controlled primarily by localized molecular excitations rather than by extended electronic delocalization.
Finally, this study provided a comprehensive characterization of a commercial liquid detergent using complementary spectroscopic and optical techniques. The integrated approach highlighted the importance of combining spectroscopic and optical methods for the characterization of complex formulations. The methodology developed in this work may be extended to the characterization of other complex colloidal detergent consumer products, surfactant formulations, and amphiphilic materials..
References
- Rosen MJ, Kunjappu JT (2012) Surfactants and Interfacial Phenomena (4th edn), Wiley, pp.1-616.
- Madsen T, Boyd HB, Nylen D, Pedersen AR, Pedersen GI, et al. (2001) Environmental and health assessment of substances in household detergents and cosmetic detergent products. Environ Project 615: 1-235.
- Ameri M, Attwood D, Collett JH, Booth C (1997) Self-assembly of alcohol ethoxylate non-ionic surfactants in aqueous solution. J Chem Soc Faraday Trans 93(15): 2545-2551.
- Tadros TF (2013) Applied surfactants: Principles and applications. Wiley-VCH: Weinheim, Germany, pp.1-634.
- Hebach A, Oberhof A, Dahmen N, Dinjus E (2003) Interfacial phenomena in the system water + CO2 + alcohol ethoxylates. J Chem Eng Data 48: 1557-1560.
- Stuart B (2004) Infrared Spectroscopy: Fundamentals and Applications. Wiley.
- Kubelka P, Munk F (1931) An article on optics of paint layers. Z Tech Phys 12: 593-601.
- Tauc J (1968) Optical properties and electronic structure of amorphous Ge and Si. Mater Res Bull 3(1): 37-46.
- Davis EA, Mott NF (1970) Conduction in non-crystalline systems V. Conductivity, optical absorption and photoconductivity in amorphous semiconductors. Philos Mag 22(179): 903-922.
- Hunt RWG, Pointer MR (2011) Measuring Colour, (4th edn), Wiley, Chichester, UK.
- Jensen F (2017) Introduction to computational chemistry, (3rd edn), Wiley, Chichester, UK.
- Schmidt MW, Baldridge KK, Boatz JA, Elbert ST, Gordon MS, et al. (1993) General atomic and molecular electronic structure system. J Comput Chem 14(11): 1347-1363.
- International Standard ISO 2271 (1989) Surface active agents-Detergents-Determination of anionic-active matter by manual or mechanical direct two-phase titration procedure, pp. 1-5.
- EN 1262 (1996) Surface active agents-Determination of the pH value of surfactant solutions or dispersions, pp. 1-6.
- International Standard ISO 11475 (2017) Paper and board-Determination of CIE Whiteness, D65/10 degrees (outdoor daylight), pp. 1-16.
- International Standard ISO 2470-1 (2008) Paper, board and pulps-Measurement of diffuse blue reflectance factor, Part 1: Indoor daylight conditions (ISO brightness), pp. 1-11.
- International Standard ISO 2471 (2008) Paper and board-Determination of opacity (paper backing)-Diffuse Reflectance method, pp. 1-8.
- Tabor RF, Eastoe J, Dowding PJ (2009) Adsorption and desorption of nonionic surfactants on silica from toluene studied by ATR-FTIR. Langmuir 25: 9785-9791.
- Silverstein RM, Webster FX, Kiemle DJ, Bryce DL (2014) Spectrometric Identification of Organic Compounds, 8th edn, Wiley, New York, USA.
- Garcia MHF (2022) Determination of degree of ethoxylation of fatty alcohol ethoxylates by FTIR/ATR spectroscopy and multivariate calibration. Tenside Surfactants Detergents 59: 264-268.
- Kortum G (1969) Reflectance spectroscopy: Principles, methods, applications, Springer-Verlag, Berlin, Germany.
- Schaefer DW, Keefer KD (1986) Structure of random porous materials: Silica aerogel. Phys Rev Lett 56(20): 2199-2202.
- Myers Drew (2005) Surfactant science and technology, (3rd edn), John Wiley & Sons, Inc.
- Omed GH Abdullah, Shujahadeen B Aziz, Khalid M Omer, Yousif M Salih (2015) Reducing the optical band gap of polyvinyl alcohol (PVA) based nanocomposite. J Mater Sci: Mater Electron 26: 5303-5309.
- Makula P, Pacia M, Macyk W (2018) How to correctly determine the band gap energy of modified semiconductor photocatalysts based on UV-Vis spectra. J Phys Chem Lett 9(23): 6814-6817.
- Wood DL, Tauc J (1972) Weak absorption tails in amorphous semiconductors. Phys Rev B 5: 3144-3151.
- Commission International de l’ Eclairage (CIE) (2004) Colorimetry 3rd edn, CIE Publication No.15:2004, Vienna, Austria.
- McDonald R (1997) Colour Physics for Industry, 2nd edn, Society of Dyers and Colourists: Bradford, UK.
- International Standard ISO 11476 (2016) Paper and board-Determination of CIE whiteness, C/2o (indoor illumination conditions), pp. 1-16.
- Jensen F (2017) Introduction to computational chemistry, 3rd edn, Wiley, Chichester, UK.
- Koch W, Holthausen MC (2001) A chemist’s guide to density functional theory, 2nd edn, Wiley-VCH: Weinheim, Germany.
- Mulliken RS (1955) Electronic population analysis on LCAO-MO molecular wave functions I. J Chem Phys 23: 1833-1840.
- Lowdin PO (1950) On the non-orthogonality problem connected with the use of atomic wave functions in the theory of molecules and crystals. J Chem Phys 18: 365-375.
- Bauernschmitt R, Ahlrichs R (1996) Treatment of electronic excitations within the adiabatic approximation of time dependent density functional theory. Chem Phys Lett 256: 454-464.
- Casida ME (1995) Time-dependent density functional response theory for molecules. In: Chong DP (Ed.), In Recent Advances in Density Functional Methods, World Scientific: Singapore 1: 155-192.
- Parr RG, Yang W (1989) Density functional theory of atoms and molecules. Oxford University Press.
- Gross EKU, Dreizler RM (1995) Density Functional Theory, Springer: Berlin, Germany.
© 2026 Katerina Chryssou. This is an open access article distributed under the terms of the Creative Commons Attribution License , which permits unrestricted use, distribution, and build upon your work non-commercially.
Editor In Chief







.jpg)































Signup for Newsletter

Quick Links
 Editorial Board Registrations
 Submit your Article
 Best Paper of the Volume
 Reprints
 Refer a Friend
 Advertise With Us
Our Recent Edition

.jpg)



Top Editors




.jpg)

















.bmp)
.jpg)
.png)
.jpg)













.jpg)






.png)

.png)




.png)




Financial Support

Sponsors

Latest e-Books

Latest Video

 a Creative Commons Attribution 4.0 International License. Based on a work at www.crimsonpublishers.com.
Best viewed in
a Creative Commons Attribution 4.0 International License. Based on a work at www.crimsonpublishers.com.
Best viewed in 
 | Above IE 9.0 version