
- About Us
- Information
-

The Author ensures that the research has been conducted responsibly and ethically with adherence to all relevant regulations. read more..
- For Authors
- For Reviewer
- Manuscript Guidelines
- Membership
- Publication Ethics
-
- Journals
- Reprints
- e-Books
- Videos
- Policies
- Contact Us
 COVID-19
- Submissions


Full Text
Annals of Chemical Science Research
Study of the Effect of Volume Electrical Resistivity on the Properties of Copy Paper Samples
Katerina Chryssou* and Eugenia Lampi
General Chemical State Laboratory, B΄ Chemical Division of Athens, Department Α΄ Tsocha 16, Greece
*Corresponding author:Katerina Chryssou, General Chemical State Laboratory, B΄ Chemical Division of Athens, Department Α΄ Tsocha 16, 11521 Athens, Greece
Submission: March 26, 2026;Published: April 16, 2026

Volume5 Issue4April 16, 2026
Abstract
The volume electrical behavior of copy papers was influenced by several structural, compositional and mechanical properties that significantly affected charge transport mechanisms, through the fibrous network. In this work, the relationships between volume electrical resistivity (ρv) and physical and mechanical properties of commercial copy papers were systematically investigated using advanced statistical analysis in order to understand the factors controlling electrical performance, and their implications for paper quality and environmental stability. The examined parameters were moisture content, thickness, grammage, density, ash content on ignition at 900 °C, Bendtsen roughness, tensile strength in the machine direction (MD), cross direction (CD) and pick resistance in both MD and CD direction. Linear regression analysis indicated that volume resistivity decreased with increasing moisture content, density, ash content, grammage, roughness Bendtsen, and pick resistance, while it increased with increasing paper thickness, and tensile strength in the cross direction (CD). Moisture content, among the other parameters, exhibited the strongest influence on electrical behavior, and showed the role of moisture-assisted ionic conduction within the copy paper structure. However, the individual linear regressions generally showed low coefficients of determination, and suggested that the volume electrical resistivity was controlled by a combination of interacting structural factors, rather than a single variable. Descriptive statistical analysis revealed distinct distribution patterns among the investigated paper properties. Volume resistivity exhibited strong positive skewness and high kurtosis, indicating a highly asymmetric distribution, typical of moisture dependent electrical conduction in porous fibrous networks. Structural parameters such as grammage, density, thickness, roughness Bendtsen and ash content showed approximately symmetric distributions, with near normal kurtosis, indicating the controlled nature of the papermaking process. Pick resistance displayed moderate variability between the MD and CD, consistent with the anisotropic structure of paper. Distributional diagnostics using the Shapiro-Wilk test (n<50)revealed deviations from normality for volume resistivity, and moisture content, while the other properties followed approximately normal distributions. Levene’s test indicated heterogeneity of variances among groups with p<0.001. One-way analysis of variance (ANOVA) demonstrated significant differences among the examined property groups with F=10.245, p<0.001, and with a moderate effect size η2=0.304. This result was robust and was confirmed by Welch, and Brown-Forsythe tests, which also indicated significant differences (p<0.001). The statistical findings were supported by boxplots, histograms, and normal Q-Q plots, which illustrated the variability, and skewness of the volume electrical resistivity distributions. The results indicated that volume resistivity in copy paper was mainly controlled by moisture content, while structural parameters, such as thickness, and density, modulated conduction pathways within the fiber network. Mechanical surface properties, including roughness Bendtsen, and pick resistance, exerted secondary effects. The findings from this study may have contributed to a better understanding of the structural and electrical relationships in copy papers, and may have supported future research aiming at improving copy paper performance, its quality control, and also the environmental stability in printing, and electrostatic applications.
Keywords:Electric volume resistivity; Density; Paper moisture; Grammage; Paper thickness; Ash on ignition 900 °C; Tensile strength; Bendtsen roughness; Pick resistance; Fiber network; Ionic conduction; Multivariate analysis; Copy paper; Linear regression; One-way ANOVA; Descriptive statistical analysis; Normal Q-Q plots; Histogram; Boxplot; Machine direction (MD); Cross direction (CD); Electrostatic behavior
Introduction
Electrical transport in porous fibrous materials such as paper has attracted increasing attention due to its relevance in printing technologies, electrostatic control, and emerging functional materials. Although paper is traditionally considered an electrical insulator, its resistivity is highly sensitive to environmental and structural factors, particularly moisture content, fiber network architecture, and filler composition.
Understanding the mechanisms governing electrical resistivity in paper is essential not only for quality control in printing applications but also for the development of advanced paper-based materials, including antistatic substrates and printed electronic platforms.
Electrical resistivity is a key physical property of all materials. The electrical resistivity of a material is a number describing how much that material resists the flow of electricity. Resistivity is measured in units of ohm. meters (Ω.m) [1]. If electricity has great difficulty flowing through a material that material has high resistivity. On a microscopic level, electricity is simply the movement of electrons through a material. As an electron moves through the material it collides with stationary atoms of the material. These collisions tend to slow the electron movement. The number of collisions an electron has can be different in various materials [1]. The material that produces a lot of collisions is a high resistivity material. A correct understanding of the electrical resistivity of different materials requires a thorough understanding of quantum mechanics. The electric resistivity of a material can vary with temperature. The resistivity of metals usually increases as temperature increases [1].
The electric resistance is generally used as a measure for the electric conductivity, i.e. the ease of electric passage, of a substance. The value of the resistance expressed per unit volume (1cmx1cmx1cm) is called volume resistivity in the unit Ω.cm. A definition of volume resistivity (ρv, Ω.cm), could be the quotient of a direct current electric field strength and the steady-state current density within an insulating material [2].
Volume resistivity can be used as an aid in the choice of an insulating material for a specific application. Volume resistivity measurements are often used in checking the uniformity of an insulating material, either with regard to processing or to detect conductive impurities [2].
In practice, resistivity or volume resistivity is often used as an indicator of material electric conductivity. A material with high resistivity indicates that electrical static charges are not easy to dissipate once this material is charged [3]. It was speculated that pharmaceutical granules became less conductive due to reduced surface moisture. To quantify conductivity of pharmaceutical powders, at various moisture contents, the volume resistivity was measured and it was correlated with charge generation, as moisture content was reduced [3]. The electrical resistance technology is based on the principle that a medium’s moisture content can be determined from the value of the electrical resistance measured between electrodes inserted into the respective medium.
Papers have electrical resistivities that are characteristically high and in most electrical applications they are essentially used as insulators [4]. It is convenient to divide materials into three categories, i.e. conductors, antistatic materials, and insulators. There is no strict definition of these terms with respect to resistivity. As a guide we could take the ranges to be <103, 103-109, and >109sup>Ω.m, respectively. Resistivities are usually measured with specially shaped specimens and electrode configurations that are chosen in a way that uniform electric fields are generated in the material [4].
Runnability and printability are two main parameters that define the extent to which the paper is used in the printing and converting industry. Studies on the printability of papers in electrophotography have found that the density of paper and the surface roughness among others have importance for the final visual and measured print quality [5]. For transporting the charged toner particles, electrostatic forces are needed, with the help of the contact pressure between the imaging drum and the paper. The volume resistivity of paper is dependent on the electric field strength, and this dependence is influenced by the thickness, density and the filler content of the paper [5]. Testing of nonwood papers has been done for some types of papers and printing technologies, such as UV ink-jet technology and offset printing and the test results appeared promising for sensor printing [5].
Electrical resistivity is one of the most sensitive indicators of changes in the nature of chemical binding. A change in the nature of the chemical binding primarily alters the carrier density, and the structural changes alter the carrier mobility. In general, the electrical resistivity is inversely proportional to the carrier density and the carrier mobility. Electrical resistivity plays an important role in technical applications [6]. Colloidal nano crystals investigated are mostly metals, semiconductors and magnetic materials. Determination of the temperature dependent electrical resistance is an important tool to explain the nature of ground state, phase diagrams, electrical, electronic and magnetic properties and instabilities observed of these materials for developments in electronics, and optoelectronics [6]. This study aims to bridge empirical observations with a mechanistic understanding of electrical transport in paper, providing a foundation for predictive modeling and functional material design.
Materials and Methods
Instruments and materials
The resistance meter was a Hiresta-UP Mitsubishi Chemical Corporation Tokyo Japan, model no. MCP-HT450 and with a concentric ring probe electrode URS MCP-HTP14, with diameters d1=0.59cm and d2=1.1cm. The instrument was calibrated before measurement with a probe checker MCP-TRURS, a standard resistance of 5.04x10⁸Ω. All resistances in Ω were measured in accordance with IEC Standard 93 [2], using a test voltage of 500V, and a charge time of 30s, with ten replicate measurements for each of the twenty-two copy paper samples.
A guillotine IDEAL 1043, made in Germany, was used for cutting the paper test pieces to the required dimensions. The paper test pieces were of dimensions 10cmx10cm each, and the resistance was measured for each one sheet of the pack of ten (10) paper test pieces, on the center. Ten paper test specimens were measured separately for all twenty-two copy paper samples.
The paper test sheets sampled from the twenty-two copy paper packets were selected in accordance with ISO 186 standard [7]. The standard atmosphere for preparing, and testing the copy paper samples was (23±1) °C and (50±2) % relative humidity, according to ISO 187 standard [8].
The determination of the grammage of the twenty-two copy papers tested was performed according to ISO 536 standard [9]. An electronic balance Sartorius Basicplus, AG Göttingen Germany BP 221S, with maximum capacity 220g, precision of four decimal places was used to determine the grammage of the trial copy paper samples.
The twenty-two copy paper samples were all tested according to ISO 9781-1,2,3, standards [10-12] and found that they were made of chemical pulp (cellulose), and no mechanical pulp was detected. A digital precision micrometer TMI, Model No. 49-61-01- 0002, S.N.33421-01, with range 0-1.270mm, was used to determine the thickness of the twenty-two copy paper samples, according to ISO 534 standard [13]. The mean apparent sheet density, ds, in grams per cubic centimeter was calculated also according to ISO 534 standard [13].
The ash content on ignition at 900 °C was determined according to ISO 2144 standard [14]. A furnace Carbolite England OAF 11/1, S/N 9/99/2080, with max temperature 1100 °C, was used for maintaining the temperature at 900 °C ± 25 °C, placed in a hood.
The moisture content of the packet of each copy paper sample was determined according to ISO 287 standard [15] and ISO 638- 1 standard [16], by the oven-drying method. An oven Memmert, capable of being controlled at 105 °C ± 2 °C for 16hrs, was used for the determination of moisture of the copy paper samples.
The roughness Bendtsen of the twenty-two copy paper samples was measured according to ISO 8791-2 [17] with a Bendtsen apparatus, which was a Roughness and Air Permeance Tester Bendtsen Method Model No. K513, Messmer Buchel Holland, S.N.:8008-01, 220V, 50Hz. The values of roughness Bendtsen in Tables 1 & 2 were the mean value of two measurements, of the two sides of the paper, of each copy paper tested.
Table 1:Properties of twenty-one copy paper samples that were the trial papers of the study.

Table 2:Properties of twenty-one copy paper samples that were the trial papers of the study.

The tensile strength of the twenty-one copy paper samples was determined according to ISO 1924-2 [18]. A tensile machine Zwick-Roell Z.2.5 with a 2.5kN load cell was used for determining the tensile strength of the trial copy papers according to ISO 1924-2 [18]. Twenty paper test specimens’ strips, of dimensions 15mmx210mm, were measured across the machine direction (MD) and twenty paper test strips we measured across the counter machine direction (CD), for all twenty-one copy papers.
The pick resistance IGT value for the MD and for the CD, of the copy paper samples, was determined with the IGT Global Standard Tester 1, with 350N printing force and with printing velocity 4.00m/s, and the high-speed inking unit 4, software version 3.01, according to ISO 3783 [19]. Paper test pieces were prepared to dimensions of 55mmx340mm used in the testing of pick picking IGT.
Statistical analyses were performed using SPSS software. Linear regression, descriptive statistics, normality testing (Shapiro- Wilk), variance homogeneity (Levene’s test), and one-way ANOVA (including Welch and Brown-Forsythe corrections) were applied to evaluate relationships between variables. A significance level of p<0.05 was adopted.
Results and Discussion
The electrical volume resistivity ρvolume depended on the conditioning atmosphere used for conditioning the copy paper samples. We preconditioned the samples for 24hrs at 23 °C ± 2 °C and 30±5% relative humidity and then we conditioned them for 16hrs at 23 °C ± 1 °C and 50±2% relative humidity [8]. We also preconditioned at 23 °C ± 2 °C and 30±5% relative humidity and conditioned the twenty-two paper test samples before the measurement of their grammage, thickness, roughness Bendtsen, tensile strength and pick resistance, at 23 °C ± 1 °C and 50±2% relative humidity [8].
The volume resistivity (ρv) was derived from the formula as
follows: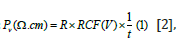
whereas (R): resistance (Ω) and RCF(V): volume resistivity calculation parameter, with units, for the URS probe type, and t the sample thickness in cm. The
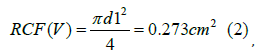
(for volume, with units cm2). The URS probe electrode had diameters d1=0.59cm and d2=1.1cm. The correction factor RCF(V) for the ring probe electrode was determined by the probe electrode diameter d1. The correction factor for the URS probe has been registered in the HIRESTA-UP, so that the selection of the probe type automatically set the corresponding value for RCF(V). Because of the variability of the resistance of the paper specimen with test conditions, and because of non-uniformity of the material from paper specimen to paper specimen, determinations were usually not reproducible to closer than ±10% [2].
The ρvolume resistivity in Ω.cm, of the twenty-two copy papers (Tables 1 & 2) was measured with 500V DC voltage applied to the electrodes, and it reached a constant value after 30s [20].
In Figure 1 the results indicated that the volume resistivity decreased with increasing paper density. The density was related to the copy paper’s sheet micro-structure and thus the charge transport. Increasing paper density led to reduction in pore volume and thus an increase in fiber-fiber contact [21], and fiber-filler contact area [22], which enhanced the ionic conduction pathway. As a result, we had lower volume resistivity [1,20,23]. This pronounced decrease of volume resistivity could be attributed to improved inter-fiber contact, which facilitated the formation of continuous conductive pathways. The reduction in void fraction limited the charge trapping, and promoted more efficient carrier migration across the material.
Figure 1:Relationship between volume electrical resistivity (ρv) and paper density (g/cm3), of 500V applied voltage, of twenty-one copy paper samples (Table 1), showing a decrease in resistivity with increasing fiber packing density due to enhanced conduction pathways..

From Figure 2 we could conclude that the volume resistivity decreased with increasing paper moisture content, related to the content of water in the paper (Table 1). The moisture content directly increased charge carrier concentration, and thus lowered volume resistivity. Moisture content and paper density both reduced the volume resistivity. The statistical R2=0.3393 was higher for moisture content, in comparison to the statistical R2=0.2066 for the density of the paper. That indicated that the moisture content of the paper was the factor which governed ionic conduction, and thus controlled the volume resistivity measured [24,25]. The density of the paper [26], indirectly modified the effectiveness of the ionic conduction which was regulated by the moisture content of the paper [27,28]. Moisture content exhibited a strong inverse relationship with electrical volume resistivity, supporting the hypothesis that ionic conduction dominated the electrical response of paper. The presence of absorbed water increased ionic mobility and enabled the formation of transient conduction channels within the porous matrix.
Figure 2:Volume resistivity ρv versus paper moisture content (%w/w) of 500V applied voltage, of twenty-one copy paper samples (Table 1).

In Figure 3 it was observed that the volume resistivity increased with increasing paper thickness in μm, related to copy paper’s sheet structure and void volume (Table 1). The thickness of the paper may have acted as a geometrical parameter, and not as a factor governing ionic conduction [29]. The moisture content governed the charge carrier availability, while density and thickness acted as secondary structural parameters.
Figure 3:Volume resistivity ρv versus paper thickness (μm) of 500V applied voltage, of twenty-one copy paper samples (Table 1).

From Figure 4 we could deduce that the volume resistivity decreased with increasing paper ash content on ignition (%w/w) (900 °C), (Table 1). The ash content on ignition was denoting the number of mineral fillers which usually were precipitated calcium carbonate, or kaolin, minor inorganic salts, or a combination of all [20,22]. The trend for ash was statistically weak. That was the ash content explained only approximately 5% of the variance. The ash content was a tertiary factor, not a primary control variable such as moisture. The mineral fillers mentioned may have increased the surface ionic activity, may have adsorbed moisture and may have provided additional sites for ion dissociation. So, the moisture content governed the availability of charge carriers, while density, and thickness controlled the geometry, and ash content at 900 °C, acted as a tertiary factor by enhancing moisture assisted conduction.
Figure 4:Volume resistivity ρv versus paper ash content on ignition (%w/w) (900 °C) of 500V applied voltage, of twenty-one copy paper samples (Table 1).

In Figure 5 it was observed that the volume resistivity decreased linearly with increasing paper grammage (g/m2). Grammage acted as a composite, non-fundamental parameter and it showed a weak, indirect relationship with volume resistivity [20,21]. Grammage had a lower R2=0.08 than thickness and density. Grammage combined the effects of thickness and density which applied opposing influences on the electrical volume resistivity. As a result, grammage showed a weak correlation with electrical behavior. Grammage only affected the spatial distribution of moisture. Also, grammage partially reflected the ash content effects. The effect of grammage on volume resistivity was indirect and was the result from its dependence on density, thickness, moisture and ash content, rather from a direct control of electrical conduction.
Figure 5:Volume resistivity versus paper grammage (g/m2) of 500V applied voltage, of twenty-one copy paper samples (Table 1).

In Figure 6 the results indicated that the volume resistivity slightly decreased with increasing paper tensile strength (kN/m) in the Machine Direction (MD) (Table 1) [30]. MD tensile strength was not a controlling parameter of volume resistivity. MD tensile strength generally reflected the fiber orientation in the machine direction, the fiber length distribution, the degree of refining, and the inter-fiber bonding efficiency in plane. MD tensile strength did not measure the through thickness connectivity, the moisture distribution, the ionic concentration, and the electrical pathway continuity in the z-direction which is thickness. Electrical volume resistivity was governed by the z-direction, (thickness), ionic transport, not the in-plane mechanical strength.
Figure 6:Volume resistivity versus paper tensile strength in (kN/m) in the Machine Direction (MD), of 500V applied voltage, of twenty-one copy paper samples (Table 1).

From Figure 7 we could deduce that the volume resistivity increased linearly with increasing paper tensile strength (kN/m) in the Cross Direction (CD) (Table 1). The volume resistivity increased with increasing CD tensile strength and approximately 18% of the variance explained, which was compatible to density and thickness. Thus, CD tensile strength captured a structural feature relevant to electrical transport, that we did not observe with MD tensile strength. But improving the CD tensile strength could come at the expense of z-direction (i.e. thickness) connectivity. A stronger CD network in the paper could lead to flattened fibers, reduced interlayer contacts, increased convolution in the thickness direction [31]. All of these could increase the electrical volume resistivity. Those phenomena explained the positive slope and the moderate R2=0.18. Electrical transport was through thickness, the z-direction, not along the MD direction. But the CD tensile strength was structurally more close to volume resistivity than the MD tensile strength. So, the CD tensile strength captured some directional bonding and orientation. The CD tensile strength reflected anisotropy, not compression. CD tensile strength and thickness acted in the same direction electrically. CD tensile strength did not contradict moisture superiority. Also, ash content, i.e. fillers, increased interfacial sites and tended to reduce CD tensile strength. CD tensile strength partially absorbed ash effects. The contrasting behavior of MD and CD tensile strengths called attention to the anisotropic coupling between the copy paper structure and the electrical transport, confirming that through thickness connectivity, rather than in plane tensile strength, modulated electrical volume resistivity.
Figure 7:Volume resistivity versus paper tensile strength in (kN/m) in the Cross-machine Direction (CD) of 500V applied voltage, of twenty-one copy paper samples (Table 1) [3].

In Figure 8 it was observed that the volume resistivity decreased with increasing paper roughness Bendtsen (ml/min) (Table 1) [20,32-34]. Bendtsen roughness was not a bulk property. Bendtsen roughness probed the outermost fiber layers of the paper sheet. Bendtsen roughness indirectly improved moisture assisted electrical conduction and thus lowered volume resistivity. The R2=0.034 meant that roughness explained only approximately 3% of the variance in volume resistivity. Electrical conduction occurred through thickness, while Bendtsen roughness probed only the surface of the paper sheet. Any important effect must have propagated inward through moisture redistribution. Bendtsen roughness was not a controlling variable. Thicker paper sheets tended to be less calendared and rougher at the surface. Thickness increased resistivity, because of longer conduction path, and roughness slightly decreased resistivity, effect connected to surface moisture. These two effects opposed each other which weakened any net correlation involving roughness. That partial cancelation may have helped explain the low R2=0.034. Roughness Bendtsen was far remote from the conduction mechanism. The fillers present reduced Bendtsen roughness. So, we had a low ash, a high roughness value, i.e. a rough surface, and that led to higher resistivity. The dominant parameters, moisture and density dominated, in a way that the ash, roughness, volume resistivity coupling was thin, producing a weak trend. Then, MD tensile strength had no electrical relevance. So, Bendtsen roughness and MD tensile strength were inversely correlated mechanically, but both were electrically irrelevant. Higher CD tensile strength meant a planar, more compact network of paper fibers, which meant a smoother surface. Bendtsen roughness did not directly control the electrical conduction which occurred through the paper sheet thickness. But rougher surface provided increased surface area and open volume for moisture adsorption, enhancing the moisture assisted ionic transport. The low R2=0.034 indicated that roughness Bendtsen acted as a surface level modifier whose influence was mediated by moisture, density and thickness.
Figure 8:Volume resistivity versus paper tensile strength in (kN/m) in the Cross-machine Direction (CD) of 500V applied voltage, of twenty-one copy paper samples (Table 1) [3].

From Figure 9 we could deduce that the volume resistivity decreased linearly with increasing pick resistance (m/s) in the Machine Direction (Table 1) [20,35]. Pick resistance in the MD belonged to the same family of parameters such as tensile strength, Bendtsen roughness, ash content (900°) and grammage of paper. It appeared as a structural, interfacial, not a primary factor for electrical control. The variance of 8.7% could thus be explained as weak, but non-random. Pick resistance in the MD reflected surface fiber bonding strength, strength of fiber and filler and binder interactions at the surface, and resistance to fiber detachment under the printing stress. Thus, its electrical relevance proved to be indirect and limited. The slope was negative but it still had a meaning, even if it was weak. A higher MD pick resistance implied better fiber bonding, more continuous fiber-fiber contact at the paper surface. These features improved moisture retention at interfaces, and enhanced ionic continuity into the paper sheet. Thus, the MD pick resistance took a part of the effect of density and moisture, without causing the effect. The R2=0.0873 was not large. The MD pick resistance did not control charge carrier concentration, did not control the conduction path, and it did not control anisotropy in the z-direction of the paper, i.e. thickness, of the paper sheet. The electrical influence of the MD pick resistance was mediated by other parameters like density, thickness and moisture. Moisture content may have created the charge carriers. The weak inverse relationship between MD pick resistance and volume resistivity confirmed that surface bonding properties influenced indirectly the electrical behavior of paper, through moisture retention, thickness and density of the paper.
Figure 9:Volume resistivity versus paper pick resistance in m/s, across the Machine Direction, of 500V applied voltage, of twenty-one copy paper samples (Table 1).

In Figure 10 the results indicated that the volume resistivity slightly decreased with increasing pick resistance (m/s) in the Cross Direction (Table 1) [20].
Figure 10:Volume resistivity versus paper pick resistance in m/s, across the Counter Machine Direction, of 500V applied voltage, of twenty-one copy paper samples (Table 1).

The CD pick resistance had a slightly negative slope. The variance was 0.35% and that meant that statistically there was no meaningful dependence of volume resistivity from CD pick resistance. CD pick resistance was introduced statistically by weak co-variation with the moisture content and density, but it contributed nothing to the explanation of the electrical mechanism of the conduction. MD pick resistance had a small explanatory effect with an R2=0.09. So, there was a physical meaning in pick resistance of the anisotropy of paper in its different directions. The MD pick resistance showed a weak trend as to electrical volume resistivity, while CD pick resistance showed no trend.
The property of moisture content showed a dominant relevance to electric volume resistivity. The other properties examined, i.e. density, thickness, CD tensile strength, showed a secondary relevance. The MD pick resistance was a weak modifier of the paper surface, and had a very weak electrical relevance, while the CD pick resistance showed no relevance to the electric volume resistivity.
Next, the test of the null hypothesis if the mean values of the nine properties, of 22 papers, of Table 2, were equal was performed with the statistical package SPSS. For the variance analysis of one factor in SPSS, we followed the following steps. We entered the data of Table 2 in a column of the Data editor in SPSS, which we named it ρvolume and we did the import in rows, i.e. first the elements of the first line, which was ρvolume, the first group then we entered the elements of the second group which was the moisture data in Table 2, then the elements of the third group which was the thickness, then the fourth group which was the grammage, the fifth group which was the roughness Bendtsen, the sixth group which was the density, the seventh group which was the ash content (900 °C), the eighth group which was the pick resistance across the MD and the nineth group which was the pick resistance across the CD. We used a second column (variable) which we called X, to which we gave the value 1 for all the elements of the first group which was ρvolume, the value 2 for the elements of the second group which was moisture, 3 for the elements of the third group which was the thickness, 4 for the fourth group which was grammage, 5 for the group roughness Bendtsen, 6 for the group density, 7 for the group ash content (900 °C), 8 for the group pick resistance across the MD and 9 for the elements of the nineth group which was pick resistance across the CD. That was X, which was a categorical variable with the values X(i)=m, m=1,2,3,…..,9, where m was the number of the group to which the element ρvolume(i) belonged. Then, we examined the equality of variances of the groups with the Levene test, and the normality of the data of each group with the Kolmogorov-Smirov test, or better with the Shapiro-Wilk test because n<50.
The Descriptives table in Figure 11 in SPSS for the One-Way ANOVA provided the essential summary statistics, the mean, the standard deviation for our dependent variable ρvolume within each group of our nine independent variables (Table 2).
Figure 11:Volume resistivity versus paper pick resistance in m/s, across the Counter Machine Direction, of 500V applied voltage, of twenty-one copy paper samples (Table 1).

In Figure 12, a skewness value of 3.785 and a kurtosis of 16.014 indicated that volume resistivity followed a highly rightskewed, heavy-tailed distribution with extreme high values, showing the moisture-dependent and multiplicative nature of electrical conduction in paper. Then in Figure 12, moisture content showed a nearly normal distribution with moderate left skewness, indicating that most paper samples had similar moisture levels while a few relatively dry samples created a small lower value tail. Thickness exhibited a moderate positive skewness (0.602) and slightly negative kurtosis (-0.728), indicating an approximately symmetric distribution with a somewhat flatter shape than a normal distribution. That behavior showed the relatively uniform thickness control of commercial copy paper production. Grammage exhibited slight negative skewness (-0.429) and near-zero kurtosis (-0.099) indicating an approximately symmetric and nearly normal distribution. That behavior showed the tight process control typically applied to the basis weight of commercial copy paper tested in this work. Bendtsen roughness showed slight negative skewness (-0.375) and moderately negative kurtosis (-0.904) indicating a relatively symmetric but somewhat flattened distribution. That showed the natural variability of the fibrous surface structure while remaining within the expected range for commercial copy papers. Next, paper density exhibited slight negative skewness (-0.366) and moderately negative kurtosis (-0.863), indicating an approximately symmetric but relatively flat distribution. That behavior showed the controlled, but naturally variable, fiber packing and combination occurring during the paper making process. The ash content exhibited almost zero skewness (-0.014) and near-zero kurtosis (0.072) indicating an almost perfectly symmetric and normally distributed variable. That behavior indicated the tight industrial control of the mineral filler content in commercial copy paper. Finally, in Figure 12, pick resistance in the MD exhibited moderate negative skewness (-0.517) and slightly positive kurtosis (0.633) indicating a distribution concentrated around the mean with a small tail toward lower strength values. That suggested that most paper samples possessed a similar surface strength in the MD, while a limited number of sheets exhibited weaker fiber bonding at their surface. Pick resistance in the CD exhibited near zero skewness (0.190) and moderately negative kurtosis (-1.024) indicating an approximately symmetric but relatively flat distribution. That suggested a relatively uniform spread of CD surface strength values across the examined copy paper samples.
Figure 12:Analysis of variance with the descriptives table with more statistics, for the nine properties of the twentytwo copy paper samples (Table 2).

In Figure 13, Levene’s test of homogeneity of variances tested whether the variance in scores was the same for each of the nine groups. The Sig. value was smaller than 0.05, i.e. 0.000, which meant that we have violated the assumption of homogeneity of variance (Table 2). The Levene p<0.000 indicated heterogeneity of variances, which meant that the assumption of equal variances was violated.
Figure 13:Results of equality of variances check (Table 2).

From Figure 14 we could deduce how much of the total variance came from the variance between groups or within groups. Because most of the variation was between groups, that meant that there was not probably a significant effect. In a one-way ANOVA, [36] the F statistic was defined as
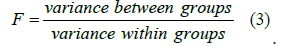
Figure 14:Results of one-way Anova (Table 2).

The value F=10.245>>Fcritical meant that the variability between the group means was about 10 times larger than the variability within the group means. The differences among the means of the nine properties of paper could not be explained by random scatter. There was a systematic separation between groups which aligned perfectly with the finding that some properties like moisture and density were relevant electrically, while others, like pick resistance across the CD, were not. Because F=10.245>>Fcritical=1.67, p<0.001 [37], we could conclude that the groups did have different means and that we could reject the null hypothesis. In this test we set the ρvolume as the dependent factor and the independent list comprised the properties, moisture, thickness, grammage, roughness Bendtsen, density, ash content on ignition, pick resistance MD, and pick resistance CD as numbers from 1 to 9 (Table 2). Because p=0.001<=0.05 the tests were significant, which meant that there was a significant relationship between these properties of the papers (Table 2). The Sig.<0.001, meant that less than 0.1% chance was that the observed separation was random. Thus, the null hypothesis Ho was rejected at a significance level of 0.05 (5%). Also, the F value exceeded the critical F value for α=0.05, confirming rejection of the null hypothesis.
The Table in Figure 15 showed the magnitude of the relationships between the independent variables (factors) and the dependent variable ρvolume, indicating how much variance in the dependent variable was explained by each effect, with common measures like Eta Squared (η2) indicating the proportion of variance explained, here 0.304, which was a large effect. This table complemented the p-value (significance) by revealing that a statistically significant difference was practically meaningful (Table 2). The η2=0.304 [38] meant that 30.4% of the total variance was explained by group membership. It also meant that there was a moderate to large effect in paper chemistry. The effect size was statistically significant but also practically meaningful. We had before the individual regressions which had low R2 values. The ANOVA effect sizes table showed that the group structure still mattered overall.
Figure 15:The one-way ANOVA Effect Sizes table in SPSS (Table 2). .

So, although Levene’s test in Figure 13 indicated unequal variances, the ANOVA result was considered robust given the large effect size, and consistent trends observed across the parameters.
The Table in Figure 16 showed the results for non-parametric alternatives like the Welch Test and the Brown-Forsythe Test. The results indicated if the group means were significantly different when the assumption of equal variances (homogeneity of variances) was violated, providing p-values to determine if at least one mean differed from the others. From Figure 16 the small p-value (Sig.) =0.001<0.05 suggested that at least one group mean, from the nine groups in Table 2, was significantly different from the others. That table appeared because the Levene’s Test (for equal variances) was significant (p<0.000<0.05) indicating unequal variances between groups. The table safely gave us valid results for the group mean comparisons, because our data did not perfectly meet ANOVA’s strict variance assumptions (Table 2).
Figure 16:The table “Robust Tests of Equality of Means” often seen in one-way ANOVA output.

All three tests agreed, i.e. the classical ANOVA showed F=10.245, p<0.001, the Welch Statistic=25185.561, p<0.001 and the Brown- Forsythe Statistic=10.306, p<0.001. The convergence was extremely important, and the result did not depend on variance assumptions, or the test we have chosen. The Welch Statistic value was a large number but in our study the volume resistivity differed by orders of magnitude from the mechanical properties of the copy papers of Table 2. The variances also were unequal and the separation of means was also large. So, the Welch Statistic expanded the received signal. The absolute value had no physical meaning by itself, but its p-value<0.001 mattered.
The Brown-Forsythe Statistic was conceptually closer to the classical ANOVA. It produced an F-like value. The F from Brown- Forsythe=10.306 which was approximately equal to the F from ANOVA=10.245. That near identity notified that even when extreme values and variance heterogeneity were suppressed, the group differences remained strong. While the individual linear regressions explained limited variance, low R2, the robust variance analysis, ANOVA, demonstrated that the properties formed statistically distinct groups, with significantly different mean electrical behavior.
The graph in Figure 17 made our descriptive data more accessible.
Figure 17:The Line Graph of Means visualized the average (mean) scores of the continuous variable ρvolume across the nine different categories of the other variables in Table 2.

Figure 18:The Line Graph of Means visualized the average (mean) scores of the continuous variable ρvolume across the nine different categories of the other variables in Table 2.

In the Figure 18, the variable ρvolume was inserted in the context Dependent List and the categorical variable X was inserted in the context Factor List. From the test Shapiro-Wilk (n<50), of Figure 18, it followed that it could be considered that the observations of groups 3 to 9 followed a normal distribution since Sig.>0.05. The observations of group 1 and group 2 most probably did not follow a normal distribution since Sig.<0.05. The Shapiro-Wilk test checked the null hypothesis Ho whether the data of Table 2 came from a normal, Gaussian, distribution. If the Sig. value>0.05 the rule was that it failed to reject normality, and if the Sig. value<0.05 that it rejected normality. From the table of Figure 18, the X=1, volume resistivity had Sig.<0.001, and X=2, moisture had Sig.=0.039, which both were non-normal. That was expected and was physically meaningful, since volume resistivity spanned orders of magnitude and moisture was bounded and skewed. The thickness value X=3 had a Sig. value=0.081 which showed acceptable normality. The other X values from 4 until 9 in Figure 18, were clearly normal. The grammage, the roughness Bendtsen, the density, the ash content (900 °C) and the pick resistance across the MD, and the CD behaved very well statistically and they were consisted with normal distributions.
Next, we presented some normality plots Q-Q Plots, for all the X values which were categorical variables with the values X(i)=m, m=1,2,3,…..,9 (Table 2). The normal Q-Q plots were inspected to visually assess normality of the continuous variable.
With Q-Q plots [20,21], we were testing whether the distribution of volume resistivity within each group was approximately normal (Figures 19-27). The Normal Q-Q plots of volume resistivity confirmed visually the normal distributional shape within each group, supporting the Shapiro-Wilk results, and justifying the use of one-way ANOVA.
Figure 19:Diagram for normality plot for the X=1, which was the ρvolume, the elements of the first group which was ρvolume (Table 2).

Figure 20:Diagram for normality plot for the X=2, which was the moisture (Table 2).

Figure 21:Diagram for normality plot for the X=3, which was the thickness (Table 2).

Figure 22:Diagram for the normality plot for the X=4, which was the grammage (Table 2).

Figure 23:Diagram for the normality plot for the X=5, which was the roughness Bendtsen (Table 2).

Figure 24:Diagram for the normality plot for the X=6, which was the density (Table 2).

Figure 25:Diagram for the normality plot for the X=7, which was the ash content (900 °C) (Table 2).

Figure 26:Diagram for the normality plot for the X=8, which was the pick resistance of the papers across the MD (machine direction), (Table 2).

Figure 27:Diagram for the normality plot for the X=9, which was the pick resistance of the papers across the CD (counter machine direction) (Table 2).

The Figure 28a showed the boxplot of the nine properties of the samples of copy papers, in Table 2.
Figure 28a:Boxplot.

The boxplot [39,40] meant that when treated as categorical structural classes, the distribution of volume resistivity differed across property types. The boxplot (Figures 28 a-c) explained visually why the within-group variability was large, but betweengroup medians were still separated. That was exactly what the ANOVA F=10.245 meant. The Boxplot analysis of volume resistivity across the nine paper properties tested, revealed clear differences in median values and dispersion patterns, supporting the statistically significant group separation observed in ANOVA, and the other robust tests.
The Figures 28b & 28c showed a more detailed view of the boxplot of Figure 28a, of the nine properties of the samples of copy papers, in Table 2. Figures 28b & 28c provided a comparative visualization of the statistical distribution of the examined parameters through boxplot representation. The median values, interquartile ranges, and the presence of outliers highlighted the variability and dispersion of the datasets, offering insight beyond mean-based analysis. The boxplots presented the median, which was the center line, the interquartile range, which was the boxes, the spread which was the whiskers and the outliers. The wide boxes meant high variability, which meant an unstable parameter. The narrow box meant that it was a controlled property. The median in the box for X=1, was not centered which meant a skewed distribution. This asymmetry was consisted with the non-normal distribution of volume resistivity, reflecting the stochastic nature of moisture-assisted ionic conduction. The presence of outliers, which may have been extreme moisture cases, structural defects, or filler-rich paper samples, suggested localized structural or compositional deviations, which significantly affected electrical transport pathways. The differences in the boxes for X=8, and X=9, corresponded to MD pick resistance, versus CD pick resistance, and reflected the anisotropic nature of the paper structure, where directional properties led to distinct variability patterns. Overall, the boxplots confirmed that volume electrical resistivity and related properties were not uniformly distributed, but were governed by heterogeneous structural features and moisture-dependent conduction mechanisms.
Figure 28b:Boxplot.

Figure 28c:Boxplot.

From Figures 29-37, we had the histograms which showed the distribution of volume resistivity within each paper property category. These were essentially the distributional view behind the ANOVA, the Levene test, the Shapiro Wilk test, and the Boxplots. The histograms [41] confirmed non-normality, and visualized skewness, and supported the choice of the robust tests [41].
Figure 29:Histogram for ρvolume (Ω.cm) of the copy papers tested (Table 2).

Figure 30:Histogram for the moisture content (%w/w) of the copy papers (Table 2).

Figure 31:Histogram for the thickness in μm of the copy papers of Table 2.

Figure 32:Histogram for the grammage (g/m2) of the copy papers of Table 2.

Figure 33:Histogram for the roughness Bendtsen in ml/min of the copy papers of Table 2.

Figure 34:Histogram for the density (g/cm3) of the copy papers of Table 2.

Figure 35:Histogram for the ash content on ignition at 900 °C of the copy papers of Table 2.

Figure 36:Histogram for the pick resistance (m/s) in the machine direction (MD) of the copy papers of Table 2.

Figure 37:Histogram for the pick resistance (m/s) in the cross direction (CD) of the copy papers of Table 2.

The statistical analysis performed in this study demonstrated that moisture content (%w/w) was the primary factor influencing volume resistivity, ρvolume of copy paper samples. The negative linear trend observed, indicated that resistivity decreased with increasing moisture content and although the coefficient of determination was moderate, the interpretation was that moisture enhanced ionic charge transport within the fibrous network of paper. The non-normal distribution of ρv, with Shapiro-Wilk p<0.001, was consistent with moisture assisted conduction mechanisms, which produced skewed behavior, due to multiplicative structural effects and variability in pore water distribution. Secondary structural effects were demonstrated with the properties of paper density and thickness. Density exhibited a negative relationship with ρvolume, while thickness showed a positive relationship. The trends were consistent, since higher density improved fiber-fiber contact and enhanced conductive pathways, lowering resistivity. Also, higher thickness led to longer through plane conduction path, leading to higher resistivity. Although the R2 values of 0.2066 and 0.2024 respectively were modest, these relations reflected bulk structural control of conduction geometry. The individual regressions indicated that density and thickness acted as modulating variables.
Then, ash content at 900 °C and grammage showed weak negative correlations with volume resistivity. Their low R2 values of 0.0536 and of 0.0796 respectively, suggested indirect influence. Ash content modified the fiber-filler interface and could alter moisture retention and structural continuity. Grammage on the other hand integrated thickness and density effects but was not involved on electrical transport. These two properties functioned as composite structural descriptors, whose electrical involvement was mediated by moisture content and density.
The mechanical properties showed anisotropic behavior. The tensile strength in the MD showed R2=0.0016, negligible correlation with ρv. Tensile strength in CD showed R2=0.1818, a moderate positive relationship with ρv. That remark revealed that through thickness structural anisotropy, rather than in plane tensile strength, affected electrical transport [42]. CD tensile strength reflected network consolidation and bonding perpendicular to fiber orientation, influencing vertical conduction pathways.
MD pick resistance showed weak inverse correlation with ρv, with R2=0.0873. CD pick resistance showed nearly no correlation R2=0.0035. These findings confirmed that surface mechanical durability controlled electrical conduction indirectly through its connection with moisture and structural continuity. Surface roughness Bendtsen in ml/min, exhibited a weak negative correlation, R2=0.034, with volume resistivity. Increased roughness may have enhanced moisture uptake locally, and surface ionic mobility, thus slightly reducing resistivity. Roughness Bendtsen was a surface-level modifier and not a bulk transport determinant.
The descriptive statistical analysis of the examined paper properties revealed distinct distribution patterns reflecting differences between manufacturing-controlled parameters and environmentally sensitive properties. Then, with the statistical validation, the Shapiro-Wilk test revealed non-normality for volume resistivity, and moisture, while the structural and mechanical variables were normally distributed. Levene’s test (p<0.001) confirmed unequal variances across groups. One-way ANOVA demonstrated statistically significant differences among the nine examined properties, with F=10.245 and p<0.001. The effect size (η2=0.304) indicated that 30% of total variance was attributable to group classification. Given variance heterogeneity, we applied Welch, and Brown-Forsythe tests, with the Welch statistic=25185.561, p<0.001, and the Brown-Forsythe F=10.306, p<0.001. The agreement of all these methods confirmed that the observed group differences were robust, and they were not driven by non-normality.
Although the low R2 values in the individual regressions seemed inconsistent with the strong ANOVA results, the results in general indicated that, while no single structural parameter fully predicted ρvolume, the properties of the copy papers collectively formed statistically distinct structural categories, with different electrical behavior. Thus, the electrical transport in copy paper was controlled by a multivariate structural moisture interaction, rather than by a single dominant mechanical and geometrical parameter.
Conclusion
The present study provided a comprehensive investigation of the relationships between volume electrical resistivity and the structural, compositional and mechanical properties of commercial copy papers. The results demonstrated that electrical behavior in paper was governed by a complex, multivariate system, rather than by single independent parameters. Previous studies focused on individual parameters, while this work demonstrated a coupled structural-electrical framework.
The statistical analysis, in this study, led to the conclusion that electrical volume resistivity, ρv, in copy paper was dominated by moisture assisted ionic conduction and was modulated by bulk structural reinforcement, and anisotropy. The mechanical surface durability parameters exerted only an indirect influence. Moisture content was identified as the dominant controlling factor, strongly reducing resistivity through moisture-assisted ionic conduction, which increased charge carrier concentration and mobility within the fibrous network. Structural parameters, particularly density and thickness, were shown to play a secondary but significant role by modulating the geometry and continuity of conduction pathways, especially along the through-thickness (z-direction).
The influence of ash content, representing mineral fillers was found to be indirect and limited, acting primarily through interfacial and moisture-related mechanisms. Surface and mechanical properties, including Bendtsen roughness and pick resistance, exhibited weak correlations with resistivity, confirming that electrical transport was fundamentally a bulk-controlled phenomenon. The contrasting behavior between machine direction and cross direction tensile strength further revealed the importance of structural anisotropy, highlighting the role of three-dimensional fiber network organization in electrical conduction.
There was consistency between regression analysis, distribution analysis, variance testing and a robust one-way ANOVA, which confirmed the reliability of those conclusions, despite moderate individual R2 values. The electrical behavior of copy paper emerged from a moisture dominated transport mechanism, embedded in a structurally anisotropic fibrous network, where bulk parameters modulated conduction geometry and the surface mechanical properties exerted secondary effects. The statistical patterns indicated that although structural and compositional parameters of copy paper were tightly controlled during manufacturing, the electrical volume resistivity still remained sensitive to moisture driven conduction mechanisms and microstructural variability within the fibrous network of paper. The statistical analysis further indicated that individual linear correlations were insufficient to fully describe the system, as reflected by low coefficients of determination, and non-normal data distributions. These findings support the need for a multivariate and nonlinear modelling approach to accurately capture the coupled interactions governing electrical transport. A unified mechanistic framework could be proposed, in which electrical resistivity in paper arose from the interplay of a moisture-driven ionic conduction, as the primary mechanism, of the structural percolation and connectivity, as the secondary control, and of interfacial and compositional effects, as tertiary contributions.
The better understanding of the factors controlling the electrical volume resistivity of copy papers was important for improving paper performance in printing, electrostatic handling and environmentally stable storage conditions. This work advanced the understanding of paper as a functional material by linking microstructural characteristics with electrical behavior. Beyond conventional applications, the insights gained opened new perspectives for the design of engineered paper systems with tailored electrical properties, including antistatic materials, sensor platforms and substrates for printed electronics.
Future research should focus on integrating advanced methodologies such as machine learning-based predictive modelling, impedance spectroscopy, and microstructural imaging, to further elucidate transport mechanisms and enable the rational design of next-generation paper-based functional materials.
These findings position paper as a tunable functional material rather than a passive substrate, opening new pathways in electroactive, and sustainable material systems. Future research incorporating advanced modelling, surface functionalization and nanostructured additives is expected to further enhance the performance and expand the application scope of cellulose-based electrical materials. The findings in this study can be extended toward the development of antistatic papers, smart packaging, printed electronics substrates, and sensor-integrated paper systems.
References
- Michael B Heaney (2003) Electrical conductivity and resistivity. In: John G Webster (Ed.), Electrical Measurement, Signal Processing, and Displays, CRC Press, pp. 7-1- 7-14.
- International Electrochemical Commission IEC Standard Publication 93, IEC 60093 (1980) Methods of test for volume resistivity and surface resistivity of solid electrical insulating materials, Second edition, pp. 1-39.
- Kwangseok Choi, Milad Taghavivand, Lifeng Zhang (2017) Experimental Studies on the effect of moisture content and volume resistivity on electrostatic behaviour of pharmaceutical powders. International Journal of Pharmaceutics 519(1-2): 98-103.
- Blythe AR (1984) Electrical resistivity measurements of polymer materials. Polymer Testing 4(2-4): 195-209.
- Igor Karlovits, Urska Kavcic, Gregor Lavric, Andrej Sinkovec, Vladimir Zoric (2020) Digital printability of papers made from invasive plants and agro-industrial residues. Cellulose Chem. Technol 54(5-6): 523-529.
- Yadunath Singh (2013) Electrical resistivity measurements: A review. International Journal of Modern Physics: Conference Series 22: 745-756.
- International Standard ISO 186 (2002) Paper and board-Sampling to determine average quality, pp. 1-9.
- International Standard ISO 187 (2022) Paper, board and pulps-Standard atmosphere for conditioning and testing and procedure for monitoring the atmosphere and conditioning of samples, pp. 1-7.
- International Standard ISO 536 (2012) Paper and board-Determination of grammage, pp. 1-6.
- International Standard ISO 9184-1 (1990) Paper, board and pulps-Fibre furnish analysis-Part 1: General method, pp. 1-7.
- International Standard ISO 9184-2 (1990) Paper, board and pulps-Fibre furnish analysis-Part 2: Staining guide, pp. 1-2.
- International Standard ISO 9184-3 (1990) Paper, board and pulps-Fibre furnish analysis-Part 3: Herzberg staining test, pp. 1-3.
- International Standard ISO 534 (2011) Paper and board-Determination of thickness, density and specific volume, pp. 1-13.
- International Standard ISO 2144 (2019) Paper, board, pulps and cellulose nanomaterials-Determination of residue (ash content) on ignition at 900 °C, pp. 1-10.
- International Standard ISO 287 (2017) Paper and board-Determination of moisture content of a lot-Oven-drying method, pp. 1-10.
- International Standard ISO 638-1 (2022) Paper, board, pulps and cellulosic nanomaterials-determination of dry matter content by oven-drying method-Part 1: Materials in solid form, pp. 1-10.
- International Standard ISO 8791-2 (2013) Paper and board-determination of roughness/smoothness (air leak methods)-Part 2, pp. 1-16.
- International Standard ISO 1924-2 (2008) Paper and board -Determination of tensile properties-Part 2: Constant rate of elongation method (20mm/min), pp. 1-12.
- International Organization for Standardization ISO 3783 (2006) Paper and board–determination of resistance to picking-accelerated speed method using the IGT-type tester (electric model), pp. 1-12.
- Sirvio P, Backfolk K, Maldzius R, Sidaravicius J, Montrimas E (2008) Dependence of paper surface and volume resistivity on electric field strength. J Imaging Sci Technol 52(3): 030501-1 – 030501-8.
- Weber M, Kamal MR (1997) Estimation of the volume resistivity of electrically conductive composites. Polymer Composites 18(6): 711-725.
- Simula S, Ikalainen S, Niskanen K, Varpula T, Seppa H, et al. (1999) Measurement of the dielectric properties of paper. Journal of Imaging Science and Technology 43(5): 472-477.
- Ridgway CJ, Gane PAC (2003) Bulk density measurement and coating porosity calculation for coated paper samples. Nordic Pulp and Paper Research Journal 18(1): 24-31.
- Mohd Hazreek Bin Zainal Abidin, Devapriya Chitral Wijeyesekera, Rosli Saad, Fauziah Ahmad (2013) The influence of soil moisture content and grain size characteristics on its field electrical resistivity. Electronic Journal of Geotechnical Engineering 18: 699-705.
- Danish Kazmi, Sadaf Qasim, Fahad Irfan Siddiqui, Syed Baharom Azhar (2016) Exploring the relationship between moisture content and electrical resistivity for sandy and silty soils. International Journal of Engineering Science Invention 5(7): 42-47.
- Spragg R, Villani C, Snyder K, Bentz D, Bullard JW, et al. (2013) Factors that influence electrical resistivity measurements in cementitious systems. Transportation Research Record: Journal of the Transportation Research Board 2342(1): 90-98.
- Zhou M, Wang J, Cai L, Fan Y, Zheng Z (2015) Laboratory investigations on factors affecting soil electrical resistivity and the measurement. IEEE Transactions on Industry Applications 51(6): 5358-5365.
- Bordenave N, Grelier S, Pichavant F, Coma V (2007) Water and moisture susceptibility of chitosan and paper-based materials: Structure -property relationships. ACS Journal of Agricultural and Food Chemistry 55(23): 9325-9738.
- Fred Lacy (2011) Developing a theoretical relationship between electrical resistivity, temperature, and film thickness for conductors. Nanoscale Research Letters 6(1): 636.
- Yang Mo, Lijun Yang, Fei Yin, Yuanyuan Gao, Ruijin Liao (2022) Development of PPTA/cellulose three-layer composite insulating paper with low dielectric constant and good mechanical strength based on molecular dynamics simulation. Polym Compos 43(3): 1698-1710.
- Xiuyi Lin, Xi Shen, Qingbin Zheng, Nariman Yousefi, Lin Ye, et al. (2012) Fabrication of highly-aligned, conductive, and strong graphene papers using ultralarge graphene oxide sheets. ACS Nano 6(12): 10708-10719.
- Marom H, Eizenberg M (2006) The effect of surface roughness on the resistivity increase in nanometric dimensions. J Appl Phys 99(12): 123705.
- Oyvind Eriksen, Erik Johannesen, Oyvind Weiby Gregersen (2007) The influence of paper surface roughness on ink pigment distribution. Appita: Technology, Innovation, Manufacturing, Environment 60(5): 384-389.
- Petri Ihalainen, Anni Maattanen, Joakim Jarnstrom, Daniel Tobjork, Ronald Osterbacka, et al. (2012) Influence of surface properties of coated papers on printed electronics. ACS Industrial & Engineering Chemistry Research 51: 6025-6036.
- Chih-Chao Yeh (1984) The changes in ink tack and paper picking as effected by ink viscosity. Thesis, Rochester Institute of Technology, RIT Digital Institutional Repository, pp. 1-93.
- Steven F Sawyer (2009) Analysis of variance: The fundamental concepts. Journal of Manual & Manipulative Therapy 17(2): 27E-38E.
- Brett A Goodman, Pieter TJ Johnson (2011) Ecomorphology and disease: Cryptic effects of parasitism on host habitat use, thermoregulation, and predator avoidance. Ecology 92(3): 542-548.
- Patrick Ayako Odede (2025) A multivariate analysis of variance of feed intake, milk, and manure yields of crossbreed dairy cows across different diets. Doctoral dissertation, Maseno University.
- John T Behrens (1997) Principles and procedures of exploratory data analysis. Psychological Methods 2(2): 131-160.
- Naipeng Shi, Saisai Chen, Dong Wang, Tiange Wu, Nieke Zhang, et al. (2024) MDK promotes M2 macrophage polarization to remodel the tumor microenvironment in clear cell renal cell carcinoma. Scientific Reports 14(1): 18254.
- Sankar Ganesh KS, Ashok Kumar T, Vibinesh M (2026) Optimising sample size for normality testing in geotechnical data using power analysis. Machine Learning and Data Science in Geotechnics 2(1): 20-38.
- Tao Zhu, Jian-Guo Zhou, Jin-Qi Hao (2011) Experimental studies on the changes in resistivity and its anisotropy using electrical resistivity tomography. International Journal of Geophysics 2012(1/142069): 1-10.
© 2026 Nan Qu. This is an open access article distributed under the terms of the Creative Commons Attribution License , which permits unrestricted use, distribution, and build upon your work non-commercially.
Editor In Chief


.jpg)


Signup for Newsletter

Quick Links
 Editorial Board Registrations
 Submit your Article
 Refer a Friend
 Advertise With Us
Our Recent Edition

.jpg)


Top Editors


.jpg)


.bmp)
.jpg)
.png)
.jpg)


.jpg)


.png)

.png)


.png)


Financial Support

Sponsors

Latest e-Books

Latest Video

 a Creative Commons Attribution 4.0 International License. Based on a work at www.crimsonpublishers.com.
Best viewed in
a Creative Commons Attribution 4.0 International License. Based on a work at www.crimsonpublishers.com.
Best viewed in