
- About Us
- Information
-

The Author ensures that the research has been conducted responsibly and ethically with adherence to all relevant regulations. read more..
- For Authors
- For Reviewer
- Manuscript Guidelines
- Membership
- Publication Ethics
-
- Journals
- Reprints
- e-Books
- Videos
- Policies
- Contact Us
 COVID-19
- Submissions


Full Text
Annals of Chemical Science Research
Exploring the Relationship Between Copy Paper Properties and Surface Electrical Resistivity
Katerina Chryssou* and Eugenia Lampi
General Chemical State Laboratory, B’ Chemical Division of Athens, Department A’ Tsocha 16, Greece
*Corresponding author:Katerina Chryssou, General Chemical State Laboratory, B’ Chemical Division of Athens, Department A’ Tsocha 16, 11521 Athens, Greece
Submission: December 10, 2025;Published: December 18, 2025

Volume5 Issue3December 18, 2025
Abstract
This study indicates broadly the effects of moisture, and certain associated experimental factors on the electrical surface resistivity of copy papers. Findings were that surface resistivity in Ω/□, slightly increased with increasing paper thickness and that decreased with increasing paper density and increasing paper grammage. The logarithm of the electrical surface resistivity of the copy papers decreased directly as the moisture content increased. The surface resistivity increased with increasing paper ash on ignition (900°) content, which denoted the mineral fillers of the paper. The surface resistivity decreased with increasing tensile strength in the machine direction (MD) and increased with increasing tensile strength in the counter machine direction (CD). The surface electric resistivity decreased with increasing roughness Bendtsen in ml/min and roughness Bendtsen decreased with increasing ash content on ignition. In this work we produced a system capable of calculating the surface resistivity from the electrical resistance measurements. Finally, using this system we compared and analyzed the surface resistivity of eleven insulating copy paper samples. Optimization of the surface electric resistivity value could help produce more eco-friendly copy papers.
Keywords: Copy paper; Electric surface resistance; Surface resistivity; Paper thickness; Paper density; Paper moisture content; Moisture content frequencies table; Ash content on ignition; Paper grammage; Paper tensile strength; Machine direction (MD); Counter machine direction (CD); Paper roughness Bendtsen in ml/min; Electrical resistivity limits for eco-certified copy papers
Introduction
The resistance is clearly the value expected from consideration of ohmic heat loss in a circuit. Lumped circuit concepts such as the resistance and reactance of a two-terminal linear network occur in many applications, even in circumstances where the size of the system is comparable to the free-space wavelength, for example, for a resonant antenna [1].
Electric resistance is generally used as a measure for the electric conductivity, the ease of electric passage, of a substance. When a material with high resistivity is actually to be determined, a constant voltage method is applied where a constant voltage is applied for the measurement of leak current, because it is difficult to supply a steady flow of a small current. Also, since a material has different conditions on the surface and inside, it often becomes necessary to use the material by adopting respective indices. Surface resistivity represents a value determined along the surface direction. As a measure for electric conductivity of a material on its surface and the vicinity, the surface resistivity is used, its unit being expressed in Ω/□ (ohm per square) [2].
The electrical properties of paper, a hygroscopic material, play an important role in electrophotographic printing [3]. Toner transfer efficiency depends on paper resistivity. The toner is transferred to the paper from an intermediate belt or drum by an electric field [3]. Also, paper resistivity is related to the paper handling by the printer. If the resistivity is too high then problems with paper feeding by the printer arise, due to static electricity [3]. It is pointed out that the surface resistivity range accepted and usually adopted in the paper industry is 1010-1012Ω [3].
Electrical resistivity surveys can provide a non-destructive and less expensive way of assessing paper properties, if reliable correlations could be established through extensive testing [4]. Paper has a complex, non-uniform structure, the complexity of which cannot be taken fully into account in a relatively simple continuum model [5]. Conduction in paper is assumed to be ionic and the mobility of these ions is dependent on the moisture content of paper, so there is normally a density of free charges in paper [5]. Also, since the dielectric properties of paper depend on the frequency and moisture, the time available may be insufficient for a complete dielectric orientation, during toner transfer, at least in the fastest color printers [5]. A static one-dimensional model approximation could best be used to describe a paper with a minimum concentration of ions (salts) in a sufficiently slow toner transfer process, then a continuum model [2]. Also, the applicability of paper as flexible substrate in printed electronics has been attracting continuing interest for several years, since paper is a lowcost, easily available and biologically degradable material [6].
The surface electric resistance is generally sensitive to mineral additives, fiber chemistry, moisture and surface treatments, which may have sustainability implications. The study of mechanical tensile strength, and paper roughness Bendtsen versus surface resistance, and the additives content could help replace and or, reduce environmentally harmful mineral additives and thus improve environmental quality [7].
Materials and Methods
Instruments and materials
The paper test sheets sampled from the eleven copy paper packets were selected in accordance with ISO 186 standard [8]. All eleven copy paper samples were made of chemical pulp (cellulose). They did not contain mechanical pulp. Conditioning of all paper samples was in accordance with ISO 187 standard [9]. A conditioning chamber was used that was capable of providing and maintaining standard conditions of temperature and humidity, where the paper test pieces were pre-conditioned at 23 °C ± 2 °C and 30%r.h.±5%r.h. and were conditioned at (23±1) °C and (50±2)%r.h. [9]. The standard atmosphere for preparing, and testing the copy paper samples was (23±1) °C and (50±2)%RH.
The surface resistance measurement setup comprised the resistance meter Hiresta-UP Mitsubishi Chemical Corporation Tokyo Japan, model no. MCP-HT450, and a concentric ring probe electrode URS MCP-HTP14, with diameters d1=0.59cm and d2=1.1cm. The resistivity meter carried out measurements for various shapes of samples in the measurement range 104- 1013Ω. Also, because the paper samples were thin, we used a Teflon (PTFE), polytetrafluoroethylene, coated surface for stable measurements, where the probe electrode was placed on the samples. The instrument was calibrated before measurement with a probe checker MCP-TRURS, a standard resistance of 5.04x10⁸Ω. All surface resistances in Ω were measured in accordance with IEC Standard 93 [10], using a test voltage of 500V, and a charge time of 30s, with ten replicate measurements for the copy paper samples [5]. A device for cutting the paper test pieces, to the dimensions required, was used i.e. a guillotine IDEAL 1043, made in Germany. The paper test pieces were of dimensions 10cmx10cm each, and the surface resistance was measured for each one sheet of the pack of ten (10) paper test pieces, on the center, each time. Ten paper test specimens were measured separately for all eleven copy paper samples.
The grammage of the paper samples was determined according to ISO 536 standard [11]. Ten test pieces of an area of 50,000mm2 (200mmx250mm) were cut, using the guillotine, for all copy paper samples. The grammage, g, was calculated using the equation (1):
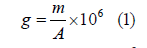
where m was the mass, in grams, of the ten test pieces of 20cmx25cm dimension, and A was the area in mm2, 50,000mm2, of the test pieces. The determination of grammage was based on the paper material in the condition pertaining at the time of sampling from the packet of each copy paper.
The determination of thickness of the copy paper samples was performed according to ISO 534 standard [12]. A deadweight digital precision micrometer, TMI, Model No 49-61-01- 0002, S.N.33421-01, with range 0-1.270mm, incorporating two plane, parallel, circular pressure faces, between which the paper test pieces were placed for measurement. The pressure exerted between the pressure faces during the thickness measurement was 100kPa. Conditioning of the paper samples was in accordance with ISO 187 standard [9]. The standard atmosphere for testing the copy paper samples was (23±1) °C and (50±2)%RH. The specimens of all samples were held such that the conditioning air had free access to all their surfaces so that their moisture contents attained a state of equilibrium with the water vapour in the atmosphere [9]. A conditioning period time of 8h to 16h was applied, with good air circulation [9]. All the sheets of the copy paper samples selected, were selected at random, from the packet of each photocopy paper [8]. Further subdivision and combination of these sheets provided the paper specimens of each sample from which the test pieces were taken, according to ISO 186 standard [8]. Twenty (20) test pieces were prepared, using the guillotine, with dimensions 10cmx10cm, taken at random from each sample, so that the micrometer reading was not affected by the test piece mass that overhanged the lower pressure face of the micrometer while the measurement was being made. The determination of single sheet thickness was carried out in the standard atmospheric conditions in which the sample specimens were conditioned and prepared according to ISO 187 standard [9]. Only one measurement was made on the center of each test piece of the two packs of ten specimens, for every copy paper sample tested. We calculated the mean value of 20 readings made, and expressed the result in micrometres, for all eleven copy papers. The mean apparent sheet density, ds, in grams per cubic centimeter was calculated according to equation (2):
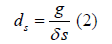
where g was the grammage, in grams per square metre, of the copy paper sample, and δs was the mean single sheet thickness, in micrometres, of each copy paper sample.
The determination of ash content on ignition at 900 °C was determined according to ISO 2144 standard [13]. The specimen for incineration had a total mass of 1g on an oven-dry basis, and the procedure was carried out in duplicate [13]. The crucibles with the samples were exposed to the full heat (900 °C ± 25 °C) of the furnace for 1h. The crucibles with the ash content were removed from the furnace and they were allowed to attain room temperature in the desiccator for 3h. The crucibles and contents were weighed to 0.1mg. Crucibles of porcelain of capacity 50ml were used. A muffle furnace Carbolite England OAF 11/1, S/N 9/99/2080, with max temperature 1100 °C, was used for maintaining a temperature of 900 °C ± 25 °C, placed in a hood. The electronic balance Sartorius Basicplus, AG Göttingen Germany BP 221S, with maximum capacity 220g, precision of four decimal places, with accuracy of 0.1mg, was used. A glass desiccator, with a plate from porcelain with holes, and with CaCl2 as desiccant, was used for the transferring the porcelain dishes with the ash content. For each crucible we calculated the ash content on ignition using the formula (3):
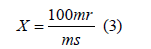
where X was the ash content, as a percentage of the mass of the test specimen on an oven-dry basis, mr was the mass of the residue (the mass of the crucible with the residue, minus that of the empty crucible) in g, ms was the mass of the test specimen, on an oven-dry basis, in g.
The determination of the moisture content of the packet of each copy paper sample was determined according to ISO 287 standard [14] and ISO 638-1 standard [15], by the oven-drying method. The procedure was carried out in duplicate. The moisture content wH2O was the content of water in the paper, i.e. the ratio of the loss of mass of a test piece, when dried under specified conditions, to its mass at the time of sampling. At the time of sampling the paper test sheets were taken from the packet of each copy paper, were cut to dimensions 50mmx210mm with the use of scissors and were weighed and the same test pieces were weighed again after drying to constant mass. The constant mass was the mass reached by the paper test pieces after drying at a temperature of (105±2) °C until the difference between two successive dryings and weighing’s, separated in time by at least half the initial drying period, did not exceed 0.1% of the initial mass of the test pieces at the time of sampling. The drying period was 24h, in an oven Memmert, capable of being controlled at 105 °C ± 2 °C. Plastic gloves were worn when we handled the paper samples. The moisture content wH2O was expressed as a percentage mass fraction, according to formula (4):

where mo was the mass of the test piece at the time of sampling in g, m1 was the mass of the test piece after drying to constant mass in g. For each copy paper packet we calculated the mean moisture content, expressed as a percentage rounded to the nearest 0.1% [15].
The tensile strength of the eleven copy paper samples was determined according to ISO 1924-2 [16]. A tensile machine Zwick-Roell Z.2.5 with a 2.5kN load cell was used, and the paper test specimens’ strips of dimensions 15mmx210mm, were preconditioned and conditioned according to ISO 187 standard [9], before and during the testing. The tensile strength was determined across the machine direction (MD) and across the counter machine direction (CD), for all eleven copy papers.
The roughness Bendtsen of the copy paper samples was measured according to ISO 8791-2 [17]. The pressure difference, i.e. the test pressure, was 1.47kPa in the Bendtsen apparatus, which was a Roughness and Air Permeance Tester Bendtsen Method Model No. K513, Messmer Buchel Holland, S.N.:8008-01, 220V, 50Hz. Ten paper test pieces were measured, of dimensions 100mmx100mm, previously cut in the guillotine IDEAL 1043 GS. Those paper test pieces were conditioned during testing according to ISO 187 standard. The values of roughness Bendtsen in Table 2 were the mean value of the two measurements, of the two sides of paper, of each photocopy paper tested.
Results and Discussion
The electric resistivity of any dielectric material depended on environmental factors. For that reason, we conditioned the eleven paper test samples before the measurement of electric surface resistance (R), since the electric resistivity can change with humidity and temperature. We also conditioned the eleven paper test samples before the measurement of their grammage, and thickness at 23 °C± 1 °C and 50±2% relative humidity.
The surface resistivity (ρsurface) was derived from the formula as follows:

whereas (R): resistance (Ω) and RCF(s): surface resistivity
correction factor, with no units, for the URS probe type. The
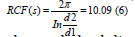 (for surface, with no units). The URS probe
electrode had diameters d2=1.1cm, and d1=0.59cm.
(for surface, with no units). The URS probe
electrode had diameters d2=1.1cm, and d1=0.59cm.
The accuracy of the determination of the surface resistances was ±10% for the resistances of approximately 1010Ω [10].
The ρsurface resistivity in Ω/□ of the eleven copy papers (Table 1) was measured with 500V DC voltage applied to the electrodes. After the voltage was applied the surface resistivity changed and it reached a constant value after 30s. This value was considered to be the true resistivity value. A similar time dependence was observed for all eleven papers investigated [3].
From Figure 1 we could deduce that the surface resistivity slightly increased with increasing paper thickness, relating to number of its cellulose fibers.
Figure 1: Surface resistivity versus paper thickness of 500V applied voltage, of eleven copy paper samples (Table 1).

Figure 2: Surface resistivity versus paper density of 500V applied voltage, of eleven copy paper samples (Table 1).

From Figure 3 we could conclude that the surface resistivity decreased with increasing paper moisture, related to the content of water in paper (Table 1).
Figure 3:Surface resistivity versus paper Moisture(%w/w) of 500V applied voltage, of eleven copy paper samples (Table 1).

In Figure 4 the equation of the trend line was log10(surface resistivity) =11.301-0.8048log10(Moisture). The constant A=11.301 varied, in agreement with previous findings, from 9.1 to 14.4 depending on the source of the cellulosic material [19]. In this study we reported a linear relationship between logarithm of resistivity and logarithm of moisture content, up to 4.7%w/w moisture content (Table 1), (Figure 3) [19].
Figure 4:log(Surface resistivity) versus log(Moisture) of 500V applied voltage, of eleven copy paper samples (Table 1).

From Figures 3-5, we could deduce that the surface resistivity decreased linearly with increasing paper moisture content (%w/w) [20]. Surface resistivities of the copy papers decreased exponentially with increasing moisture content, which was in agreement with previous findings (Table 1), (Figure 5) [5,19].
Figure 5:ln (Surface resistivity) versus ln (Moisture) of 500V applied voltage, of eleven copy paper samples (Table 1).

Table 1:Properties of eleven copy paper samples that were the trial papers of the study.

Figure 6:Frequency diagram of moisture content of the copy paper samples tested (Table 1 & 3).

We then had performed, in SPSS, the statistical procedure Frequencies (Table 3, Figure 6).
From Frequencies Table 3 we had the column frequency which showed the number of observations in each moisture content class, the columns percent and valid percent which showed the relative distribution of moisture, and also the cumulative percent which showed how the moisture content data accumulated across classes of moisture content. The Table 3 showed the distribution of moisture content of the copy paper samples tested (Table 1) [21].
From Figure 6 we could observe the distribution of moisture content of the eleven copy paper samples whose surface electric resistivity was measured in this study (Table 1 & Table 3). Of course, the Frequencies Table and the bar chart (Figure 6), were still a univariate analysis, but for the parameter that affected the surface electric resistivity the most, among other properties of the eleven trial copy papers in Table 1& 2. The histogram in Figure 6 was a graph plotting the moisture content values of observations on the horizontal axis, with the bars showing how many times each moisture content value occurred in the data set (Table 1) [21].
Table 2:The properties of tensile strength and roughness Bendtsen added in Table 1, of the eleven copy paper samples that were the trial papers of the study.

Table 3:Table of the results of the statistical procedure Frequencies in SPSS, of the percentage of moisture content (%w/w) (105 °C) in the eleven photocopy papers, whose the surface electrical resistivity was measured (Table 1).

Figure 7:Surface resistivity versus paper Moisture(%w/w) of 500V applied voltage, of eleven copy paper samples (Table 1).

From Figure 7 we could deduce that the surface resistivity increased with increasing paper ash on ignition (%w/w) (900 °C), (Table 1). The ash content on ignition was denoting the amount of mineral fillers which usually are precipitated calcium carbonate, or clay, or a combination of both [22]. The mineral fillers had higher conductivity compared to cellulose fibers [22].
From Figure 8 we could deduce that the surface resistivity decreased with increasing paper grammage (g/m2) [5]. The grammage was directly related to the fiber content and fillers of the copy papers. The grammage was also related on how evenly the cellulosic fibers and fillers were distributed in the copy paper samples.
Figure 8:Surface resistivity versus paper grammage (g/m2) of 500V applied voltage, of eleven copy paper samples (Table 1).

Figure 9:Surface resistivity versus paper tensile strength in (kN/m) in the Machine Direction (MD), of 500V applied voltage, of eleven copy paper samples (Table 2).

From Figure 9 we could deduce that the surface resistivity decreased with increasing paper tensile strength (kN/m) in the Machine Direction (Table 2). The tensile strength was directly related to the high length of the fibers of the paper in the machine direction (MD) and the presence of cellulose, as well as the strength additives (fillers) of the paper [23].
From Figure 10 we could deduce that the surface resistivity increased with increasing paper tensile strength (kN/m) in the Cross Direction (CD) (Table 2). The tensile strength in the CD was directly related to the short length of the fibers of the paper in the cross direction (CD), or even the absence of many cellulose fibers, as well as the small percentage, or the absence of strength additives (fillers) of the paper, and thus more space (void content) for the flow of current [3,24]. The changes in material structure like altered grain boundaries ((MD) and (CD) direction), significantly affected the electrical resistivity in the Machine Direction (MD) as to the counter machine direction (CD), since paper is a highly anisotropic material [25].
Figure 10:Surface resistivity versus paper tensile strength in (kN/m) in the Cross-machine Direction (CD) of 500V applied voltage, of eleven copy paper samples (Table 2) [3].

Figure 11:Surface resistivity versus paper roughness Bendtsen in ml/min, of 500V applied voltage, of eleven copy paper samples (Table 2), [26,27].

From Figure 11 we could deduce that the surface resistivity decreased with increasing paper roughness Bendtsen (ml/min) (Table 2) [25,26]. The higher the value of the roughness Bendtsen was indicating a rougher paper surface which provided more “valleys”, and peaks and a greater effective surface area where the conductive material could accumulate and form a thicker conductive path and or, could enhance mechanical interlocking within the fibrous structure. That could result in a larger effective cross-sectional area for current flow along the printed trace, which could have led to lower electrical resistance and thus lower resistivity for the paper coated layer [26].
From Figure 12 we could deduce that the tensile strength across the MD in kN/m decreased with increasing ash content (Table 2). The inverse linear correlation observed was that as the percentage of inorganic additive increased the tensile strength across the machine direction decreased in a relatively linear fashion. The inorganic additive, such as calcium carbonate, was used to make paper brighter and smoother, but also interrupted the natural fiberto- fiber bonding that gave paper strength. The more the inorganic additive the fewer the bonds between the cellulose fibers and the weaker the sheet of the copy paper [27].
Figure 12:Tensile strength across MD in (kN/m) versus ash on ignition content (900 °C) (%w/w) of eleven copy paper samples (Table 2).

Figure 13:Tensile strength across CD in (kN/m) versus ash on ignition content (900 °C) (%w/w) of eleven copy paper samples (Table 2).

From Figure 13 we could deduce that the tensile strength across the CD in kN/m increased with increasing ash content (Table 2). Paper exhibited here anisotropy, meaning that its tensile strength depended on the direction of measurement. The linear correlation implied that as the filler content increased the tensile strength changed proportionally in the counter machine orientation. This specific relationship between the inorganic filler and the tensile strength in the counter machine direction could be used for quality control, and paper making process optimization, as it would help find an optimal balance between amount of mineral additives, which enhance opacity and mechanical durability of copy paper which is increased by fillers. This finding could also help reduce environmentally harmful mineral additives, or replace them with others with lower toxicity. From Figure 7 we deduced that the surface resistivity increased with increasing paper ash on ignition (%w/w) (900 °C), (Table 1). The ash content on ignition, denoting the mineral fillers, which had higher conductivity than the cellulose fibers and finding its optimum amount, could help optimize also the surface electric resistivity, and thus reduce printer toner waste [25].
From Figure 14 we could deduce that there existed an inverse linear relationship between ash content and Bendtsen roughness which is explained by the role of inorganic fillers in the copy paper structure (Table 2). A smoother surface related with higher ash content had fewer and smaller gaps, restricting airflow and resulting in a lower Bendtsen value, which indicated lower roughness value (ml/min) [28]. The Bendtsen roughness in ml/min, decreased with ash content on ignition, while the ρsurface resistivity increased with the ash content (%w/w) (900 °C). Since the mineral coating, i.e. ash on ignition content, could alter the surface electric resistivity we could optimize the mineral coating content for higher recycling yield and thus we could correlate surface electrical resistivity with recycling efficiency, as well as reduce heavy metal waste.
Figure 14:Relation of ash on ignition content in %w/w (900 °C) to surface roughness Bendtsen in ml/min, of eleven copy paper samples (Table 2).

The accuracy of the measurement of the electric ρsurface resistivity of the eleven copy paper samples depended upon the effect of a number of factors associated with the test, namely, the amount of pressure applied and the type of contact between the electrode probe and the paper, the dimensions of the paper specimens i.e.10cmx10cm, the extend of specimens beyond the electrode probe surface, the direction of flow of current through the paper (parallel or perpendicular to the paper fibers), the density of the paper, the temperature, the ash content, the distribution of the moisture content in the specimens, the grammage of the specimens and the presence of moisture on the paper surface parallel to the flow of current. Also, the electric surface resistivity related on the tensile strength of the copy papers examined and the measurement of the roughness Bendtsen. All these factors, as well as the fundamental relationship between resistance and moisture content were therefore examined in the experiments described above [20]. These factors and their interelations could influence industry-wide sustainability practices. Limits could be proposed for surface electric resistivity to produce eco-certified copy papers.
Conclusion
This work was intended to provide electric surface resistivity data on a set of eleven commercially available copier paper samples. The range of resistivities we have measured, i.e. 109-1011, agreed with those found in the literature [3]. Copy paper usually has high amounts of fillers and fibers that are usually less reactive to moisture than other grades of paper. It could be generally considered as a three-phase composite [22]. Therefore, the electric surface resistivity depended more on the ash on ignition (filler contents) [29] and sheet density (nature of fibers), and moisture (water content). Finally, copy papers could be designed whose surface electric resistivity adapted naturally to ambient humidity, and thus their moisture content enabled them to have better performance across different geographical areas.
References
- John David Jackson (1998) Classical electrodynamics, Chapter 6, John Wiley & Sons, Inc. Third Edition (1998), Printed in USA, pp. 237-294.
- Heon-Gyeong Lee, Jin-Gyu Kim (2020) Volume and surface resistivity measurement of insulating materials using guard-ring terminal electrodes. Energies 13(11): 2811.
- Sirvio P, Backfolk K, Maldzius R, Sidaravicius J, Montrimas E (2008) Dependence of paper surface and volume resistivity on electric field strength. J Imaging Sci Technol 52(3): 030501-1 – 030501-8.
- Danish Kazmi, Sadaf Qasim, Fahad Irfan Siddiqui, Syed Baharom Azhar (2016) Exploring the relationship between moisture content and electrical resistivity for sandy and silty soils. International Journal of Engineering Science Invention 5(7): 42-47.
- Petri Sirvio, Kaj Backfolk (2008) Effect of roughness of low-grammage coated papers on print quality in color electro-photography. J Imaging Sci Technol 52(1): 010505-1-010505-9.
- Johanna Zikulnig, Ali Roshanghias, Lukas Rauter, Christina Hirschl (2020) Evaluation of the sheet resistance of inkjet-printed ag-layers on flexible, uncoated paper substrates using van-der-Pauw’s method. Sensors 20(8): 2398.
- Ginebreda A, Guillen D, Barcelo D, Darbra RM (2011) Additives in the paper industry. Global risk-based management of chemical additives I: Production, Usage and Environmental Occurrence. Berlin, Heidelberg: Springer Berlin Heidelberg, pp.11-34.
- International Standard ISO 186 (2002) Paper and board-Sampling to determine average quality, pp. 1-9.
- International Standard ISO 187 (2022) Paper, board and pulps-Standard atmosphere for conditioning and testing and procedure for monitoring the atmosphere and conditioning of samples, pp. 1-7.
- International Electrochemical Commision, IEC Standard Publication 93, IEC 60093 (1980) Methods of test for volume resistivity and surface resistivity of solid electrical insulating materials, Second edition, pp. 1-39.
- International Standard ISO 536 (2012) Paper and board-Determination of grammage, pp. 1-6.
- International Standard ISO 534 (2011) Paper and board-Determination of thickness, density and specific volume, pp. 1-13.
- International Standard ISO 2144 (2019) Paper, board, pulps and cellulose nanomaterials-Determination of residue (ash content) on ignition at 900 °C, pp. 1-10.
- International Standard ISO 287 (2017) Paper and board-Determination of moisture content of a lot-Oven-drying method, pp. 1-10.
- International Standard ISO 638-1 (2022) Paper, board, pulps and cellulosic nanomaterials-Determination of dry matter content by oven-drying method-Part 1: Materials in solid form, pp. 1-10.
- International Standard ISO 1924-2 (2008) Paper and board -Determination of tensile properties-Part 2: Constant rate of elongation method (20mm/min), pp. 1-12.
- International Standard ISO 8791-2 (2013) Paper and board-Determination of roughness/smoothness (air leak methods)-Part 2, pp. 1-16.
- William A Maryniak, Toshio Uehara, Maciej A Noras (2020) Surface resistivity and surface resistance measurements using a concentric ring probe technique. Adv Energy, pp. 1-4.
- Okoh Isaac Kwame Ayisi, ProQuest Dissertations & Theses (1976) Moisture sorption and electrical resistivity of some woods and barks, state university of New York College of Environmental Science and Forestry, pp. 1-199.
- Alfred J Stamm (1927) The electrical resistance of wood as a measure of its moisture content. Ind Eng Chem 19(9): 1021-1025.
- Andy Field (2009) Discovering statistics using SPSS, Third Edition, pp.1-854.
- Sergiy A Lavrykov, Ramarao BV (2012) Thermal properties of copy paper sheets. Dry Technol 30(3): 297-311.
- Jinsong Zeng, Zhanting Zeng, Zheng Cheng, Yu Wang, Xiaojun Wang, et al. (2021) Cellulose nanofibrils manufactured by various methods with application as paper strength additives. Sci Rep 11(1): 11918.
- Petri Ihalainen, Anni Maattanen, Joakim Jarnstrom, Daniel Tobjork, Ronald Osterbacka, et al. (2012) Influence of surface properties of coated papers on printed electronics. Ind Eng Chem Res 51(17): 6025-6036.
- Eric Hatfield (2016) 11-Machine direction-oriented film technology. In: John R Wagner (Ed.), In Plastics Design Library, (Second Edition) William Andrew Publishing, pp. 147-152.
- Alan Ryan, Huw Lewis (2012) Effect of surface roughness on paper substrate circuit board. IEEE transactions on components, packaging and manufacturing technology 2(7): 1202-1208.
- Prasetya HA, Marlina P, Rahmaniar, Sugiyono B, Danimasthari F, et al. (2022) The effect of silica filler quartz sand from tailing processing of mining material on mechanical properties, thermal aging and morphology rubber compound. International Bioprocessing Association Subject Conference. IOP Conf Ser: Earth Environ Sci 963: 012030.
- Byoung-Uk Cho, Gil Garnier (2000) Effect of the paper structure and composition on the surface sizing pick-up. TAPPI Journal, pp. 1-18.
- Shivakumar KN, Kenchappa B, Imran KA (2024) Mechanical, fire, and electrical insulation properties of polyurethane fly ash composites. Polym 16(11): 1507.
© 2025 Katerina Chryssou. This is an open access article distributed under the terms of the Creative Commons Attribution License , which permits unrestricted use, distribution, and build upon your work non-commercially.
Editor In Chief


.jpg)


Signup for Newsletter

Quick Links
 Editorial Board Registrations
 Submit your Article
 Refer a Friend
 Advertise With Us
Our Recent Edition

.jpg)


Top Editors


.jpg)


.bmp)
.jpg)
.png)
.jpg)


.jpg)


.png)

.png)


.png)


Financial Support

Sponsors

Latest e-Books

Latest Video

 a Creative Commons Attribution 4.0 International License. Based on a work at www.crimsonpublishers.com.
Best viewed in
a Creative Commons Attribution 4.0 International License. Based on a work at www.crimsonpublishers.com.
Best viewed in