
- About Us
- Information
-

The Author ensures that the research has been conducted responsibly and ethically with adherence to all relevant regulations. read more..
- For Authors
- For Reviewer
- Manuscript Guidelines
- Membership
- Publication Ethics
-
- Journals
- Reprints
- e-Books
- Videos
- Policies
- Contact Us
 COVID-19
- Submissions


Full Text
Research & Development in Material Science
Main Temperature Dependent Parameters of the Exponential Absorption Spectrum of a-Si: H
Ikramov RG, Nuriddinova MA, Muminov KhA*, Umarov SS and Sultonov BQ
Namangan State Technical University, Uzbekistan
*Corresponding author:Muminov KhA, Namangan State Technical University, 12, Yangi Namangan, Namangan 160115, Uzbekistan
Submission: October 24, 2025;Published: October 31, 2025

ISSN: 2576-8840 Volume 22 Issue 3
Abstract
In this work, the temperature dependence of the key parameters determining the exponential optical absorption coefficient spectra of hydrogenated amorphous silicon (a-Si: H) has been investigated. The study is based on both experimentally obtained values and the results derived from theoretical calculations of the exponential absorption spectrum. Using these results, the temperature dependence of the main parameters governing the exponential absorption spectrum of a-Si: H has been analyzed.
Keywords:Hydrogenated amorphous silicon (a-Si: H); Exponential optical absorption coefficient spectra; Temperature; Energy width of the mobility gap; Parameters determining the curvature of the exponential tails of the valence and conduction bands
Literature Survey
In the work [1], experimentally determined values of the temperature dependence of the spectra of interband and exponential optical absorption coefficients of amorphous hydrogenated silicon (a-Si: H) are presented (Figure 1). The same figure shows the experimentally determined values of the temperature dependence of the spectra of the interband and exponential optical absorption coefficients for a-Si: H films obtained using the same technology but subjected to annealing for 30 minutes in the temperature range of 400-600 ℃. It is shown that the Urbach focus for exponential absorption spectra is located at the point Eg≈2.2eV and α≈1.5*106sm-1.
Figure 1:Temperature dependence of experimentally determined interband and exponential absorption spectra of unannealed and annealed a-Si: H in [1].

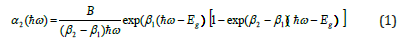
In work [2], the following expression was obtained for the exponential absorption spectrum using the theoretical method of the Davis-Mott approximation from the Kubo-Greenwood formula:
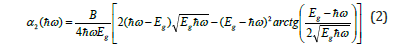
In work [3], the following expression was obtained for the interband absorption spectrum using a theoretical method based on the Davis-Mott approximation from the Kubo-Greenwood formula:
In formulas (1) and (2), 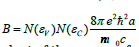 is the
proportionality coefficient independent of the energy of absorbed
photons, where N(ɛV) and N(ɛC) are the effective values of the
density of electron states in the valence band and conduction
band, respectively, e is the electron charge, m is the effective
mass of electrons in the allowed bands, n0 is the refractive index
of amorphous hydrogenated silicon, c is the speed of light, a is the
a-Si: H average distance between atoms, Eg is the energy width of
the a-Si: H mobility gap, β1 and β2 are the parameters determining
the curvature of the exponential tails of the valence band and
conduction band, respectively. The symbol (*) in this table denotes
annealed samples.
is the
proportionality coefficient independent of the energy of absorbed
photons, where N(ɛV) and N(ɛC) are the effective values of the
density of electron states in the valence band and conduction
band, respectively, e is the electron charge, m is the effective
mass of electrons in the allowed bands, n0 is the refractive index
of amorphous hydrogenated silicon, c is the speed of light, a is the
a-Si: H average distance between atoms, Eg is the energy width of
the a-Si: H mobility gap, β1 and β2 are the parameters determining
the curvature of the exponential tails of the valence band and
conduction band, respectively. The symbol (*) in this table denotes
annealed samples.
Results and Discussion
To calculate the interband absorption spectrum from expression (2), it is necessary to determine the parameters B and Eg in this formula. Considering B and Eg in formula (2) as fitting parameters, we fit the calculated results obtained from this formula to the experimental data taken for the interband absorption spectrum, presented in Figure 1. The agreement between the experimental and calculated results from formula (2) (Figure 2, lines) for B and Eg is presented in Table 1.
Figure 2:Temperature dependence of the interband absorption spectrum. Points are the experiment, lines are the results obtained from formula (2). Not annealed a-Si: H, 1-T=12.7K, 2-T=151K, 3- T-293K, Annealed a-Si: H 4-T=773K, 5-T=798K, 6-T=823K, 7-T= 848K, 8-T=873K, 9-T=898K.

To determine the values of β1 and β2, which are considered as fitting parameters, in formula (1), the values for B and Eg are obtained from Table 1, the obtained results of fitting to the experimental data are presented in Figure 3, and the values of β1 and β2 in Table 2. Figures 4 & 5 show the dependences of β₁ and β₂ on temperature for unannealed and annealed a-Si: H samples.
Table 1:

Table 2:

Figure 3:Temperature dependence of the exponential absorption spectrum. Points are the experiment, lines are the results of calculations using formula (1). The square point is the Urbach focus. Not annealed a-Si: H, 1-T=12.7K, 2-T=151K, 3- T=293K, Annealed a-Si: H 4-T=773K, 5-T=798K, 6-T=823K, 7-T= 848K, 8-T=873K.

Figure 4:Temperature dependence of the parameters determining the curvature of the exponential tails of the conduction and valence bands of unannealed a-Si: H: 1 - β2 for the tail of the conduction band; 2 - β1 for the valence band.

Figure 5:Temperature dependence of the parameters determining the curvature of the exponential tails of the conduction and valence bands of annealed a-Si: H: 1 - β2 for the tail of the conduction band; 2 - β1 for the valence band.

The determined values of these parameters are presented in Table 2.
The table shows that with increasing temperature, the exponential tails of the valence and conduction bands increase. After annealing the a-Si: H samples, the exponential tails of the valence and conduction bands also continue to increase. Moreover, for newly fabricated a-Si: H samples, the β₁ and β₂ values are strongly correlated at low temperatures. As the temperature increases, this dependence weakens. During annealing of the a-Si: H samples, the β1 and β2 values increase.
Conclusion
Thus, in this work, the temperature dependence of the main parameters that determine the optical absorption spectra of amorphous hydrogenated silicon was studied using a theoretical method. It was found that the exponential tails of the valence and conduction bands increase with increasing temperature. It was also found that the exponential tails of the valence and conduction bands of annealed a-Si: H samples increase with increasing temperature.
It was shown that the β1 and β2 values in unannealed a-Si: H samples exhibit a strong dependence at low temperatures. This dependence was shown to weaken as temperature increases. The Urbach focus for annealed and unannealed a-Si: H samples were found to be at Eg = 2.2eV and α = 1.5×10⁶sm-1. Annealing of a-Si: H samples lead to an increase in the β1 and β2 values.
References
- Cody GD, Tiedje T, Abeles B, Brooks B, Goldestein Y (1981) Disorder and the optical-absorption edge of hydrogenated amorphous silicon. Physical Review Letters 47(20): 1480-1483.
- Zainobidinov S, Ikramov RG, Zhalalov RM (2011) Urbach energy and tails of the density of states of amorphous semiconductors. Journal of Applied Spectroscopy 78(2): 223-227.
- Zainobidinov S, Ikramov RG, Zhalalov RM, Nuritdinova MA (2011) Distribution of electron density of states in allowed bands and interband absorption in amorphous semiconductors. Optics and Spectroscopy 110(5): 762-766.
© 2025 © Muminov KhA. This is an open access article distributed under the terms of the Creative Commons Attribution License , which permits unrestricted use, distribution, and build upon your work non-commercially.
Editor In Chief


.jpg)


Signup for Newsletter

Quick Links
 Editorial Board Registrations
 Submit your Article
 Refer a Friend
 Advertise With Us
Our Recent Edition

.jpg)


Top Editors


.jpg)


.bmp)
.jpg)
.png)
.jpg)


.jpg)


.png)

.png)


.png)


Financial Support

Sponsors

Latest e-Books

Latest Video

 a Creative Commons Attribution 4.0 International License. Based on a work at www.crimsonpublishers.com.
Best viewed in
a Creative Commons Attribution 4.0 International License. Based on a work at www.crimsonpublishers.com.
Best viewed in