
- About Us
- Information
-

The Author ensures that the research has been conducted responsibly and ethically with adherence to all relevant regulations. read more..
- For Authors
- For Reviewer
- Manuscript Guidelines
- Membership
- Publication Ethics
-
- Journals
- Reprints
- e-Books
- Videos
- Policies
- Contact Us
 COVID-19
- Submissions


Full Text
Peer Review Journal of Solar & Photoenergy Systems
Experimental Evaluation and Numerical Modeling of Solar Panels Performance under Concentrated Sunlight
Alemrajabi AA1*, Badri MA2 and Zamani B3
1Emeritus Professor, Department of Mechanical Engineering, Iran
2Associate professor, Research Institute for Subsea Science & Technology, Iran
3Department of Mechanical Engineering, Iran
*Corresponding author: Alemrajabi AA, Emeritus Professor, Department of Mechanical Engineering, Isfahan University of Technology, Isfahan, Iran
Submission: November 25, 2021;Published: April 19, 2022

Volume2 Issue1 April, 2022
Abstract
During the last three decades, renewable energies have been under consideration for replacing fossil fuels. The main obstacle in doing so is the relatively higher price for renewable energies. Solar energy is the major source of renewables. The main problem with solar energy is its low intensity, especially when photovoltaics is considered. To increase the specific power and hence decrease the cost of the power output of photovoltaics, concentrating systems may be used. Systems with concentrating ratio of less than 10 are of great importance due to the usage of normal monocrystal solar cells with no complicated cooling systems. In the present research, the performance of a monocrystal photovoltaic panel under concentrated sunlight was both experimentally and numerically investigated. A two-diode model was devised and validated by experimental data. Then variations in open circuit voltage, short circuit current, and output power were simulated with changes in radiation intensity and panel temperature. The simulation results resemble the experimental results very well. In the experiments, concentrating sunlight was achieved by flat mirrors. Effects of change in radiation intensity and cell temperature are reported. By using the concentrating system, the power output of the solar panel was increased up to 1.9 times under standard conditions.
Keywords:Solar cell; Photovoltaic panel; Concentrator; Two-diode model
Introduction
Though the photovoltaic effect has been known for almost two centuries, its practical application began in the late 1950s in satellites and space travel. During the energy crisis of the 1970s, photovoltaic technology was recognized as a potential source of energy for non-space applications [1-3]; but the price of silicon solar cells was very high. To solve this problem, two main ideas were proposed, the first was to make cheap modules using thin film and the other way was to use concentration [2,4].
Concentration is divided into three categories according to the concentration ratio, the low concentration category with a concentration ratio lower than 10, the medium category with a concentration ratio of 10 to 100, and the high concentration with a concentration ratio of above 100. Conventional monocrystalline silicon cells and panels can be used in systems with low concentration ratios. These cells are more efficient than polycrystalline cells, so it is economical to focus on them. On the other hand, multi-link cells are more efficient but still expensive, so they are mostly used in the aerospace industry and systems with high concentration ratios. Low-concentration solar cells do not require advanced cooling and are now more widely used due to the simplicity of the design of low-concentrations in these systems.
In the present research, in addition to laboratory work, modeling of solar cell performance has been performed in which the parameters of radiation intensity and temperature are received as input, and current-voltage and power-voltage diagrams are drawn in the desired conditions.
Modeling
Modeling of solar cells and modules is required to design and evaluate the performance of photovoltaic systems. In modeling these systems, the physical parameters are calculated using the values measured by the manufacturers, which are available on the module specifications page. This information includes short circuit current, open-circuit voltage, maximum power, voltage and current at maximum power, module efficiency, and temperature coefficients. These values are determined at a reference temperature of 25°C for module operation and under air-mass (AM) conditions of 1.5 with 1000 watts per square meter of solar radiation [5]. The solar cell can be modeled as a current source parallel to a diode, known as the Ideal model, single-diode model, and two-diode model. In the following, only the two-diode model is developed but some results for the other two models are also presented.
Figure 1:Equivalent circuit of a solar cell (two-diode model).

The current source produces the IPH photoelectric current, which is directly related to the radiation intensity, When there is no light to produce current, the solar cell acts as a diode. As the intensity of the light emitted into the cell increases, a current proportional to the intensity of the incoming light is generated by the solar cell [6-10]. This current is divided between the variable resistance of the diodes and the charge, in a ratio that depends on the charge resistance and the intensity of the radiation. In order to achieve a better presentation of the electrical behavior of the solar cell, the material resistance and the resistant losses due to the connection surfaces are considered. This loss is provided by the series resistance of the Rs, in the equivalent circuit. In the two-diode model, the leakage current losses with parallel resistance RP are also considered. Only one diode is considered without considering Rs and RP in the Ideal model. In the single diode model, one diode is considered without considering RP. The equivalent circuit of a solar cell in the two-diode model is shown in Figure 1 and its current equation is as follows (Figure 1):
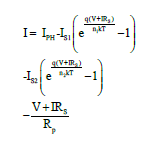
The parameters in equation 1 are defined as follows:
IPH: Photoelectric current (A)
I0: Saturation flow in no light conditions (A)
IS1: Magnetic saturation current due to scattering (A)
IS2: Magnetic saturation current due to electron-hole pair formation
in capacitance layer space (A)
RS: Cell series resistance (Ω)
RP: Parallel cell resistance (Ω)
n1, n2: Ideal coefficients (quality) of the diode
q: Electric charge 1.6×10⁻¹⁹ C
k: Boltzmann constant 1.38×10⁻²³J/K
T: Solar cell temperature (K)
In this model, there are seven unknowns, which include IPH, IS1, IS2, n1, n2, RS, and RP, and seven equations are needed to calculate these unknowns. In many cases, the value of n1 is equal to one and the value of n2 is equal to two, in which case the number of unknowns reduces to five. For the remaining unknowns, three equations can be written for short-circuit points, the open-circuit voltage, and the maximum power point. The fourth equation is the derivative at the maximum power point, where the power derivative is zero relative to the voltage. For the last equation, the derivative can be used at one of the points of short circuit current or open-circuit voltage. To solve this system of nonlinear equations, the Newton-Raphson method or other methods can be used. The values of I01 and I02 are considered equal and are calculated according to equation 2. Based on the results obtained, the value of n1 is equal to 1.0 and the value of n2 is greater than or equal to 1.2.
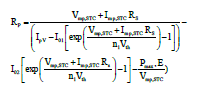
In order to determine the unknown parameters in this model and plot the I-V diagrams, a program was written in MATLAB. RS and RP parameters are calculated by the iteration method. To do this, first, the initial values for these two parameters are considered, and then, having all the unknowns, the current-voltage values are calculated and the maximum power is found. The value of this power is then compared with the maximum power of the panel, which is available in the spec sheet. The value of parallel resistance is obtained from Equation 3 [11]:
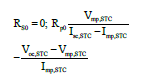
The initial values for each of the resistors are given below.
To calculate the parameters for the standard conditions, the value of IPH can be considered equal to Isc, or in each step, its value can be calculated using equation 5 with the appropriate resistance parameters.
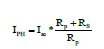
Table 1:specifications of the 10-watt monocrystalline silicon solar panel.

The specifications of the 10-watt monocrystalline silicon solar panel made by Santek China, is given in Table 1. Based on the above equations, the program was implemented. Table 2 summarizes the values calculated by these models for the effective parameters.
Table 2:Calculated parameters from solar cell modeling for standard conditions.

Figure 2:Current-voltage diagram of the solar panel obtained from three models under standard condition.

Figure 3:Power-voltage diagram of the solar panel obtained from three models under standard condition.

By calculating the parameters of the models, the current and power diagrams in terms of voltage can be plotted for the solar panel (Figure 2 & 3).
The Effect of Temperature and Radiation Intensity on the Performance of the Solar Panel
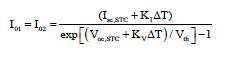
Solar cell voltage and current values depend on the intensity of radiation on the cell surface and the operating temperature of the cell. The following relationships show the effect of these two parameters on the values of short circuit current and open-circuit voltage [5,12].

In the above relations, T and TSTC are the cell operating temperature and standard temperature (usually 25 degrees Celsius), respectively, G and GSTC are radiation intensity on the cell surface and standard radiation intensity, respectively, kI and kV are temperature coefficients for current and voltage (available from the solar panel specifications), and NS is the number of cells connected to each other in series. Equation 10 is used for the saturation current of the diode that changes with temperature [13-15].
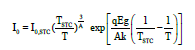
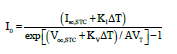
Where Eg is the semiconductor bandwidth energy and I0,STC is the diode saturation current under standard test conditions. Another equation that can be used for saturation current with respect to temperature changes is as follows [16,17]:
The effect of temperature
An increase in temperature increases the resistance and decreases the voltage in the silicon cells and thus reduces the efficiency. Hot climates require higher voltage photovoltaic modules than cold climates. In cold weather, the resistance decreases, and the voltage increases. The effect of temperature on the performance of a 10-watt panel is shown in Figure 4 & 5, which are the current-voltage and power-voltage diagrams of the solar panel, respectively. As can be seen, the change of open-circuit in voltage of the panel was greater than the change in temperature, while the radiation intensity of the panel’s short circuit was slightly different.
Figure 4:Temperature affects the Current-voltage diagram of Solar panel.

Figure 5:Temperature affects the Power-voltage diagram of Solar panel.

In general, an increase in temperature causes a decrease in the amount of open-circuit voltage of the panel and an increase in the amount of short circuit current of the panel.
The effect of radiation intensity
The average intensity of solar radiation outside the Earth’s atmosphere (before passing through the atmosphere which is called air-mass zero, AMZ=0) is 1361 watts per square meter. The intensity of solar radiation decreases after passing through the atmosphere due to reflection by particles such as carbon dioxide, water vapor, and ozone, and its amount reaches approximately 1000 watts per square meter. These values are calculated at solar noon. Modules can generate some electricity even when there is no direct sunlight. Shade is also a very important factor in reducing system efficiency. It should be noted that even if a cell from a module is shaded, the output of the entire module is affected and significantly reduced. The presence of shadow in some single modules (such as amorphous silicon and cadmium toluene) does not have much effect on their overall efficiency. It is best to avoid overshadowing the system as much as possible.
Figure 6:Radiation intensity affects the Current-voltage diagram of solar panel.

The effect of radiation intensity on the performance of a 10- watt panel is shown in Figure 6 & 7. To investigate the effect of radiation intensity on panel performance, the operating temperature of the panel is considered constant and the radiation intensity on the panel surface is changed from 200 to 1000 watts per square meter. As can be seen in Figure 6 & 7, changes in radiation intensity on the panel surface have the greatest effect on the amount of short-circuit current, and with an increase in radiation intensity, the amount of short-circuit current has also increased while the amount of open-circuit voltage of the panel did not change much with the change in the amount of radiation intensity on the panel surface. In general, an increase in the intensity of radiation at a constant temperature increases the power of the solar panel.
Figure 7:Radiation intensity affects the Power diagram of solar panel.

Comparing the Model and Experimental Result
Figure 8:The ideal model results compared with the experimental results.

Figure 9:The ideal model results compared with the experimental results.

Here, the results of testing a 10-watt panel under sunlight are compared with the results of modeling, Figure 8-11. As it can be seen in Figure 10 & 11, the two-diode model has good accuracy and consistency compared to the experimental results. The ideal and single-diode models are slightly less accurate in predicting the panel performance [18].
Figure 10:Prediction of current-voltage diagram for twodiode model compared to experimental values.

Figure 11:Prediction of power-voltage diagram for twodiode model compared to experimental values.

Result for Concentrated Sunlight
To test the solar panel under the intensified sunlight, a concentrating system was designed and built using conventional flat glass mirrors. This intensifier consists of 4 mirrors that reflect sunlight evenly on the solar panel. The solar panel has 36 monocrystalline silicon cells with dimensions of 6.25×7 2.7cm which were connected in series and had an approximate efficiency of 16.5%. A radiometer was used to measure the intensity of the radiation and a non-contact thermometer was used to measure the temperature of the solar panel. In order to measure the current and voltage, a PROVA200 solar panel test device was used, Figure. 12 & 13.
Figure 12:The solar panel, radiation meter, thermometer and solar panel test device.

Figure 13:The PROVA200 solar panel test device.

The concentrating system was used to produce different intensities of sunlight. The results of different radiation intensities were measured and the current and power diagrams vs. voltage were plotted. According to the results, the cell voltage decreases with increase in temperature. The cell fullness coefficient also decreases with increase in temperature from 71.87% to 57.18%, which may be caused by the increase in ohmic losses due to the high resistance of the panel series. The power output of the panel increases with increase in radiation intensity from 9.1 to 19.09 watts. The experimental results indicated that with increasing radiation intensity, the panel temperature increases and also with increasing temperature, the efficiency of the solar panel decreases from 14.84 to 10.34. If the cell temperature is kept constant, the efficiency of the panel may increase with increasing the radiation intensity. Therefore, in the case of concentrating sunlight, one may use a cooling system to prevent the decline in the panel efficiency. Jakhar et al. simulated a concentrating photovoltaic system and reported that the maximum concentrating photovoltaic temperature can go up to 416 °C at 3 Suns without any cooling, while with cooling it is reduced down to 85.28 °C [19].
Figure 14:Current-voltage diagram of the solar panel at 44oC and radiation intensity of 1012W/m2.

Figure 15:Power-voltage diagram of solar panel at 44oC and radiation intensity of 1012W/m2 and temperature 44oC.

Figure 16:Current-voltage diagram of the solar panel at radiation intensity of 2500W/m2 and 82 oC .

Current-voltage and power-voltage diagrams for the specified radiation intensity and cell temperature were investigated using the single-diode model for 44, 59, 65, 75 and 82 ℃, and the values obtained by from the experiments (Figure 14-17 are shown as typical for 44 and 82 ℃). As it can be seen from these figures, the difference between the theoretical and experimental values is greater at points close to the maximum power, which is due to the increase in series resistance with the increase in temperature. However, by modeling the resistors, it is revealed that these values are equal to the values of series and parallel resistors of the solar panel under standard conditions. Therefore, the closer the test conditions are to the standard conditions, the smaller are the difference between the values obtained from the modeling and the experimental results, as can be seen in Figure 16 & 17, which are the closest to the standard conditions.
Figure 17:The PROVA200 solar panel test device.

Overall, the experimental results confirm the validity of the models. These models can also be used in different conditions of radiation intensity and cell temperature.
Conclusion
To model the performance of solar cells, two diodes mode was developed. The results and their comparison with experimental values at the corresponding temperature and radiation intensity show that the model resembles the current, voltage, and power output very well and may be used to evaluate the performance of the solar panels at different radiation intensities and temperatures. A low focus ratio system was also used to evaluate the performance of the solar photovoltaic panel under concentrated solar radiation. A two-diode model was proposed to model the performance of the panel under concentrated sunlight. The results show that the power output of the solar panel increases with increasing radiation intensity. The power output of a 10W panel increased up to 19.09W, which is approximately 1.9 times the power output under standard conditions. As the ratio of concentration and intensity of radiation increases to higher levels, the operating temperature of the panel also increases, so that the panel may need to be cooled. As the temperature increases, the efficiency of the solar panel decreases. The efficiency of the cell increases at an almost constant operating temperature of the cell as the intensity of the radiation increases. The cell voltage and the fullness coefficient of the cell decrease with an increase in temperature. This decrease in fullness coefficient, from 71.87% to 57.18%, may be the result of an increase in ohmic losses due to the high resistance of the panel series. Using a concentrating system with a low concentration ratio increases the intensity of radiation, temperature, and power of the solar panel.
References
- Ishaque K, Salam Z, Taheri H (2011) Accurate MATLAB simulink PV system simulator based on a two-diode model. Journal of Power Electronics 11(2): 179-187.
- Goetzberger A, Hebling C, Schock HW (2003) Photovoltaic materials, history, status and outlook. Materials Science and Engineering R 40(1): 1-46.
- Fraas LM, Larry DP (2015) Solar cells and their applications, John Wiley and Sons.
- Michael JJ, Iniyan S, Goic R (2015) Flat plate solar photovoltaic-thermal (PV/T) systems: A reference guide. Renewable and Sustainable Energy Reviews 236(51): 62-88.
- ALQahtani, Ayedh H, Muthanna S, Abuhamdeh, Yazan M, et al. (2012) A simplified and comprehensive approach to characterize photovoltaic system performance. In Energytech IEEE, pp. 1-6.
- Tripathi B, Yadav P, Lokhande M, Kumar M (2012) Feasibility Study of Commercial Silicon Solar PV Module based Low-Concentration Photovoltaic System. International Journal of Electrical and Electronics Engineering Research 2(3): 84-93.
- Tian H, David M, Ellis F, Muljadi K, Jenkins E (2012) A cell-to-module-to-array detailed model for photovoltaic panels. Solar Energy 86(9): 2695-2706.
- Hernanz JR, Guede JL, Belver IZ, Lopez PE, Zulueta E, et al. (2014) Modelling of a Photovoltaic Panel Based on their Actual Measurements.
- Pranahita BS, Kumar AS, Babu AP (2014) A Study on Modelling and Simulation of Photovoltaic Cells. IJRET: International Journal of Research in Engineering and Technology 3(11): 101-108.
- Chander S, Purohit A, Sharma A, Nehra SP, Dhaka MS (2015) Impact of temperature on performance of series and parallel connected mono-crystalline silicon solar cells. Energy Reports 1: 175-180.
- Ishaque K, Salam Z, Taheri H (2011) Modeling and simulation of Photovoltaic (PV) system during partial shading based on a two-diode model. Simulation Modelling Practice and Theory 19(7): 1613-1626.
- Sera D, Remus T, Pedro R (2007) PV panel model based on datasheet values. In Industrial Electronics, IEEE International Symposium, pp. 2392-2396.
- Rustemli S, Dincer F (2011) Modeling of photovoltaic panel and examining effects of temperature in Matlab/Simulink. Electronics and Electrical Engineering 109(3): 35-40.
- Rodrigues EMG, Melício R, Mendes VMF, Catalão JPS (2011) Simulation of a solar cell considering single-diode equivalent circuit model. In International conference on renewable energies and power quality, Spain 1(9): 13-15.
- Yadav P, Tripathi B, Pandey K, Kumar M (2014) Effect of varying concentration and temperature on steady and dynamic parameters of low concentration photovoltaic energy system. International Journal of Electrical Power & Energy Systems 61: 101-110.
- Salmi T, Bouzguenda M, Gastli A, Masmoudi A (2012) Matlab/Simulink Based Modeling of Solar Photovoltaic Cell. International Journal of Renewable Energy Research 2(2): 213-218.
- Villalva MG, Gazoli JR (2009) Comprehensive approach to modeling and simulation of photovoltaic arrays. Power Electronics, IEEE Transactions.
- Zamani B (2014) Modeling and Experimental investigation of performance of a Low Concentration PV system. MSc thesis, Isfahan University of Technology, Iran.
- Sanjeev J, Soni MS, Nikhil Gakkhar (2017) Modelling and Simulation of Concentrating Photovoltaic System with Earth Water Heat Exchanger Cooling. Energy Procedia 109: 78-85.
© 2022 Alemrajabi AA. This is an open access article distributed under the terms of the Creative Commons Attribution License , which permits unrestricted use, distribution, and build upon your work non-commercially.
Editor In Chief


.jpg)


Signup for Newsletter

Quick Links
 Editorial Board Registrations
 Submit your Article
 Refer a Friend
 Advertise With Us
Our Recent Edition

.jpg)


Top Editors


.jpg)


.bmp)
.jpg)
.png)
.jpg)


.jpg)


.png)

.png)


.png)


Financial Support

Sponsors

Latest e-Books

Latest Video

 a Creative Commons Attribution 4.0 International License. Based on a work at www.crimsonpublishers.com.
Best viewed in
a Creative Commons Attribution 4.0 International License. Based on a work at www.crimsonpublishers.com.
Best viewed in