
- About Us
- Information
-

The Author ensures that the research has been conducted responsibly and ethically with adherence to all relevant regulations. read more..
- For Authors
- For Reviewer
- Manuscript Guidelines
- Membership
- Publication Ethics
-
- Journals
- Reprints
- e-Books
- Videos
- Policies
- Contact Us
 COVID-19
- Submissions


Full Text
Aspects in Mining & Mineral Science
A Brief Review of the Hedley-Grant Pillar Design Formulae and a Proposed Alternative Pillar Design Methodology
Rudiger Kersten*
Westdene, Johannesburg, South Africa
*Corresponding author: Rudiger Kersten, 10 Banbury Road, Westdene, Johannesburg, South Africa
Submission: January 28, 2022;Published: February 08, 2022

ISSN 2578-0255Volume8 Issue4
Abstract
The design of stable pillars in bord and pillar workings has been the subject of many papers using various versions of the empirically derived Hedley-Grant pillar strength formula. A compilation of results using different exponents and strength constant combinations can give similar strength values for the same pillar geometry. In addition, the volume of the pillar affects the strength increasing or decreasing for the same w/h ratios depending on the volumetric dimensions. It is concluded that the empirical approach needs to be enhanced by an analytical methodology. The paper discusses the use of an alternative failure criterion in conjunction with an analytic stress distribution to calculate the strength/failure of pillars and comparing these with observed pillar stability. The proposed methodology simulates progressive fracture development in the pillar with increase in pillar stress. It is concluded that the method is a possible improvement on current pillar strength determinations.
Keywords: Hedley-Grant pillar; Mines; Geological; Calibration
Introduction
To date pillar design equations are derived empirically, the most frequently used is the Hedley-Grant equation with various subscripts/parameters for different mines and rock types. Figure 1 shows the predicted strength for the same rock type using generally used equations as well as some based on the FLAC2D/Hoek Brown, FLAC2D/strain softening programme, and [1]. Three “sets” are obtained using the basic Hedley-grant format, with [2] equation the highest, Ryder’s (although a linear variation) intermediate and Hedley-Grant the lowest. The difference is such that sensible comparison is out of the question and answers for the disparity, and correction thereof, needs urgent attention. Also shown are results obtained from using FLAC2D HB and strain softening simulations which tend to add to the variation in results. Back analysis for calibration purposes also depends on the reliability of the calculated pillar stresses obtained using the Tributary Area Theory, Texan, Minsim or other numerical methods. The results obtained by different methods can vary considerably dependent on the practitioner, numerical method, geometry and elastic constants used.
Figure 1: Pillar strengths for the same rock type using different pillar strength equations [1,9].

The current approach is based on:
a. Examine the inherent properties of the Hedley-Grant equation
and illustrate the potential problems.
b. Using an alternative empirical failure criterion obtained from
strength curves of three-dimensional laboratory strength tests.
c. Use FLAC2D in conjunction with the proposed empirical
criterion to predict the strength of individual pillars.
d. Compare the results with recently observed published pillar
stability data.
A FISH function in FLAC2D, appendix 1, was developed to
simulate the full stress deformation curve from initiation to failure
and residual stress level. The method is then used to compare
the calculated pillar strength, failure, with measured data. It is
concluded that the method has the possibility of enhancing the
current design procedure by elucidating the mechanism of pillar
failure, stress distribution, composition, planes of weakness and
how these influence the pillar when subjected to loading.
The Hedley-Grant formula
The basic Hedley-Grant formula
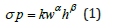
Where σp= Pillar strength
k=Rock strength factor
w=Pillar width
h=Pillar height
α=Constant
β=Constant
The formula requires calibration for each individual mine and
portions of a mine which is not available in the planning stages.
It also has the problem that the actual dimensions of the pillar
play a role in the strength calculated. For the same w/h ratio, the
strength of the specific pillar changes with the dimensions thereof.
Figure 2 shows that for the same w/h ratio, a 2m and 4m high
pillar, the strength differs, increasing or decreasing dependent on
the α and β values. For the same w/h ratios, the strength increases
with increase in height while for the conventional exponents the
strength decreases with increase in height. This effect has nothing
to do with the pillar properties but is a mathematical function. (The
overlap equation has one exponent only and does not exhibit this
effect). The effect can only be removed by changing the k value
from 67 to 53MPa for the Watson formula while 67 to 80MPa for
the conventional. It is concluded that different calibrations are
required not only for different rock types, geotechnical areas and
mine but also for changes in stopping width/pillar volume.
Figure 2: Pillar strengths for stope widths of 2 and 4m, with the same w/h ratio, Watson [3] and the “conventional” Hedley-Grant, α and β=0.5 and 0.75 respectively.

The k value is the only parameter somehow related to the uniaxial compressive strength, varying widely between 30 to 70% of the uniaxial compressive strength. The α and β values have no apparent relationship with the rock mass. The result is that various combinations, such as listed in Table 1, give the same pillar strength as illustrated in Figure 3, plotted in conjunction with observed failed and intact pillars [3]. For the data base between 2 and 7m wide pillars, any one of the listed formulae can be used. Beyond 7m width, observational data is insufficient except that the lower curves give a better separation than the [3], curve. There is no logical basis for these differences and the only way to obtain the correct answer for a specific mine is to start mining and then, on the basis of observation, establish whether the initial design using industry averages, is adequate. Not an auspicious design procedure.
Figure 3: Strength curves for possible combinations listed in Table 1.

Table 1: k, α and β values that give similar strength values for a specific data range.

Alternative Failure Criterion
Kersten [1] attempted to obtain a generic pillar strength equation based on the Hoek Brown strength equation in conjunction with FLAC2D modelling. The result was a cumbersome process of little practical use. One of the main problems was the determination of the mi constant which, according to Hoek & Brown [4], is a function of tensile strength and uniaxial compressive strength. Hoek et al. [4] proposes that for normalized strength distributions there is a standard 6MPa cutoff for the tensile strength. This implies that for an increase in uniaxial compressive strength there will be an associated increase in the mi value which is not necessarily axiomatic and not borne out by numerous laboratory tests. The proposed alternative empirical fracture criterion is based on the direct curve fitting, similar to the Hoek Brown criterion, to available laboratory strength determinations, [5]. Figure 4 is an example for Lac du Bonnet granite [6] with two curves superimposed: the proposed power function as well as the Hoek Brown formulation. The two curves are identical since the basis for the equations are based on the same principle. To test the procedure, several suites of relevant laboratory strength test results (Table 2) were investigated in the same manner and the power function obtained can be expressed by:
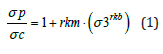
Where σp = Specimen strength
rkm = Slope of curve
rkb = Exponent
σ3 = Minimum principal stress
σci = Uniaxial compressive strength derived from triaxial data
sets.
Table 2: Parameters for different rock types obtained by curve fitting [5].

Figure 4: Comparison between laboratory data, the fitted power function and the predicted strength curve using the Hoek-Brown failure criterion which are identical.

The proposed simplified equation relies on clearly defined
“constants”:
a. rkm is a function of the slope of the strength curve, or the
coefficient of internal friction, and
b. rkb the deviation from linearity of the internal coefficient of
friction
c. The uniaxial compressive strength based on three-dimensional
laboratory results, the σci as defined by Hoek [4].
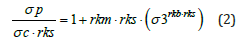
d. To incorporate the effect of the degradation of rock mass,
expressed by the GSI value of Hoek and Brown, a factor rks is
introduced in equation 1.
e. No questionable tensile test results or assumptions are
required.
The last aspect is deemed acceptable for underground
excavations since most induced fracturing occur in a compressive
environment while the Hoek Brown criterion also caters for open
pit mining where tensile stresses may need to be incorporated.
Methodology
The strength given by equation 1 requires the uniaxial compressive strength obtained from triaxial data, the σci of the Hoek Brown system, the rkm value which gives the slope of the stress increase due to the effect of the minimum principal stress which is a function of the coefficient of internal friction. The rkp value defines the deviation from linearity of rkm a function of the influence of the minimum principal stress. All four parameters are clearly defined by laboratory data obtained from tri-axial tests. In reality, the laboratory results are for intact selected specimen and need to be modified when representing the semi-failed rock mass, for this purpose a parameter, rks, is introduced. This parameter is equivalent to the geological strength index, GSI, and is fulfilling the same function. Figure 5 illustrates the effect of changing the rks value from 0.9 to 0.6. The plot of rks=1 has been excluded as the strength of an 8m wide pillar consisting of laboratory type material is 5100MPa and still increasing exponentially for wider specimen. The above effect explains the fact that if laboratory data, without adjustments, the predicted pillar strengths increase exponentially as rks approaches 1 [1]. The selection of the rks value is the only parameter in the equation that needs to be determined empirically by calibration.
Failure progresses across the pillar with increase in stress, resulting in lower resistance of the failed rock and reducing the average strength of the pillar as fracture proceeds within the pillar resulting in an overall residual strength of the pillar. This effect is simulated by introducing a parameter rkss, an estimate at this stage as only a few residual strength values are available [2,3]. In the attached FISH function, the rks value is replaced by the rkss value after the strength of a nodal point has been exceeded. (The reaction of the failed material requires a more rigorous approach as that given above and additional formulation is investigated). Having developed a semi-analytic methodology for calculating pillar strength it is possible to determine a host of information of a pillar reacting to loading. For example, Figure 6 shows the upper quarter of a circular pillar with the position of individual nodal positions in the pillar for which the stresses are calculated Figure 7. The results for the individual nodal points are shown in Figure 7 on the lefthand side, the straight line from the origin depicts the average pillar stress while the curves show the pillar strength/resistance for the individual nodes defined by the numbers. The right hand shows the increase in the fracture zone (blank space) with increase in the average pillar stress. The initial predicted failure commences at the top corner of the pillar, a feature observed in every pillar the author has seen.
Figure 5: Graph illustrating the effect of change in the rks value, from 0.9 to 0.6.

Figure 6: Position of history points where for calculating the individual strength of nodal points.

Figure 7: Progressive fracture development at various positions in a pillar with increase in stress level.

Calibration, Comparison with Underground Pillar Surveys
The initial calibration is a comparison of laboratory data with predicted values using the KISpostf.dat file, using the laboratory obtained parameters, sigc, rkm and rkb and rks=1. An estimated rkss value of 0.3 was incorporated. The predicted values using the KISpostf.dat file in (Figure 8) is identical to those given in Figure 4. This is not surprising since the same “constitutive” equation is used. What it, however, shows are that the overall FISH function appears to simulate reality. For calibrating actual pillar behavior, data from experimental sites at Impala Platinum mine [7], Two Rivers Platinum mines [1] and Boysendal Platinum mine [3] are used. A recent study by Watson et al. [3] on pillar stability on a UG2 reef mine provides an excellent data set for pillars with different width for a constant height of 1.9m and their failed/stable classification. The KISpostf.dat program, Appendix 1, was used to calculate the strength of the listed pillars. The strength determined clearly separates the failed and solid pillars. Figure 9 is a composite plot of failed, stable pillars, and the strength predicted using Watson [3] formula and the KISpostf.dat methodology. The generally assumed exponential increase in strength is not shown by either the observed or the predicted delineation; the flatter curve obtained using the FLAC2D program appears to be more realistic but not conclusive because of the sparsity of data for the wider pillars.
Figure 8: Comparison between laboratory test data and calculated using KISpostf program.

Figure 9: Plot of failed and stable pillars and FLAC2D-RK, (KISpostf.dat) simulation with a loading rate (1e- 7) and sigc=130MPa, rkm=0.25, rkb=0.7 and rks=07. Also shown are the results obtained using the Watsons equation [3].

The Watson curve is steeper than the FLAC2D RK curve and incorporates more failed pillars than predicted. On the other hand, the FLAC2D RK curve is very “flat” and differs from the generally accepted expectation for the pillar strength to increase with increase in the pillar width. This aspect is discussed further in section 5 incorporating the post-failure stress regime by modification of the KIS postf.dat file. An additional comparison with observation using is a stress strain diagram [3] for the stress distribution above a pillar, Figure 10, showing the increase in stress with increase in mining, a plateau, and a sudden drop to a residual value of 40 MPa. A similar pillar was modelled using the FLAC2D-RK program with the result shown in Figure 11. The importance is the similarity between (Figures 10 & 11), since detail of the pillar dimensions and is unknown. A detailed analysis and underground inspection of pillar stability at Two Rivers Platinum mine [1] did not find any failed pillars but there was a distinctive fracture initiation at the corners of the pillars, induced stress fracturing, possibly enhanced by the blasting effect, which was used for calibration. The constants used were rkm=0.25, rkb=0.71, rks=0.5, rksigc=130 and effective pillar width of 6.2m and height of 2.6m. Figure 11 shows the stress distribution and the extent of the fracture zone. The reigning average pillar stress on these pillars, 49MPa, was obtained using the system pillar equilibrium method [1] with the pillar strength and the average pillar stress in (Figure 12), 53MPa, was obtained using the FLAC2D method. The predicted failure coincides well with the observed fracturing underground. Data collected at Impala Platinum mine by Piper & Flannigan [7] was used for calibration purposes with parameters rkm= 0.2, rkb=0.71, rks=0.6, rksigc=120, values determined from curve fitting to Merensky reef laboratory strength data, with an effective pillar width of 5.2m, 1.8m high, were used. The equilibrium field stress on the pillars calculated using the system pillar equilibrium method was 119MPa [1]. Simulating the same conditions with KISpost.dat shows that at a stress of 120MPa the predicted fracture zone (Figure 13), is 0.5m, the same as the average of 0.5m measured by Piper & Flannagan [7].
Figure 10: Stress-strain diagram of pillar stress measurements in the hanging wall of a UG2 pillar [3].

Figure 11: Average pillar strength, (MPa) vs y displacement of a 1.9m high pillar using the FLAC2D RK program.

Figure 12: Average pillar stress and pillar strength at stage where fracture initiation commences at the corner of the pillar, Two Rivers Platinum mine.

Figure 13: Average pillar stress and pillar strength with extent of the predicted fracture zone of grid pillars at Impala Platinum mine.

Discussion
The example of the influence of three independent variables that can be defined arbitrarily used in the Hedley-Grant equation showed the need to reduce the number of variables and that these should be defined as accurately as possible. The proposed four variables, rkb, rkm, sigc are clearly defined values for a data set with rks the only estimated parameter. The rks is equivalent to the geological strength index, GSI. The post-failure strength of the rock is required since it affects the pillar strength a parameter, rkss, is required. The only way of establishing these parameters, calibration is required for a full pillar strength determination. The rks parameter is a measure of the tectonic history of the rock mass, in a microscopic as well as macroscopic sense, same as the GSI value but on a macroscopic scale. The rkss value is seen as a continuation of the “tectonic”/mining disturbance of the rock mass and hence will result in a similar reduction in strength hence the substitution in equation 2 of rks by rkss for the post failure regions.
Since the rks parameter has a significant effect on the pillar strength and that it is the one parameter that is not clearly defined it is necessary to determine its effect on the overall design pillars. Figure 14 is a plot of the effect of changes in the rks value for various w/h ratios of pillars. The effect becomes predominant rks >0.8 for w/h>2. A rks of 0.7 to 0.73 was found to be appropriate for w/h ratios, pillar widths 2 to 10m for UG2 chromitite in the back analysis. It is clear that for detail design purposes a sensitivity analysis is required for a planned mine design and that the probable deviations from the estimated values must fall within the selected factor of safety. A relationship between the GSI and rks values is most likely and would enhance our understanding of rock mass response. The Youngs modulus and Poissons ratio has no discernable effect on the pillar strength. It becomes important when stress-strain diagrams are required [8-10]. The KISpostf.dat file is controlled by the elastic model, mod e, which gives an apparent realistic result for the pillar strength but does not include the effect of the stress changes in the pillar due to consecutive nodal failure. Using the Mohr model as a basis, mod mo, the effect is incorporated in KISmohr.dat file with resultant increase in pillar strength (Figure 15), due to the effect of the stress change introduced in the mo model. (Note that the strength curve is still a function of equation 1). The KISpostf.dat, mod e, results in (Figure 9) are lower and for the curve in (Figure 15), (mo-based derivation). To obtain comparative results, the rks was increased to 0.73 (mode) instead of 0.7 and plotted in Figure 15. The current KISpostf.dat file needs to be changed to incorporate this effect but is beyond the capability of the author to do so. The conceptual program KISpostf.dat is a conceptual design and requires optimization and further testing to define its applicability and limitations. Once this has been defined it can be expanded to more complex geometries with interfaces, joints etc.
Figure 14: Effect of changes in the rks value for change in the w/h ratio of the pillar.

Figure 15: Comparison of pillar strength between the elastic model with rks=0.73 and the Mohr model.

Summary and Conclusion
The main disadvantage of the empirical criteria used currently is that the “constants/parameters” do not all appear to be based on actual physical quantities. In this paper it is attempted to reduce the number of unknowns or replaced with clearly defined quantities. The proposed methodology is a combination of an empirical failure criterion based on measurable physical properties, or failure “constitutive law”, of rock, and an analytical procedure. It is concluded that the methodology has a distinct advantage on the equations used to date for predicting the strength of pillars. The proposed methodology is an attempt to form a simple platform on which it will be possible to incorporate the influence of planes of weakness in the pillar and sensitivity analysis. The program in Appendix 1 should not be seen as final as alterations and improvements must be introduced with optimization and wider application.
Acknowledgement
The assistance of Peter Cundall and subsequent support from Jim Hazard and Jin Wang of Itasca is much appreciated for the loan of a dongol and free usage for a limited period.
Appendix 1:

References
- Kersten RWO (2016) A probabilistic structural design process for bord and pillar workings in chrome and platinum mines in South Africa. Thesis submitted to the Faculty of Engineering and the Built Environment, University of the Witwatersrand, Johannesburg, South Africa.
- Watson BP (2010) Rock behaviour of the Bushveld Merensky reef and the design of crush pillars. Wits University, South Africa.
- Watson BP, Lamos RA, Roberts DP (2021) Plat mine pillar strength formula for the UG2 Reef. SAIMM 121.
- Hoek E, Brown ET (2019) The Hoek-Brown failure criterion-2018 Edition. Journal Rock mechanics and Geotechnical Eng 11(3): 445-463.
- Kersten RWO (2021) An alternative brittle failure criterion and methodology for predicting facturing around underground excavations. Aspects Min Miner Sci 8(1): 888-899.
- Hoek E, Martin CD (2014) Fracture initiation and propagation in intact rock-A review. Journal of Rock Mechanics and Geotechnical Engineering 6(4): 287-300.
- Piper PS, Flanagan FW (2005) The in-situ performance of yielding pillars at impala 12 shaft. J S Afr Inst Min Metall 3rd Southern African Rock Engineering Symposium.
- Hedley DGF, Grant F (1972) Stope pillar design for the Elliot Lake uranium mines. Bull Can Inst Min Metal 65: 37-4
- Özbay MU, Ryder JA, Jager AJ (1995) The design of pillar systems as practiced in shallow hard-rock tabular mines in South Africa. J S Afr Inst Min & Metall pp. 7-18.
- van der Merwe JN, Mathey M (2013) Update of coal pillar strength formulae for South African coal using two methods of analysis. J S Afr Inst Min & Metall 113(11).
© 2022 Rudiger Kersten. This is an open access article distributed under the terms of the Creative Commons Attribution License , which permits unrestricted use, distribution, and build upon your work non-commercially.
Editor In Chief


.jpg)


Signup for Newsletter

Quick Links
 Editorial Board Registrations
 Submit your Article
 Refer a Friend
 Advertise With Us
Our Recent Edition

.jpg)


Top Editors


.jpg)


.bmp)
.jpg)
.png)
.jpg)


.jpg)


.png)

.png)


.png)


Financial Support

Sponsors

Latest e-Books

Latest Video

 a Creative Commons Attribution 4.0 International License. Based on a work at www.crimsonpublishers.com.
Best viewed in
a Creative Commons Attribution 4.0 International License. Based on a work at www.crimsonpublishers.com.
Best viewed in