
- About Us
- Information
-

The Author ensures that the research has been conducted responsibly and ethically with adherence to all relevant regulations. read more..
- For Authors
- For Reviewer
- Manuscript Guidelines
- Membership
- Publication Ethics
-
- Journals
- Reprints
- e-Books
- Videos
- Policies
- Contact Us
 COVID-19
- Submissions


Full Text
Aspects in Mining & Mineral Science
Phase Transformations in Quartz used in Silicon and Ferrosilicon Production
Jusnes KF1*, Ringdalen E2 and Tangstad M1
1Norwegian University of Science and Technology, Norway
2Sintef Industry, Norway
*Corresponding author: Karin FjeldstadJusnes, Norwegian University of Science and Technology, 7491 Trondheim, Norway
Submission: September 18, 2020;Published: October 22, 2020

ISSN 2578-0255Volume5 Issue5
Abstract
Different quartz types are used as raw material for silicon and ferrosilicon production. Upon heating, the quartz will experience phase transformations to other silica polymorphs. In this study the phase transformation from quartz to cristobalite, via an amorphous intermediate state, have been investigated in four different quartz types. Samples of approximately 10g and 100g were heated to 1600 °C and 1700 °C. After cooling, the amount of quartz, cristobalite and amorphous phase were measured using X-ray diffraction. Type F showed the strongest ability to transform from quartz to cristobalite, while type A had the slowest transformation. A model of the transformations was made. The rate constant, k1, for the transformation from quartz to amorphous phase varied between 0.002h-1 and 0.184h-1 at 1600 °C. The activation energy for the transformations were different for the various quartz types. Type A had an activation energy of 600kJ/mol, type F had 500kJ/mol and type D and G had around and below 200kJ/mol. The reasons for the different abilities to transform are discussed, and it is suspected that properties decreasing the crystallinity will increase the ability to transform.
Keywords: Quartz; Cristobalite; Silicon production; Phase transformation; XRD; Reaction Rates
Problem Definition
Quartz, consisting of mainly SiO2, is needed as a raw material for the production of silicon and ferrosilicon. A carbothermic reduction of the quartz in a submerged arc furnace at temperatures above 2000 °C will create liquid silicon or ferrosilicon, which can be tapped from the furnace. The simplest reaction equation for the process is shown in Equation 1. A throughout explanation of the process can be found in Schei et al. [1].

This is the overall reaction, and other species like SiC and SiO-gas are also present and affecting the furnace behavior. When quartz is added to the furnace, it will experience a very steep temperature increase from room temperature to 700-1300 °C [2]. Further, the quartz will continue to heat as it is descending in the furnace. The melting point of silica is 1727 °C [3], but before this temperature is reached the quartz will have changed several of its properties. According to the phase diagram for silica seen in Figure 1, the first phase transformation from α-quartz to β-quartz will take place at 573 °C. It is a displacive transformation meaning no bonds are broken, only shifted. Such a transformation requires very little energy and will be reversed upon cooling. When the temperature is increased above 573 °C, the phase diagram suggests that tridymite will form. Several investigations have concluded that this transformation is not observed in pure SiO2 samples but needs certain impurity elements to proceed [4,5]. The tridymite phase is not observed in large extents in silicon production [2], neither has earlier XRD investigations of quartz shown any tridymite formation [6]. The phase transformation from quartz to cristobalite is a reconstructive phase transformation, meaning that the bonds between the atoms are broken, and rearranged [7]. This type of transformation is more energy consuming than a displacive transformation. A reconstructive transformation is also time consuming, and complete conversion in silica is not guaranteed after 6 hours at 1600 °C [6]. Also, cristobalite have been observed at much lower temperatures than the phase diagram in (Figure 1) suggests. Richet et al. [8] calculated an equilibrium temperature for the transformation from β-quartz to β-cristobalite of 835 °C. However, the lowest temperature where cristobalite is observed is 900 °C, again a lower temperature than suggested by the phase diagram [3,6]. The transformation from quartz to cristobalite have been shown by several researchers to go through an amorphous intermediate state [9-12]. The transformation is sluggish, and according to Presser et al. [13] it reaches its maximum at 1677 °C. Equation 2 shows the suggested transformation path [9].
approx. 1300 °C
Quartz → Transition phase → Cristobalite (2)
Figure 1: The phase diagram of silica [2].

The mechanism of the transformation from quartz to cristobalite is not fully known [7]. Even if cristobalite is thermodynamically possible at 1000 °C, there could exist a finite amount of cristobalite in regions with high surface energy such as defects, impurities, and cracks below this temperature. The formation of such regions will depend on the nucleation mechanism of cristobalite in pure silica [7]. Several researchers have investigated this mechanism, and some of the theories are summarized below:
- Marian and Hobbs [9] suggested that for the quartz to cristobalite transformation to happen, a third of all the bonds in quartz had to be broken before cristobalite could form. Nucleation point would be created throughout the sample, and the transformation would therefore be slow in the beginning
- Wiik [14] also suggested that the transformation would happen throughout the sample instead of the surface. His explanation was that since intermediate amorphous phase and cristobalite had lower density than quartz, they would cause the sample to crack and therefore initiate transformation throughout the sample.
- Mitra [15] suggested that the transformation from quartz to an intermediate phase is phase boundary controlled, while the transformation from an intermediate phase to cristobalite is controlled by the concentration of the intermediate phase
- According to Breneman et al. [16] the formation of cristobalite is favored at surfaces. He investigated sintered silica glass and found that when the material became denser at higher temperatures, the crystallization rate might not be directly comparable to crystallization rates at lower temperatures.
- Wagstaff [17] claims that cristobalite heterogeneously nucleates and grows internally in vitreous silica.
The kinetic of the phase transformation from quartz to cristobalite will differ from one quartz type to another and take time since the transformation is sluggish and could be hindered [6]. Yet, there are studies identifying certain properties, which can affect the kinetics for the cristobalite formation. A study by Lakshtanov et al. [7] from 2006 confirmed what was suggested by Sosman [18] in 1965 and Wahl et al. [5] in 1961, that larger crystal size and higher grade of crystallinity, little or no defects or impurities in the crystal structure, would slow down the transformation to cristobalite. This would also be the case for any other reconstructive phase transformation in quartz. Wahl et al. [5] also studied the effect of crystallinity on the starting temperature of cristobalite formation. They found a positive correlation between the degree of perfect crystallinity, i.e. lack of amorphous phase, and the starting temperature for cristobalite formation. For the more perfect crystal structured quartz, cristobalite was not observed before 1200 °C. For silica gel (amorphous), cristobalite was observed already at 900 °C. The study suggested that the formation temperature for cristobalite should not be considered as a fixed value, but as a function of the degree of crystallinity of the sample. Schneider et al. [12] also suggested that a smaller grain size in the samples and lower crystallinity would have an accelerating effect on the transformation to cristobalite. Impurities also seems to have an effect on the phase transformation. Chaklader [19] investigated the effect of Al2O3, which speeds up the transformation, but only up to 0.44 % added Al2O3. Further addition would slow down the transformation again. The mechanism is not straight forward, but Chaklader proposed a twostep transformation. First, the catalyst would nucleate on the quartz grain. Further, a diffusion layer produced by the penetrating catalyst would propagate. The formation of a transition phase was also affected by the Al2O3 catalyst. A critical limit for Al2O3 were observed also here. A study by Brown et al. [20] also stated that the formation of cristobalite from SiO2 glass (amorphous) would increase with increasing Al2O3 content. Up to a certain amount of Al3+ the growth rate would increase rapidly before flattening out, shown in Figure 2. This is in agreement with Chaklader [19]. Alkali and alkali earth impurities has also been shown to increase the nucleation and growth of the cristobalite phase [12].
Another aspect that could influence the kinetics of the phase transformation from quartz to cristobalite is the particle size. This has been investigated by Dapiaggi et al. [21,22]. They both investigated the kinetics in the phase transformation from quartz powder. Pagliari et al. [22] reported that fine powder would more easily transform to cristobalite, but when a certain size was reached the effects were diminishing. This limit was 15.78µm. Dapiaggi et al. [21] reported that no clear trend was observed for the transformation kinetics due to particle size. Kjelstadli [11] investigated particles of much larger size than [21,22]. Lumps from 10g to 200g of one quartz type were heated in a rapid heating furnace, and the phases measured with X-ray diffraction. The samples were heated to 1600 °C with various amount of holding time. The result can be seen in Figure 3. The figure shows no clear trend in the amount of phases as a function of sample size. This indicates that the mechanism for the transformation is nucleation, and hence not dependent on the sample size. This is in agreement with [9,14,17] which also argued for a nucleation mechanism throughout the sample. A study by Chaklader [23] assumed a first order reaction for the transformation from quartz to cristobalite via an amorphous intermediate state, with k1 and k2 being the rate constants for respectively the transformation from quartz to amorphous phase, and from amorphous phase to cristobalite. He found the k1 and k2 at 1560 °C to be 2.20×10⁻⁵s-1 and 4.88×10⁻⁵s-1 respectively. Based on other studies [15], it is likely to assume that different quartz types have different rate constants. The amount of phases and the model of the amount of amorphous transition phase made by Chaklader [23] can be seen in Figure 4. A good fit with the experimental results can be seen, confirming the first order reaction assumption for the phase transformation from quartz to amorphous phase. The phase transformation from quartz to cristobalite is suspected to affect the furnace operation in several ways. According to Aasly [2], the transformation causes fracturing of the quartz and a volume expansion. This could cause an increase in the fine material in a furnace (< 10mm), which again will cause a decrease in the permeability and flow of raw materials and gases. Low permeability is not beneficial because a pressure could build up in the charge and create small outbursts of gas or channeling. Experiments by Edfelt [24] showed that fines from 0.23-4.76 caused the greatest pressure to drop in a furnace. The different silica phases could also affect the rate of the chemical reactions happening inside the furnace. According to Wiik [14], the reaction rate between SiC and SiO2 were twice as high if cristobalite was used instead of quartz as the silica source. On the other hand, Tangstad et al. [25] & Folstad [26] did not find any difference in the reaction rate between SiC and SiO2 with the use of different silica polymorphs. One cannot rule of the possibility that different silica polymorphs affect the reaction rates in the furnace, and hence the furnace performance. It is therefore important to investigate he ability to transform to other silica polymorphs for different quartz types used for silicon and ferrosilicon production.
Figure 2: Growth rate of cristobalite layer from SiO2 glass samples as a function of Al3+ content in the silica sample. The figure is reprinted from Brown et al. [20].

Figure 3: Amount of phases for samples from 10g to 200g heated to 1600 °C for various amount of time. The is based in results from Kjelstadli [11].

Figure 4: The amount of phases of a Brazilian quartz type fired to 1560 °C for various amount of time. The dotted line for the transition phase is the modelled amount of this phase [23].

Material Specifications
Four quartz types were used in this study. They have different geological origin, appearance, and impurity content. All the quartz types are supplied by Elkem and anonymized.
- Type A is a gravel quartz originating from a hydrothermal metamorphic vein. The source has two geological domains. Domain one, which is dominating (50%), has medium to coarse grains, up to cm scale. The second domain has grains which are 10-200µm thick and a few mm long. The grains in this domain are stretched and deformed. In between the deformed grains, layers of recrystallized grains are found. Fluid inclusion occur along healed cracks and sometimes along very small arrays transversal to the main foliation. The amount of fluid inclusions and cracks are low [27].
- Type F is from a hydrothermal quartz vein. The quartz deposit is very complex. Investigations has found that the quartz type consists of large, deformed grains, around 1cm and up to 3cm. The samples contain some fluid inclusion and recrystallized quartz, which has a smaller grain size, 70-130µ There are 3 generations identified in this quartz. They are white, grey, and dark quartz. White quartz is the most common type and shows the highest concentration of trace elements. The white quartz contain healed fractures with fluid inclusions oriented in the same direction [28].
- Type G is a gravel quartz, where erosion of surrounding mountains has deposited the quartz in alluvial fans and fluvial deposits. The individual lumps have rounded edges from interaction with other material during water transportation and deposition. The color is white, and there are some visual differences in the lumps. Some lumps are quite large, and some has some impurities making brown marks. A throughout study of the quartz types has revealed 3 different regimes in the samples, based on the grade of deformation. Regime one is the least deformed and has the largest amount of fluid inclusions and trails after fluid inclusions. The grain size in regime 1 is a few cm. In regime two, the quartz is partly recrystallized and has very varied grain size, from µm to cm. Recrystallized grains appear strain-free. Regime two has fewer fluid inclusions than regime one. Regime three shows dynamic recrystallization and a larger fraction of the grains appears strain-free. Fluid inclusions are sparse compared to regime one and two. It is roughly estimated that 74 % of the deposit is regime one, while 22 % is regime two and 4 % is regime three [29].
- Type D is a meta-sandstone and is mined by drilling and blasting operations. It is the quartz type in this study with the highest impurity level. The quartz has a red color and appears homogeneous. Microscopic investigations have shown that this type has a significant amount of pores. Minerals are often occurring in these pores. The grains found in this type are small, typically 0.2-1mm [2,30]. The chemical compositions of the quartz types are given in Table 1. The method used is ICP-OES and performed by a collaborating company. In the right column, the amount of alkali and alkali earth elements are summarized. It is assumed that the rest of the samples are SiO2.
Table 1: The chemical composition of the trace elements in the quartz types used for phase transformation investigations. All the impurities are given in wt %, except were ppm is stated.

Experimental Procedure
In this study four quartz types used for producing Si and FeSi were heated in a Nabertherm LHT 04/08 rapid heating furnace to 1600 °C and 1700 °C, one at a time. The heating rate was approximately 50 °C/min, and the holding time at maximum temperature was varied from 0 to 120 minutes. At the end of the holding time, the sample was taken out of the furnace and left to cool on a brick in room temperature. The temperature control of the furnace used, was tested several times with a type B thermocouple to check if the furnace was following the planned heating. During some experiments, the temperature was also measured with the extra thermocouple. In (Figure 5) the heating rates can be seen. During the time period for the experiments, the furnace had to be relined. After the relining, the temperature increases faster up to the set temperature. After cooling, the samples were milled with a tungsten carbide planetary disk mill to obtain a powder. Each sample were milled for 10 or 20 seconds at 700rpm. Drying of the powders at 250 °C overnight was necessary to remove any moisture. The samples were sealed when the temperature was still above 100 °C to minimize any moisture reacting with the powder again. To measure any amount of amorphous material, the internal standard method was used, described by Madsen et al. [31]. A crystalline standard, corundum (α-Al2O3), was added in an exact known amount to an exact known amount of the silica powder. The ratio of silica and spike were 4:1. In that way it was possibly to calculate the exact amount of quartz, corundum and cristobalite in the samples (and possibly other crystalline components) after XRD measurements. The remaining material were amorphous silica. The sample and the Al2O3 powder were thoroughly mixed, and backloading samples prepared for the XRD investigation. Three parallels were taken from each sample to check for consistency and repeatability of the XRD measurements. A Bruker D8 Focus powder diffractometer was used to analyze the samples, and Topas V5 software was used calculate the amount of quartz, cristobalite and amorphous silica afterwards.
Figure 5: Temperature measured during experiments and in between experiments with an external thermo couple. The heating profile of the furnace is stable with only minor variations.

To check if the milling procedure could create any amorphous material, and to ensure that the samples initially were 100 % quartz, unheated samples were tested. First, a sample of type A were milled for 10s and 60s to see if 60s milling would cause more transformed quartz, i.e. amorphous phase or cristobalite. This was not the case. Both the 10s and 60s were analyzed with XRD and contained 100 % quartz. This is agreement with similar tests done by Ringdalen et al. [32] on other quartz types. Then samples from all the quartz types were milled for 10s and analyzed with XRD. These experiments showed that the samples did contain some amorphous material to start with, like seen in Figure 6. For some tests, the samples contained up to 20 % amorphous material to start with. This is in disagreement with earlier investigation with Ringdalen et al. [32]. For some samples, several parallels were done to confirm the result. The results show that the method gives a variation in the results, and therefore the method is not accurate below 10 %. The method is still reliable for detecting large variations and overall trends.
Figure 6: The amount of phases in unheated quartz. The numbers indicated parallels of the same type tested.

Results and Discussion
Figure 7: Sample A11 heated to 1700 °C and held for 60 minutes, sample D heated to 1600 °C and held for 45 minutes, sample F heated to 1600 °C and held for 120 minutes, sample G3 heated to 1700 °C with no holding time. Pictures of the sample before and after heating of the sample can be seen. All the samples are around 10 g and 2-3cm large.

Four different industrial quartz types were heated in a Nabertherm rapid heating furnace to 1600 °C and 1700 °C. The samples were held at maximum temperature for a varying amount of time. The concentration of different phases was then measured with XRD. The following figures shows an example from each quartz type before and after heating. As can be seen in (Figure 7), there are large visual differences from unheated and heated quartz. Type A typically had a whiter appearance and were not crumbled during heating. Quartz type F did typically crumble during heating and were partly disintegrated. The appearance after heating was white as for type A. When considering the strength and tendency to crumble, type G where somewhere in the middle of type A and F. Type G also had a white appearance. The last type tested, type D did not show a white appearance after heating, but a more greyish appearance. This type had the largest impurity content of all the types tested. It also had a more red/brown appearance before heating, unlike the other types. A general trend is seen for all the samples. The amount of quartz is decreasing, and the amount of cristobalite is increasing. More variation is seen for the amount of amorphous phase, but there is still the same trend: it is decreasing as the holding time approaches 2 hours. Despite the same general trends there are large differences in the phase composition between the different quartz types. Type A, in (Figures 8 & 9), had transformed the least to amorphous phase and cristobalite for all holding times at 1600 °C. Two hours were necessary for 95 % of the quartz to transform for 10g sample. For type F, in Figure 10, the case is the opposite. Here, 95 % of the quartz had transformed just by heating the sample to 1600 °C and hold for 0 minutes for 10g sample. The amount of amorphous phase is lower for type F than for type A. Type D and G also transformed very rapidly, but slower than type F. Quartz type D had the largest amount of amorphous phase, which can imply that the reaction from amorphous phase to cristobalite is slower for this sample compared to the others. For sample G, the amount of phases are not consistent with the general trend. One explanation of this could be that the geological origin of quartz type G is very heterogeneous with large variations between one lump and another. This would give divergent results when testing only a few lumps from a large deposit.
Figure 8: The amount of phases of quartz type A after heating to 1600 °C and 1700 °C for sample size 10g and 100g. The dotted lines are the modeled amount of phases. Outliers are marked with a red circle.

Figure 9: The amount of phases of quartz type D after heating to 1600 °C and 1700 °C for sample size 10g. The dotted lines are the modeled amount of phases.

Figure 10: The amount of phases of quartz type F after heating to 1600 °C and 1700 °C for sample size 10g and 100g. The dotted lines are the modeled amount of phases.

Figure 11: The amount of phases of quartz type G after heating to 1600 °C and 1700 °C for sample size 10g and 100g. The dotted lines are the modeled amount of phases. Outliers are marked with a red circle.

If the amount of transformed quartz for the 10g particles heated to 1600 °C for all the four quartz types are considered, the increasing order of ability to transform is type A-D-G-F, by looking at the remaining quartz when the maximum temperature is reached. This order is the main trend for the other temperature and the other holding times as well, with some exceptions. In (Figure 8-11), the model and the experimental results are plotted for 1600 °C and 1700 °C, and for 10g and 100g particles for type A, D, F and G respectively. Clear outliers are marked with a red circle. No consistent trend is seen between the samples size and the amount of phases. This is in agreement with the findings from Kjelstadli [11] and suggests that the transformation starts throughout the sample and not from the surface and inwards. If the latter was the case, one should have observed a size effect between samples with different size. The standard deviation in the XRD measurements is calculated for each experiment and shown as error bars on each measurement in the figures. They show that there are some variations in the XRD-measurements for some samples, while the error is quite small for the majority of the samples. Based on the results obtained from the XRD measurements, the reaction rate has been modeled for the two-step reaction in Equation 3 where k1 and k2 are the rate constant for the transformation from quartz to amorphous phase, and from amorphous phase to cristobalite, respectively. The modelling has been done for both 1600 °C and 1700 °C, and for 10g samples and for 100g samples separately.
Assuming the reaction from quartz to cristobalite is a two-step reaction following two first order reactions, also assumed by Chaklader [23], and considering the amorphous phase as an intermediate product that is a product of the first reaction and a reactant in the second reaction, the reaction rates can be described by equation 4 to 6. These express the change in concentration over a time interval t. By using a numerical model and using the expressions in equation 4 to 6, the concentration after a time Δt can be calculated. The expressions used can be seen in equation 7 to 9. k1 and k2 are apparent rate constants for the reaction from quartz to amorphous, and amorphous to cristobalite, respectively. It is assumed that the k1 is independent of k2.
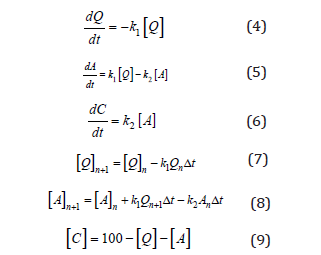
The most fitting k1 and k2 values, seen in Table 2, were found by minimizing the difference between the measured and the calculated values for the phase composition for each holding time measured. k1 and k2 are assumed to be dependent on the temperature as described by the Arrhenius relation in Equation 10, where k0 is the pre exponential factor, E is the activation energy for the transformation, T is the temperature in K and R is the gas constant. The activation energy for the different types for the reaction from quartz to amorphous and amorphous to cristobalite is listed in Table 3. These are calculated from the plots in (Figure 12), where ln k is plotted as a function of 1/T for all the different samples sizes and quartz types used.
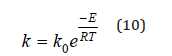
Table 2: k1 and k2 values for different quartz types, temperatures, and sizes. The sum of the difference in measured and modelled squared value for each phase are also given in the table where xm is the modelled value, xe is the experimental value and n is the number of measurements used for the optimization.

Table 3: Activation energy for the different quartz types and the reaction quartz to amorphous phase, Q→A, and amorphous phase to cristobalite, A→C. The negative activation energies are written in italic and are believed to be less reliable./p>

Figure 12: Plots comparing the different k1 and k2 values for different quartz types and sample sizes.

The k1 values for the quartz to amorphous phase transformation are given in Table 2 together with the sum of the squared difference between the modelled and experimental value for the amount of each phase. They are ranging from 0.002 to 0.184 for 1600 °C, and from 0.033 to 0.363 for 1700 °C as expected as the transformation speed is expected to increase with temperature. Compared to Chaklader’s [23] k1 value at 1560 °C (k1=0.001 min-1), the k1 values found in this study are in the same size range. The activation energy for the transformation from quartz to amorphous phase varies largely between the different quartz types. The activation energy lies between -244kJ/mol to 1317kJ/mol if both sample sizes are considered. However, if only the 10g samples are considered, type A has an activation energy of around 600kJ/mol, while type D and G have around 200kJ/mol and below. Type F had a negative activation energy for the 10g samples, while the 100g samples had an activation energy of around 500kJ/mol, which is more reliable. The negative activation energy could be due to unfitted experiments to measure it, as nearly all the measurement had a very small amount of quartz. Some of the values for the activation energy for the transformation from amorphous phase to cristobalite is negative. This means that the amorphous phase is more stable at high temperatures. It is speculated if this could be a sign of early melting i.e. completely amorphous phase. This has to be further investigated, and the k2 values are hence regarded to be less reliable. To estimate the variation and uncertainty in the method used for measuring the phase composition some experiments were performed up to three times to be able to see any variations in the samples and also the reliability of the method. This is seen in (Figures 8-11) as multiple measurements at the same time. In the experiments for type A, 10g, 1700 °C for 0 minutes three experiments were performed. A clear outlier is observed for one of the measurements. This could be due to natural variations in the quartz. For the other samples there is a smaller variation. In some cases, it is not clear which experiments are outliers. The value which gave the best fit with the model is chosen in these cases. Despite variation within one set of parallels, the variation between the experiment sets are larger. That indicates that the difference seen in phase composition between the quartz types tested in this study is due to parameters in different types of quartz. Also, the measurement method is sufficient precise to measure these differences. To check the effect of aluminum and alkali/alkali earth elements on the ability to transform from quartz, the amount of selected impurities and the remaining quartz after heating to 1600 °C and 0 minutes holding time is plotted in (Figures 13 & 14). Schneider [12] reported that increasing alkali and alkali earth impurities would speed up the transformation. When looking at (Figure 13) the same trend can be seen to some extent. If type D is not considered, the amount of remaining quartz decreases with the amount of alkali and alkali earth impurities. This implies that a higher content of alkali and alkali earth impurities does speed up the transformation from quartz. For sample D it could be a different effect, such as grain size or degree of crystallinity, that influences the ability to transform more than in the other samples. This must be further investigated. Both Chaklader [19] & Brown et al. [20] suggested that Al3+ impurities would catalyze the phase transformations from quartz to cristobalite. The amount of Al in the different quartz types are plotted against the amount of remaining quartz in (Figure 14). No correlation is observed between the two parameters at this level of Al impurities.
Figure 13: The amount of quartz after heating to 1600 °C as a function of the alkali and alkali earth impurity content in the different quartz types A, D, F and G. The number in the parenthesis indicates different parallels. In the top right graph, the x- axis below 0.012 is enlarged to show the differences between type A, F and G more clearly.

Figure 14: The amount of quartz after heating to 1600 °C as a function of the Al content in the different quartz types A, D, F and G. The number in parenthesis indicates different parallels. In the top right graph, the x-axis below 0.011 is enlarged to show the differences between type A, F and G more clearly.

Table 4: Grain size of the four different quartz types A, D, F and G.

Based on the geological findings by [27-30]the grain size of the different quartz types can be listed with decreasing grain size order given in Table 4. The ability to transform in decreasing order F-G-D-A, is not consistent with the decreasing grain size. If type D is not considered, a trend is seen for type A, F and G. Samples with larger grains have a higher ability to transform. This was the opposite of what was observed by [5,7,18]. Further and more thoroughly investigation of the grain size and the ability to transform must be done in order to conclude. It does not seem that one isolated property like grain size, alkali and alkali earth impurities or Al impurities in the quartz could explain the different ability to transform. Neither could the total impurity content presented in Table 1. Type A has the lowest impurity level and does transform the slowest, but type D has the highest impurity level but does not transform the fastest. If Wahl et al. [5] suggestion that the degree of crystallinity is affecting the ability to transform, one could argue that the more crystalline type with least impurities, least grain boundaries, least fluid inclusions, etc. all together would have the lowest ability to transform to amorphous silica and cristobalite. If lattice defects such as fluid inclusions, impurities, cracks, grain boundaries etc. serves as possible nucleation point for amorphous phase, a higher content of such will enhance phase transformation. This would also explain the lack of any size effect between 10g and 100g. The nucleation of new phase would then happen throughout the sample and be independent of size. This theory fits with the quartz types tested in this investigation. Type A has the lowest impurity content and has a low content of fluid inclusions and cracks [27]. It does also have the lowest ability to transform to amorphous phase and cristobalite compared to type D, F and G. Type F, which had the highest ability to transform, has larger deformed grains which possibly could cause lattice defects in the samples. This is a lack of crystallinity and could therefore enhance the ability for amorphous phase and cristobalite to form. The impurity content of type F, is not very high, but higher than type A. Type F also has more fluid inclusions than type A. For type D and G, the differences are not so large in the phase composition, but type they also have higher impurity content than A. Type G has a high amount of fluid inclusions in some parts, while type D has more grain boundaries due to smaller grains [2,30]. It is difficult to quantitatively determine which quartz type has the highest crystallinity, one could only make qualitatively explanations based on the information presented in this study. To further investigate, one should qualitatively measure the amount of fluid inclusions, impurities, cracks, grain boundaries etc. to more certain see the relationship between these properties and the phase transformations in quartz.
Since the amount of amorphous phase and cristobalite could affect both the permeability in the furnace by increasing the volume of the silica raw material, and affect the rate in reactions involving SiO2, it is important to know the ability of a quartz to transform to amorphous phase and cristobalite, before it is used in industrial production. An unsuitable quartz type could cause disturbance in the furnace environment, which again would cause a lower product yield. This has both economic and environmental consequences. The CO2 produced per metal unit will be higher, and the cost of producing one metal unit will increase. To know the behavior of quartz (and also other raw materials) before they are used industrially is important to know beforehand, to have a more predictable furnace operation and production.
Conclusion
- Different quartz types have different reaction rates. Some transform very easily to cristobalite while others take time. At 1600 °C and no holding time the amount of cristobalite is varying between 0 (type and 95 % (type F) for different quartz types.
- In general, k1 is larger than k2, meaning that the transformation from quartz to amorphous state is faster than the transformation from amorphous phase to cristobalite
- The k1 values for the experiments at 1600 °C vary from 0.002min-1 to 0.184min-1. At 1700 °C, the k1 values varies from 0.033min-1 to 0.363min-1.
- The activation energy for the transformation from quartz to amorphous phase varies. Type A has an activation energy around 600kJ/mol, while type D and G have around and below 200kJ/mol, if the 10g samples are considered at 1600 °C. For type F, the 100g samples are more reliable, and gives an activation energy of 500kJ/mol.
- There is no clear size effect for 10g and 100g particles. This indicates that the transformations are happening throughout the sample at the same time and do not start at the outer surface.
- There is a possible correlation between the amount of alkali and alkali earth impurities and the amount of quartz transformed. As the impurities increase so does the amount of transformed material.
- There is no clear correlation between the Al content and the ability to transform.
- The effect of grain size in the quartz is not clear and requires a deeper investigation.
- It is suspected that lack of crystallinity such as impurities, fluid inclusions, cracks, grain boundaries etc. could serve as nucleation point throughout the samples for nucleation of amorphous phase.
Method
- The method is reliable and repeatable since the variations between the different types are larger than the variation within one type
- Some quartz samples show large variations. The reason for this is most likely very heterogeneously deposits.
- The model is a first approximation to estimating the reaction rates and activation energies for these quartz types.
Acknowledgement
This paper is published by permission of Elkem AS. The Research Council of Norway and Elkem Technology are appreciated for their financial support through the project High Temp Quartz-Methods for characterization of quartz properties predicting performance in high-temperature applications with project number 252212.
References
- Schei A, Tuset JK, Tveit H (1998) Production of high silicon alloys. Tapir, Trondheim, Norway.
- Aasly K (2008) Properties and behavior of quartz for the silicon process. Doctoral Thesis, Norwegian University of Science and Technology, Trondheim, Norway.
- Heaney PJ, Prewitt CT, Gibbs GV (1994) Silica: physical behavior, geochemistry and materials applications. Mineralogical Society of America 29.
- Stevens SJ, Hand RJ (1997) Polymorphism of Silica. Chapman Hall, Georgia. pp. 2929-2935.
- Wahl FM, Grim RE, Graf RB (1961) Phase transformations in silica as examined by continuous X-ray diffraction. Am Mineral 46: 196-208.
- Ringdalen E (2014) Quartz properties in the silicon production. Silicon for the Chemical and Solar Industry XII, Norway.
- Lakshtanov DL, Sinogeikin SV, Bass JD (2007) High-temperature phase transitions and elasticity of silica polymorphs. Phys Chem Miner 34: 11-22.
- Richet P, Bottinga Y, Denielou L, Petitet JP, Tequi C (1982) Thermodynamic properties of quartz, cristobalite and amorphous SiO2: drop calorimetry measurements between 1000 and 1800K and a review from 0 to 2000K. Geochim Cosmochim Acta 46(12): 2639-2658.
- Marians CS, Hobbs LW (1990) Network properties of crystalline polymorphs of silica. J Non-Cryst Solids 124(2): 242-253.
- Chaklader ACD, Roberts A (1961) Transformation of quartz to cristobalite. J Amer Ceram Soc 44(1): 35-41.
- Kjelstadli ME (2016) Kinetics and mechanism of phase transformations from quartz to cristobalite. Master Thesis, Norwegian University of Science and Technology, Trondheim, Norway.
- Schneider H, Majdic A, Vasudevan R (1986) Kinetics of the quartz-cristobalite transformation in refractory-grade silica materials. Mater Sci Forum 7: 91-102.
- Presser V, and Nickel KG (2008) Silica on silicon carbide. Crit Rev Solid State Mater Sci 33(1): 1-99.
- Wiik K (1990) Kinetics of reactions between silica and carbon. Doctoral Thesis, Norwegian University of Science and Technology, Trondheim, Norway.
- Mitra S (1977) Kinetics of quartz- cristobalite transformation. Trans J Br Ceram Soc 76: 71-74.
- Breneman RC, Halloran JW (2014) Kinetics of cristobalite formation in sintered silica. J Am Ceram Soc 97(7): 2272-2278.
- Wagstaff FE (1968) Crystallization Kinetics of internally nucleated vitreous silica. J Am Ceram Soc 51(8): 449-453.
- Sosman RB (1965) The phases of silica. (2nd edn) Quinn & Boden Company Inc, New Jersey.
- Chaklader ACD (1961) Effect of trace Al2O3 on transformation of quartz to cristobalite. J Am Ceram Soc 44: 175-180.
- Brown SD, Kistler SS (1959) Devitrification of high-SiO2 glasses of the system Al2O3-SiO2. J Am Ceram Soc 42(6): 263-270.
- Dapiaggi M, Pagliari L, Pavese A, Sciascia L, Merli M, et al. (2015) The formation of silica high temperature polymorphs from quartz: Influence of grain size and mineralizing agents. J Eur Ceram Soc 35(16): 4547-4555.
- Pagliari L, Dapiaggi M, Pavese A, Francescon F (2013) A kinetic study of the quartz-cristobalite phase transition. J Eur Ceram Soc 33(15-16): 3403-3410.
- Chaklader ACD (1963) X-ray study of quartz-cristobalite transformation. J Am Ceram Soc 46(2): 66-71.
- Edfelt H (2018) The effect of fine material on gas flow in the charge for silicon production. Norwegian University of Science and Technology, Trondheim, Norway.
- Tangstad M, Safarian J, Bao S, Valderhaug A, Ringdalen E (2019) Reaction rates of 2SiO2+SiC=3SiO+CO in pellets at elevated temperatures. Crimson Publ 3(2): 385-395.
- Folstad MB (2017) Effect of different polymorphs of SiO2 on the reaction between SiO2 and SiC in Si production. Master Thesis, Norwegian University of Science and Technology, Trondheim, Norway.
- Veisal BT (2018) Test data presented at the internal meeting in high-temp quartz project, Norway.
- Seljeset A (2018) Trace element study of quartz from Nasafjell. Master Thesis, Norwegian University of Science and Technology, Trondheim, Norway.
- Filipowicz A (2018) Characterization of quartz raw material for ferrosilicon and silicon alloy applications. Master Thesis, Aarhus University, Denmark.
- Pevik JA (2015) Geological and mineralogical characterization of the upper part of the Gamasfjell quartzite at the vaggecearu mountain. Master Thesis, Norway.
- Madsen IC, Scarlett NVY, Kern A (2011) Description and survey of methodologies for the determination of amorphous content via X-ray powder diffraction. Z Für Krist 226(12): 944-955.
- Ringdalen E, Tolchard J, Thomassen E (2017) Evaluation of method used to measure amount of phases in silica. Sintef Materials and Chemistry, Trondheim, Norway.
© 2020 Karin FjeldstadJusnes. This is an open access article distributed under the terms of the Creative Commons Attribution License , which permits unrestricted use, distribution, and build upon your work non-commercially.
Editor In Chief


.jpg)


Signup for Newsletter

Quick Links
 Editorial Board Registrations
 Submit your Article
 Refer a Friend
 Advertise With Us
Our Recent Edition

.jpg)


Top Editors


.jpg)


.bmp)
.jpg)
.png)
.jpg)


.jpg)


.png)

.png)


.png)


Financial Support

Sponsors

Latest e-Books

Latest Video

 a Creative Commons Attribution 4.0 International License. Based on a work at www.crimsonpublishers.com.
Best viewed in
a Creative Commons Attribution 4.0 International License. Based on a work at www.crimsonpublishers.com.
Best viewed in