
- About Us
- Information
-

The Author ensures that the research has been conducted responsibly and ethically with adherence to all relevant regulations. read more..
- For Authors
- For Reviewer
- Manuscript Guidelines
- Membership
- Publication Ethics
-
- Journals
- Reprints
- e-Books
- Videos
- Policies
- Contact Us
 COVID-19
- Submissions


Full Text
Annals of Chemical Science Research
A Statistical Study of the Tensile Strength Mechanical Property of A 100gsm A4 Photocopy Paper
Katerina Chryssou* and Eugenia Lampi
General Chemical State Laboratory, B’ Chemical Division of Athens, Department A’ Tsocha 16, Greece
*Corresponding author:Katerina Chryssou, General Chemical State Laboratory, B’ Chemical Division of Athens, Department A’ Tsocha 16, 11521 Athens, Greece
Submission: October 16, 2023;Published: October 26, 2023

Volume4 Issue3October , 2023
Abstract
An A4 100g/m2 copy paper Multi-paper Fabriano was tested for its tensile strength in both directions MD (machine direction) and CD (cross direction). The mean value of the tensile strength MD 4.91KN/m was compared to the mean value of the tensile strength CD 3.28ΚΝ/m using one-sample T-test. The means of the two properties were found statistically significantly different from zero. The texperimental=81.110 for MD tensile strength was greater than ttheoretical=2.262. Also, the texperimental=43.540 for CD tensile strength was greater than ttheoretical=2.262, for 95% confidence interval and 9 degrees of freedom. The two means of tensile strength MD and CD were found not equal. The one-way ANOVA was also performed and compared the amount of variation between groups with the amount of variation within groups. The variance of among groups was greater than that of within groups, i.e., 13.350>0.456, and thus the null hypothesis was rejected that the means of tensile strength MD and CD were equal. The tests were performed at a significant level of p<0.05. Finally, the formula for simple linear regression was calculated to be y=0.37562094*x+ 1.432949943, whereas y was the dependent variable, the CD tensile strength and x was the independent variable, the MD tensile strength.
Keywords:A4 copy paper; Tensile strength; Machine direction; Cross direction; Compare means; One- Sample T-test; One-way ANOVA; Least-squares line; Null hypothesis; P-value
Introduction
A t-test can be used to compare the means of two groups of parameters. It is used to determine whether a process actually has an effect on the sample population of interest, or whether two groups are different from one another [1]. The t-test is used to determine whether the means of two groups are equal to each other. Of course, the assumption for the test is that both groups are sampled from normal distributions with equal variances. The classical version of the Central Limit Theorem taught in statistics courses deals with averages of identically distributed data. This suffices for the t-test but not for linear regression, where the regression coefficients are computed from averages of the outcome multiplied by the covariates [2].
In this study the tensile strengths in KN/m of an A4 copy paper sample across the machine direction (MD) and across the cross direction (CD), are tested using one-sample T-test, and also one-way ANOVA, (Analysis of variance), which has one independent variable [3,4].
Materials and Methods
Instruments and materials
The tensile testing machine, Zwick Roell Z2.5 BT1-FR 2.5th D14/2008, S.N. 181435/2008, was used for measuring the tensile strength of the A4 copy paper sample. The machine extended the paper test pieces of dimensions 15mmx210mm at 20mm/min constant rate of elongation and measured the maximum tensile force. The machine had a strength force of 2.5KN. The machine was connected with a computer LG. Two clamps for holding the paper test pieces of 15mm width were used. The clamps grab the test pieces firmly along a straight line across the full width of the test pieces and adjusted the clamping force pneumatically. A guillotine, IDEAL 1043 GS made in Germany, was used for cutting the paper test pieces to dimensions of 15mmx210mm.
A conditioning chamber that was capable of providing and maintaining standard conditions of temperature and humidity, where the paper test pieces were pre-conditioned at 23 °C ± 2 °C and 30%r.h.±5%r.h. for 24hours and were conditioned at 23 °C ± 1 °C and 50%r.h.±2%r.h for 16hours. The paper samples were conditioned for 16 hours at 23±1 °C temperature and 50%±2% relative humidity in accordance with the ISO 187 standard [5] and were tested in the same conditioning atmosphere. IBM SPSS data analysis software was used throughout this study, as well as the Excel spreadsheet.
Results and Discussion
The tensile strength of the 100gsm A4 copy paper sample Multipaper Fabriano, was evaluated according to ISO/DIS 1924- 2 [6]. We have evaluated the maximum tensile force for each test piece of the group of ten measurements. We then calculated the mean maximum tensile force and then the tensile strength from the expression:
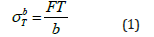
where σbT was the tensile strength in KN/m, FT was the mean maximum tensile force in N and b was the width of the test piece in millimetres, i.e., 15mm (Table 1).
Table 1:Tensile force values in KN/m across the Machine Direction (MD) and also across the Counter Machine Direction or Cross Direction (CD) of the 100gsm A4 copy paper sample Multipaper Fabriano.

Comparison of the means of the two tensile forces across the MD direction and the CD direction using one-sample T-test
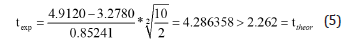
In Figure 1, the sig (2-tailed) was equal to the probability of observing a greater absolute value of t under the null hypothesis. In SPSS Statistics used, the p-value [7] was less than the pre-specified alpha level of 0.05, i.e., 0.000<0.05 and we concluded that the means were statistically significantly different from zero. Because the 95% confidence interval of the difference did not include one, there was the suggestion that they were not equal the means [8]. Also, in the second table in Figure 1 the value of t experimental for the MD tensile strength was greater than the value of t theoretical, i.e. texp.=81.110>ttheor.=2.262, for 95% confidence level and 9 degrees of freedom. Also, for the CD tensile strength texp.=43.540>ttheor.=2.262 for 95% confidence level and 9 degrees of freedom. For both tensile MD and tensile CD strengths there was a significant difference between the two means, which may have had indicated a systematic error [9].
Figure 1:One-Sample T-test was performed for comparison of the means of the tensile forces across the machine direction (MD), and the counter machine direction (CD).

Comparison of means of the two tensile forces across the MD direction and the CD direction using One-Way ANOVA
Then, one-way ANOVA was performed to compare if the means of the tensile strengths of MD and CD direction were equal (Figure 2). The dependent list (Table 2) was the tensile strength of both MD and CD and to the Factor box was R (Table 2) which was the group of numbers 1 and 2 relating to tensile strength MD and CD respectively. This specific test considered here was called analysis of variance (ANOVA) and was a test of hypothesis that was appropriate to compare means of a continuous variable in the two independent comparison groups of tensile MD and CD. ANOVA was used to compare differences of means among the two groups of tensile strength MD and CD [10]. ANOVA compared the amount of variation between groups with the amount of variation within groups.
Figure 2:One –way ANOVA for comparing the means of the tensile strength MD and CD, analysis table.

Table 2:Data of the ANOVA, showing the tensile force values in KN/m across the Machine Direction (MD) and also across the Counter Machine Direction or Cross Direction (CD) of the 100gsm A4 copy paper sample Multipaper Fabriano. This table was used for presenting the dependent parameter in performing one –way ANOVA, and the Factor R.

The Analysis of Variance (ANOVA) in Figure 2, was a statistical procedure in which we draw population inferences about the factor (variable) R from our sample using statistics obtained by dividing the sample variance SST=SSA+SSE=13.350+0.456=13.806, by the variance SSA=13.350 among groups (stations of factor R) into which the sample population was divided according to the factor R and the dispersion between variance SSE=0.456 within groups, stations. Because the MSA (measure of sampling adequancy) (between groups), i.e.

was an estimate of the sample population variance s^2 due to the variability of the station mean values of the factor R, if the mean values of the stations considered were not equal among themselves then the variation between the corresponding sample mean values was expected to be large, and consequently the value of the MSA (p<0.05) should be high, as it was actually, i.e. 13.350 (Table two in Figure 2) [11]. The MSE (mean square error) (within groups), i.e.

gave an estimate of the sample population variance s^2 that was not explained by the variability of the station mean values of the factor R. The lower the MSE value, i.e., 0.025 was, the higher was the accuracy of our prediction, and thus there was excellent match between the actual and the predicted data set. The mean squared error (MSE) of predictions was a good metric used for assessing our model’s accuracy.
In the first table shown in Figure 2, the 95% confidence interval for mean estimated the mean response for each group i.e., 1 which was the tensile force MD and 2 which was the tensile force CD. The difference in upper bound and lower bound values indicated that there was a difference in population means between the two group levels. Also, Fexp< Ftheor., i.e.
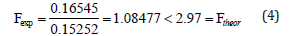
so, the standard deviations of the two groups of tensile strength did not show any significant difference. Then Fexp< Ftheor. from the first table in Figure 2, i.e.
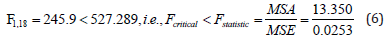
which indicated that there was a significant difference between the means of tensile strength MD and tensile strength CD. The second table shown in Figure 2 reflected the results of the ANOVA analysis which enabled us to determine the difference between the two group means. The results reflected a statistically significant p-value i.e., p=0.000 (p<0.05) and showed that the difference between the two tensile strength groups MD and CD was significantly related to the mean of both tensile strengths MD and CD. In this table of Figure 2 the p-value associated with the F was smaller than 0.05, i.e., p=0.000 and thus the null hypothesis was rejected and the alternative hypothesis was supported. Since the null hypothesis was rejected, we concluded that the means of the two groups of tensile strength across MD and CD were not equal [12]. We observed that for the ANOVA p-value (p=0.000<0.05) was valid, therefore at a significance level of a=0.05, there were statistically significant differences between the tensile strengths of MD and CD groups.
ANOVA tested whether the average amount of variation between groups was greater than the average amount of variation within groups. That was the case in this study where the sum of squares between groups in the one-way ANOVA test was found to be 13.350 and the sum of squares within groups was found to be 0.456. In the ANOVA the null hypothesis was rejected, since the variance of among groups was greater than that of within groups (13.350>0.456). That was also indicated because the F statistic was greater than the critical value F. The null hypothesis was rejected at a level of significance 0.05/one-sided by significant difference between the F statistic and F critical values (Fstatistic>Fcritical). The ANOVA table has shown that
There was thus a significant effect of tensile strength MD on tensile strength CD [13].
The derivation of least-squares line (Table 3)
The line generated by the least-squares method was the one that minimized the sum of the squares of the residuals from all of the points [14,15]. The quantities Sxx, Syy and Sxy were calculated to be:
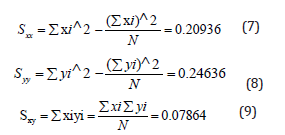
Table 3:Experimental data for the tensile strengths MD and CD of a 100gsm A4 copy paper sample Multipaper Fabriano.

where xi and yi were individual pairs of data for x and y, N was the number of pairs of data used in preparing the calibration curve, and x− , and y− were the average values for the variables x and y. The following quantities were derived from the quantities Sxx, Syy, and Sxy, [16,17] such as the slope of the line m:
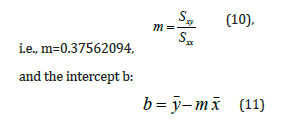
i.e., b=1.432949943, where x− was calculated to be 4.912 and y− was calculated to be 3.278. Thus, the equation for the least-squares line was found to be:
y=0.37562094*x + 1.432949943 (12) where x was the MD tensile strength, and y was the CD tensile strength.
In Figure 3, there was presented the graph of data, regression analysis and R^2, of the tensile force CD in KN/m versus tensile force MD in KN/m. The formula for simple linear regression was y=0.37562094*x+ 1.432949943 where y was the response (dependent) variable (CD tensile strength) and x was the predictor (independent) [18] variable (MD tensile strength), m=0.37562094 was the estimated slope and b=1.432949943 was the estimated intercept.
Figure 3:The least squares line for tensile strength MD versus tensile strength CD.

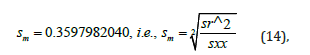
Also, the standard deviation about regression sr [19] was calculated to be:
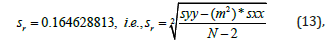
whereas N=10, The standard deviation of the slope sm [20] was calculated to be:
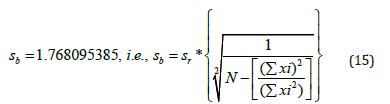
The standard deviation of the intercept sb [21] was calculated to be:
It should be emphasized that the least squares method was applied in this study with the following two assumptions. First, that the measured values of y (CD tensile strength) corresponded to the determined values of x (MD tensile strength), error-free, and that the error in the values of y, expressed as the variance of y, was independent of the magnitude of x [22,23].
Conclusion
In this study, the null hypothesis was rejected that the means of the tensile strengths of MD and CD direction were equal and the alternative hypothesis was supported using one way ANOVA. The equation for the least squares regression line was calculated in Excel. We have performed the tensile strength method and the statistical assumption that there were statistically significant differences between the two tensile strength means of MD and CD although inconvenient could not be neglected. It may have been that the sampling distribution may have not followed a normal distribution and thus the t-test may have not satisfied the condition of normality. The condition of equal variances may have been violated also. The conclusion was though that the tensile strength in the MD direction had a significant effect on the tensile strength in the CD direction, and that the difference between the means of the two tensile strength groups MD and CD was significantly related to both the tensile strength values of MD and CD.
References
- Tae Kyun Kim (2015) T test as a parametric statistic. Korean J Anesthoesiol 68(6): 540-546.
- Thomas Lumley, Paula Diehr, Scott Emerson, Lu Chen (2002) The Importance of the normality assumption in large public health data sets. Annu Rev Public Health 23: 151-169.
- Fahad I Alkhudhairy (2017) The effect of curing intensity on mechanical properties of different bulk-fill composite resins. Clin Cosmet Investig Dent 9: 1-6.
- Park, Hun Myoung (2009) Comparing group means: T-tests and One-way ANOVA Using STATA, SAS, R, and SPSS. The University Information Technology Services (UITS) Center for Statistical and Mathematical Computing, Indiana University, USA, pp. 1-51.
- ISO 187 (2022) Paper, board and pulps-standard atmosphere for conditioning and testing and procedure for monitoring the atmosphere and conditioning of samples, (3rd edn), pp. 1-7.
- ISO 1924-2:2008 Paper and board-determination of tensile properties-Part 2: Constant rate of elongation method (20mm/min), pp. 1-12.
- Berner D, Amrhein V (2022) Why and how we should join the shift from significance testing to estimation. J Evol Biol 35(6): 777-787.
- Newcombe RG (1998) Two-sided confidence intervals for the single proportion: Comparison of seven methods. Statist Med 17(8): 857-872.
- Roger Barlow (2002) Systematic errors: Facts and fictions. High Energy Physics-Experiment. ArXiv: Preprint.
- Saffinaz Anuar NI, Zakaria S, Sinyee Gan, Chin Hua Chia, Chunhong Wang, Jalaluddin Harun (2019) Comparison of the morphological and mechanical properties of oil palm EFB fibres and kenaf fibres in nonwoven reinforced composites. Ind Crops Prod 127: 55-65.
- Lorenzo-Seva U, Ferrando PJ (2021) MSA: The forgotten index for identifying inappropriate items before computing exploratory item factor analysis. Methodol 17(4): 296-306.
- Mardiana, Arief Wibowo, Mahmudah, Pipit Festi W (2021) A comparison of M-Estimation and S-Estimation on the factors affecting IR DHF in East Java in 2017. IJPH 16(3): 349-362.
- Wahlstrom T (2013) Predictions of MD and CD tensile property profiles. In Advances in Pulp and Paper Research, Cambridge, Trans of the 15th Fund Res Symp Cambridge, pp. 673-710.
- Joanne Cornbleet P, Nathan Gochman (1979) Incorrect least-squares regression coefficients in method-comparison analysis. Clin Chem 25(3): 432-438.
- Daniel C Harris (1998) Nonlinear least-squares curve fitting with microsoft excel solver. J Chem Educ 75(1): 119-121.
- Michael Krystek, Mathias Anton (2007) A weighted total least-squares algorithm for fitting a straight line. Meas Sci Technol 18(11): 3438-3442.
- Douglas A Skoog, Donald M West, James Holler F (1996) Fundamentals of analytical chemistry. (7th edn), Saunders College Publishing, Philadelphia, USA.
- Kumari Khushbu, Yadav Suniti (2018) Linear regression analysis study. J pract 4(1): 33-36.
- Holger Schielzeth (2010) Simple means to improve the interpretability of regression coefficients. Methods Ecol Evol 1(2): 103-113.
- Abrahams SC, Keve KT (1971) Normal probability plot analysis of error in measured and derived quantities and standard deviations. Acta Cryst 27(2): 157-165.
- Norman M. Evensen DY, Martinez ML, Delgado JDB (2004) Unified equations for the slope, intercept and standard errors of the best straight line. Am J Phys 72(3): 367-375.
- Schulte-Hostedde AI, Bertram Zinner, John S Millar, Graham J Hickling (2005) Restitution of mass-size residuals: Validating body condition indices. Ecol 86(1): 155-163.
- Douglas S.Riggs, Joseph A Guarnieri, Sidney Addelman (1978) Fitting straight lines when both variables are subject to error. Life Sci 22(13-15): 1305-1360.
© 2023 Katerina Chryssou. This is an open access article distributed under the terms of the Creative Commons Attribution License , which permits unrestricted use, distribution, and build upon your work non-commercially.
Editor In Chief


.jpg)


Signup for Newsletter

Quick Links
 Editorial Board Registrations
 Submit your Article
 Refer a Friend
 Advertise With Us
Our Recent Edition

.jpg)


Top Editors


.jpg)


.bmp)
.jpg)
.png)
.jpg)


.jpg)


.png)

.png)


.png)


Financial Support

Sponsors

Latest e-Books

Latest Video

 a Creative Commons Attribution 4.0 International License. Based on a work at www.crimsonpublishers.com.
Best viewed in
a Creative Commons Attribution 4.0 International License. Based on a work at www.crimsonpublishers.com.
Best viewed in