
- About Us
- Information
-

The Author ensures that the research has been conducted responsibly and ethically with adherence to all relevant regulations. read more..
- For Authors
- For Reviewer
- Manuscript Guidelines
- Membership
- Publication Ethics
-
- Journals
- Reprints
- e-Books
- Videos
- Policies
- Contact Us
 COVID-19
- Submissions


Full Text
Trends in Textile Engineering & Fashion Technology
An Intelligent Skin Color Detection Method based on Fuzzy C-Means with Big Data
Chih Huang Yen*
National Cheng Kung University, Taiwan
*Corresponding author: Chih Huang Yen, National Cheng Kung University No.7, TaFa RD, Render DIST, Tainan, Taiwan 71747
Submission: February 27, 2018; Published: March 12, 2018

ISSN: 2578-0271 Volume1 Issue5
Abstract
When purchasing clothes, people always rely on intuition or follow the fashion trend for color selection. People never understand how to select the right color to match with them. A systematic method for detecting skin colors for clothes is proposed in this study. In the method, face recognition with considerable images was first discussed. Next, the innovative method of capturing color with points was used along with making complexion aggregated analysis. In the study, RGB was conversed to be the Lab space for the collected data which were then analyzed based on fuzzy clustering to get grouping. The results are presented in the final grouping lab value and RGB index. In addition, a Face RGB program was constructed to capture color automatically from 12000 images. Some 17 clustering results were obtained by the Color FCM program constructed in this study. The results can be used to select the customized color of clothes and an expert system can further be made in the future.
Keywords: Skin color; Clothes; Fuzzy C-Means; Big data
Introduction
There is a lot of discussion about complexion research in the previous image processing. Related information technology has been booming because the popularization of computers for 40 years. Therefore, portraits and identification-related to applications are relatively active. Other algorithms normalized a gallery of face images, and compress the face data that only saves data in the image. This is considered useful for face recognition. A probe image is then compared with the face data. One of the earliest successful systems is based on template matching techniques [1] applied to a set of salient facial features, providing a sort of compressed face representation.
Color studies in the past focused on face recognition only. It explored the identification of a person's face or tried to find out the typology of people [2]. In the clothes market, it is difficult for women to find out the right color to match their skin. Definitely, it is the desire that women want to achieve However, knowing one's skin color is another big issue for people.
The main purpose of this study is to get color mode for women through innovated program to analyze a large amount of digital images. Finally, another program for clustering information based on Fuzzy c-means theory helps to get the result of grouping.
There is a lot of color studying data, such as clothes application with skin color. Hsiao et al. [3] used the skin color detection with color harmony theory and created an expert system. The system could help people input their skin color and get the right option for clothes color. There is an evaluation procedure inside and helps people with decision making.
Research process is shown in Figure 1. Moreover, it is described as follows,
1. First, collect as much data as possible through the internet or from digital devices (such as scanners, cameras or smart phones). - A huge data were collected from the internet.
2. Input the picture into program "Face RGB" for human-face extraction via face recognition; on the other hand, facial features are generated for information analysis.
3. Perform the identification of six points based on their relative positions.
4. After colour capture of the six points for the action, a debugging process in the program is used to delete outliers.
5. The RGB information is captured by the inner program and automatically converted into Lab values.
6. The colour FCM program is adopted for clustering the colour data (Lab) gathered using the Face RGB program. It uses fuzzy theory [4] to do the clustering.
7. Each clustering group has designated number, or an iterative clustering number is automatically generated by the program.
8. Grouping results can be presented in the 3D-space scatter plot and the seat instructions are marked.
Theory foundation
Data clustering is the process of dividing data elements into classes or clusters so that items in the same class are as similar process of assigning these membership levels, and then using them as possible. These indicate that the strength of the association to assign data elements to one or more clusters [5] (Figure 1). between data element and a particular cluster. Fuzzy clustering is a process of assigning these membership levels, and then using them to assign data elements to one or more clusters [5] (Figure 1).
Figure 1: The procedure of the research study. There are 3 programs to deal with data filter, colour detection and data clustering.

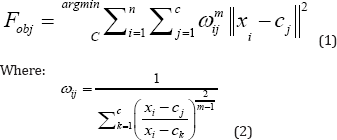
Fuzzy c-means has been a very important tool for image processing in clustering objects in an image. In the 70's, mathematicians introduced the spatial term into the FCM algorithm to improve the accuracy of clustering under noise [6]. Furthermore, FCM algorithms have been used to distinguish between different activities using image-based features such as the Hu and the Zernike Moments [7]. The FCM algorithm attempts to partition a finite collection of n elements X = {x1,x2,....,xn} into a collection of c fuzzy clusters with respect to some given criterion. Given a finite set of data, the algorithm returns a list of C cluster centres C = {cl, c2,...., cc} and a partition matrix,

Where Wii each element xi tells the degree to which element belongs to cluster ci . Refer to (1)-(2) the FCM aims to minimize an objective function [4]:
In fuzzy clustering, every point has a degree of belonging to clusters, as in fuzzy logic, rather than belonging completely to just one cluster. Thus, points on the edge of a cluster may be in the cluster to a lesser degree than points in the center of cluster. An overview and comparison of different fuzzy clustering algorithms is available.
Any point x has a set of coefficients which given the degree of being in the kth cluster wk (x). Refer to (3), with fuzzy c-means, the centroid of a cluster is the mean of all points, weighted by their degree of belonging to the cluster:
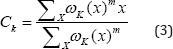
The degree of belonging, wk(x), is related inversely to the distance from x to the cluster center as calculated on the previous pass. It also depends on a parameter m that controls how much weight is given to the closest center [4].
Implementation Method and Procedure Face RGB
Face RGB
In the research of Yoshikawa [8] for the skin-whitening project for Japanese women in SHISEIDO Co., Ltd., Tokyo, Japan, a spectrometer is used for capturing skin colour. Its measurement is as the forehead, cheek and jaw line. This study extends this approach to the six points for the basic operations of facial skin- color capture. It will produce identification points after feature recognition, through calculation and design relative position to set at six locations. Figure 2 shows each feature point described by the relative position, six distributions on the forehead (6) and four points around the upper and lower cheek (1-4) and chin (5). The intercepted six points will be different in each image based on the beginning of human facial feature recognition points.
Color FCM
In this study, we collected over 13000 female images. In the first step, we used Image Comparing program to filter it. Human skin color captured by Face RGB program was being operated. The available data is 12,588, so we can collect more than 12000 items of LAB color. For clustering, based on Fuzzy theory to create Color FCM program (Figure 2).
The intuition behind this approach is that spreading out the k initial cluster centers is a good thing. The first cluster center is chosen uniformly at random from the data points that are being clustered After that, each subsequent cluster center is chosen from the remaining data points with probability proportional to its squared distance from the point's closest existing cluster center.
Figure 2: The result of Face RGB, it is six point color captured from one image.

The exact algorithm is as follows:
1. Choose one center uniformly randomly from the data points.
2. For each data point x, compute D(x), the distance between x and the nearest center that has already been chosen.
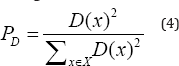
3. Choose one new data point randomly as a new center, using a weighted probability distribution where a point x is chosen with probability proportional to D(x)2. Results & Discussion
4. Repeat Steps 2 and 3 until k centers have been chosen.
5. Now that the initial centers have been chosen, proceed with standard Fuzzy C-means [9].
Refer to (4), it is the formula of distance percentage. It is the key issue in program editing, and will be the final decision.
Results & Discussion
Figure 3: There are 3 programs in the case study. It presented all details and results by each step, finally classify the image and see belonged group. Classification could be a favor to create expert system for next step.

Figure 3 shows facial skin color was captured via Face RGB from six points among 12,000 female images. The course of the study is to design with debug mechanism. It may interfere with the non-face color removed, sorted out facial skin color information. 11088 data were obtained after Face RGB, and followed by the theoretical basis of fuzzy clustering, and the development of Color FCM program, the program combined Face RGB information obtained by the calculation program. Finally, 17 groups were obtained as the result. Figure 4 presents the result in 3D plotter.
Results of the study for facial reference can also be used in this program with logical operators. Other countries or regions of skin color research and discussion can also be adopted. It could be an issue of clothes and skin color in local. Design automation program is used for computing and organizing big data, but also can be applied to daily photographic record of analysis and observation. Therefore, the huge amount of data that comes by daily cumulative record, and the huge amount of data calculation can be repeated again and again in the calculation and generation process (Figure 4). This way such information is bound to increase the reference value.
Figure 4: There is another option in Colour FCM. It can show 17 groups in 3D space to easily understand the clustering distribution.

Big data is a broad term for data sets so large or complex that traditional data processing applications are inadequate. Challenges include analysis, capture, data duration, search, sharing, storage, transfer, visualization, and information privacy. The term often refers simply to the use of predictive analytics or other certain advanced methods to extract value from data, and seldom to a particular size of data set. Accuracy in big data may lead to more confident decision making. And better decisions can mean greater operational efficiency, cost reduction and reduced risk (Figure 3).
Analysis of data sets can find new correlations, to "spot business trends, prevent diseases, and combat crime and so on.” Scientists, business executives, practitioners of media and advertising and governments alike regularly meet difficulties with large data sets in areas including Internet search, finance and business informatics. Scientists encounter limitations in e-Science work, including meteorology, genomics, connectomics, complex physics simulations, and biological and environmental research [10].
Conclusion
In the study, we created 3 programs to do the facial skin color study. Simply based on the intelligent way, huge data and even complicated issue was calculated. Owing to the reason that it could be a recording cycle to indicate the trend everywhere and every time, the procedure is more important than the result. The study also hopes that it could be applied into big data type and IOT (internet of things).
After the study, it can be seen that people will get their skin color and know the color location and thus choose the right color for matching. In the future, female will be aware of their skin color grouping. Furthermore, each group can be the next color to makeup colour; do color harmony or aesthetic applications of computing. Also expert systems can be done to develop and extending this research in the future. Finally, it can be applied in the clothes market. There will be a great contribution and value.
References
- Brunelli R (2009) Template matching techniques in computer vision: theory and practice. Wiley.
- Hsu RL, Mohamed AM, Jain AK (2002) Face detection in colour image. IEEE Transactions on Pattern Analysis and Machine Intelligence 24(5): 696-706.
- Hsiao SW, Chiu FY, Hsu HS (2008) A computer assisted colour selection system based on aesthetic measure for colour harmony and fuzzy logic theory. Colour Research Application 33(5): 411-423.
- Nock R, Nielsen F (2006) On weighting custering. IEEE Transactions on Pattern Analysis and Machine Intelligence 28(8): 1-13.
- Bezdek, James C (1981) Pattern recognition with fuzzy objective function algorithms. Advanced Applications in Pattern Recognition.
- Banerjee T (2014) Day or night activity recognition from video using fuzzy clustering techniques. IEEE Transactions on Fuzzy Systems 22(3): 483-493.
- Alireza K, Kashani A, Milani N, Akhlaghi P, Khezri K (2008) Robust color classification using fuzzy reasoning and genetic algorithms in robocup soccer leagues. Robot Soccer World Cup 5001: 548-555.
- Yoshikawa H, Kikuchi K, Kim J, Nishikawa S, Yaguchi H, et al. (2007) Effect of the chromatic components on the whiteness evaluation of skin. Midterm Meeting of Congress of International Colour Association (AIC) pp. 203-206.
- Arthur D, Vassilvitskii S (2007) K-means++: The advantages of careful seeding. In: Proceedings of the eighteenth annual ACM-SIAM symposium on discrete algorithms. Society for Industrial and Applied Mathematics pp. 1027-1035.
- Reichman OJ, Jones MB, Schildhauer MP (2011) Challenges and opportunities of open data in ecology. Science 331 (6017): 703-705.
© 2018 Chih Huang Yen. This is an open access article distributed under the terms of the Creative Commons Attribution License , which permits unrestricted use, distribution, and build upon your work non-commercially.
Editor In Chief


.jpg)


Signup for Newsletter

Quick Links
 Editorial Board Registrations
 Submit your Article
 Refer a Friend
 Advertise With Us
Our Recent Edition

.jpg)


Top Editors


.jpg)


.bmp)
.jpg)
.png)
.jpg)


.jpg)


.png)

.png)


.png)


Financial Support

Sponsors

Latest e-Books

Latest Video

 a Creative Commons Attribution 4.0 International License. Based on a work at www.crimsonpublishers.com.
Best viewed in
a Creative Commons Attribution 4.0 International License. Based on a work at www.crimsonpublishers.com.
Best viewed in