- Submissions

Full Text
Trends in Textile Engineering & Fashion Technology
Global Economic Scenario of Industrial and Technical Textiles
Badri Narayanan G*
Affiliate Instructor, School of Environmental and Forestry Sciences, University of Washington Seattle
*Corresponding author: Badri Narayanan G, Affiliate Instructor, School of Environmental and FOrestry Sciences, University of Washington Seattle
Submission: December 21, 2017; Published: January 18, 2018

ISSN: 2578-0271 Volume1 Issue1
Overview
A. Economic Structure of Indian Textile Industry
B. Technical Textiles in India: Introduction
C. Policy Overview for Technical Textiles in India
D. Global Indutech Market: The case of USA
E. Global Tariff/Trade Policies
F. Unorganized Firms in Technical Textiles
G. Economy-wide effects of Growth in TT
H. Conclusions
Indian Textile Sector: An Intro
A. Second largest employer
B. 14% to industrial production, 4% to the GDP, and 17% to the country’s export earnings
C. Positive growth trends despite global crisis
D. Predominantly SSI/unorganized in employment (Table 1)(Figure 1-3)
Figure 1: Trends in textile exports.
Source: DGFT
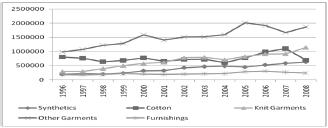
Figure 2: Growth trends in textile exports.
Source: DGFT
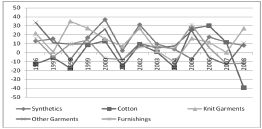
Figure 3: Recent trends in textile export shares in India's total exports.
Export shares:Stable/declining despite big boost from ATC. Are we missing something? Source: DGFT
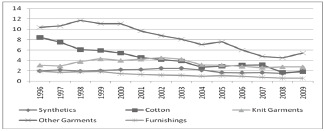
Table 1: Author's calculations from ASI, ministry of micro, small and medium enterprises (MSME, 2002) and NSSO (2008).

Technical Textiles in India
A. National Technology mission on technical textiles (Tex-Summit 2007): XI 5-year Plan
B. Consumption of technical textiles in India: highly import-intensive: mainly hi-tech items like medical implants
C. Export/Growth potential segments: “commodity” types like Stuffed toys, mainly produced by SSI; also hi- tech Products: Protech, Oekotech, Sportech, Geotech and Packtech
D. Size: Rs. 296bn in 2007-08 may rise to Rs 780bn in 2014-15; 2011-12: Rs. 570bn è on track! May grow faster than inflation!
E. Exports: Rs 29bn, Imports: Rs 45bn in 2007-08
Policy Overview in India
A. Since early 2000’s: NTP, ECTT
B. Excise structure of synthetics being reduced (consistent with our elasticity estimates)
C. Customs Concession: 5% basic duty on m/cs
D. Focus Product Scheme: 2% Duty credit scrip
E. TUFS: 5% interest reimbursement & 10% capital subsidy for some machines, till 2012, since 2007.
F. Dereservation of sanitary napkins and diapers
G. Recognition of Centers of Excellence for specific segments
H. Other Schemes: Export Promotion Capital Goods, Duty-Free Import Authorization; though Duty Entitlement Passbook scheme was replaced by Duty Drawback in 2011: WTO compliance issues.
I. No restricted/prohibited/STE items in tech textiles, but Standard IO norms are enforced for imports of raw materials
K. Average tariff rates on imports: 10% (Figure 4 & 5).
Figure 4: % Share of different exporters in US technical textiles imports.
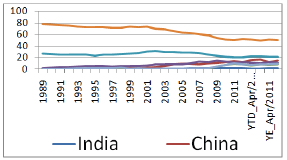
Figure 5: % Share of different segments in US technical textiles imports.
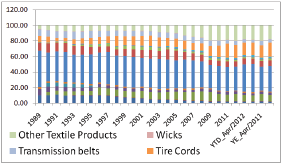
Global Market: The Case of US Imports
Inferences from an overview of US technical textiles imports
A. Shares of developing countries are rising
B. China, Mexico & Vietnam: new giants, Canada leads; India has remained stagnant, but better than SAARC
C. Impregnated fabrics, tire cords and Laminate/Rub fabrics: major import items
D. Diminishing over time: impregnated fabrics, laminates , bolting fabrics, floor/wall coverings and hosepipes
E. Growing over time: Tire Cords, Straining fabrics, Tracing fabrics, transmission belts; other textile products e new products (Figure 6)
Figure 6: Price (per KG for all except felts/coverings) trends in US technical textiles imports.
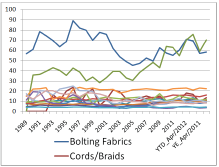
Inferences from price trends of US technical textiles imports
A. Most valued: Bolting fabric, felt, transmission belts, straining cloth, cord/braid, coated fabrics, hosepipes, impregnated fabrics
B. Least valued: tracing fabrics, tire cords (stable), laminates/rubs, wicks, others
C. Growing value: Felts, Floor/Wall covering, straining fabrics
D. Diminishing value: Tracing fabrics, wicks and others (Figure 7)
Figure 7: Segmental composition of India's technical textiles exports to USA.
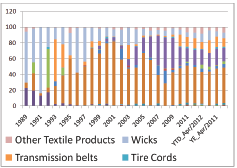
Inferences from segmental composition of india's technical textiles exports to USA<
A. Major export items: Impregnated & tracing fabrics, transm belts, wicks, laminate/rub, tire cords, others.
B. Growing items: All of the above except wicks; hosepipes, felts, cords/braids
C. Diminishing items: Wicks, Coated Fabrics, Floor/ Wall Coverings(Figure 8-10)
Figure 8: Segmental market shares of India's technical textiles exports in USA.
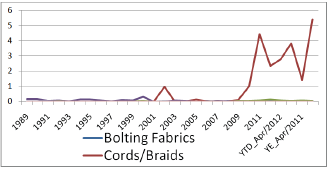
Figure 9: Price trends of India's technical textiles exports to USA.
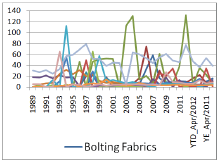
Figure 10: Relative price trends of India's technical textiles exports to USA.
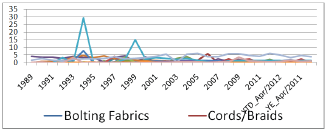
Relative price trends of India's technical textiles exports to USA
A. Very fluctuating prices: changing product mix?
B. High Value items (>15 US$/KG): Felts, Cords/ braids, bolting fabrics, wicks, straining fabrics, floor/wall coverings, laminate/rub fabrics, others.
C. Lower relative prices: Bolting fabrics, hosepipes, impregnated fabrics, coated fabrics, transmission belts e competitive or lower value items?
Global Trade and Tariff Policies
A. Most of the developing countries incentivize technical textile exports (e.g. VAT rebate: 16% in China)
B. Tariff rates: USA (0-8%), Canada (0-18%), EU (48%), China (8-14%), Vietnam (0-12%), Bangladesh (325%), Thailand (1-30%)
C. Indian tariff rates (10%) are uniform across the board e could be rationalized based on competitiveness of different segments.
Unorganized Technical Textile Firms
A. A study on the effect of trade liberalization on the efficiency of Unorganized firms
B. Compares two different eras of trade openness in rural/urban India: 1994-95 and 2000-01 NSSO data
C. Broadly TT firms ranked high on efficiency
D. No change: Tarpaulin (high), crocheted made-ups (low, improved in rural)
E. Decline: linoleum products, jute/hemp rope/cords (improved in rural), nets
F. Improvement: non-tarpaulin waterproof made-ups and hats/caps
G. Determinants: size, age, effective rate of protection, affiliation to agencies, location and nature of operation and ownership
H. Policies needed:
a) Provision of proper credits with low interest rates to improve the technologies & infrastructure
b) Promotion of co-operative societies and agencies
c) Assistance in supply and procurement of materials
d) Incentive-based improvements in labor conditions
e) Better utilization of resources and technological improvements
Economy-Wide Effects of Growth in TT
A. Forward, backward and international linkages of textiles may generate bigger economy-wide effects
B. Examine the impact of the projected (baseline survey) growth of TT on India's GDP & textile sector
C. Use the popular GTAP (Global Trade Analysis Project) model
GTAP model
a. Hertel (1997): Multi-sectoral multi-regional CGE model mainly for trade policy analysis
b. Elasticities: calibrated/estimated econometrically
c. Demand = Supply in all markets (p=mc)
d. Taxes: wedge between pros & cons prices
e. Int'l trade: Armington CES substitution across src
f. Inputs: intermediate & factors: Leontief
g. Intermediate: imported/domestic: CES
h. Factors: Labor, Capital, Land: CES
i. Regional Household: Y=C+I+G+X-M: const shares
j. Private HHLD (C): CDE demand system: Hanoch (1975)
k. Global savings (Fixed share of income, ROR): investment
l. Welfare Decomposition: EV
GTAP data base
a. Narayanan, Aguiar and McDougall (2012): 57-sector 129-region data: GTAP 8 Data Base
b. Trade: based on UN COMTRADES further processed, using IMF, WTO , WB, FAO data
c. Protection: ITC-CEPII MACMAPS Data
d. Input-Output Tables: Various contributors; NCAER for India
e. Energy data from IEA, OLADE, TERI
f. OECD domestic support data
g. Textiles is a sector here, but technical textiles is not separately available
Inferences from IO data in GTAP data base
Use of textiles in non-textile/apparel/service industries:
a. Global average: 33%
b. Vietnam: 25%; Japan: 30%; India: 19%; Bangladesh: 3%; Pakistan: 7%; Sri Lanka: 13%; Canada: 59%; USA: 40%; Germany: 23%; UK: 26%
c. Major non-textile user industries:
d. Automotive, machinery/ capital goods, construction, chemicals/rubber/plastics, paper/printing, leather, wood, agriculture.
Inferences from GTAP model simulation
a. Expansion of technical textiles projected from 200708 to 2014-15 is approximately 20% of current textile output.
b. Assuming worldwide unemployment, we simulate 20% growth in textiles in this comparative static framework.
Some results for India:
a) Employment growth: 1.2% (12.7% in textiles alone)
b) GDP growth: 1% (US$ 12bn)
c) Export growth: 63.5% (US$ 8.9bn)
d) Imports fall by: 19% (US$ 0.7bn)
e) Domestic consumption increases by 6.8% (US$ 3.1bn) in textiles
Conclusion
A. India has a lot of scope to grow in this sector
B. Widespread economic effects from the growth of TT
C. Focus on high value and growing segments as well as the ones in which we are competitive
D. Tariff policies could be more targeted and sector- specific
E. FDI and foreign collaboration for better access to technologies
F. Small firms have improved efficiency due to competition and need policy support
G. Scope for tax reduction rather than subsidies/ incentives that may be contentious.
© 2018 Badri Narayanan G. This is an open access article distributed under the terms of the Creative Commons Attribution License , which permits unrestricted use, distribution, and build upon your work non-commercially.
 a Creative Commons Attribution 4.0 International License. Based on a work at www.crimsonpublishers.com.
Best viewed in


.jpg)


 Editorial Board Registrations
 Submit your Article
 Refer a Friend
 Advertise With Us
.jpg)


.jpg)


.bmp)
.jpg)
.png)
.jpg)


.jpg)


.png)

.png)


.png)


