- Submissions

Full Text
Research in Medical & Engineering Sciences
Gradient Method to Determine the Avidity of Cell Binding
Richard BM Schasfoort1*, Daja van de Vosse1 and Jos van Weperen2
1Department of Biomedical Engineering Technology, University of Twente, The Netherlands
2Vysens BV, Fl. Hazemeijerstraat 800, 7555 RJ Hengelo, The Netherlands
*Corresponding author:Richard BM Schasfoort, University of Twente, Department of Biomedical Engineering Technology. P.O. Box 217, 7500 AE Enschede, The Netherlands
Submission: March 22, 2024;Published: April 01, 2024

ISSN: 2576-8816Volume11 Issue1
Abstract
Currently, around 120 therapeutic antibodies have obtained market approval and around 1,000 are in various stages of clinical development [1]. The interactions between antibodies and cells are playing a central role in their efficacy. These interactions are governed by the avidity of cells and antibodies. In recent studies, more and more emphasis is laid on the avidity aspects of cells versus antibodies [2]. The optimal accuracy of the avidity in terms of equilibrium constants is obtained under low densities of ligands present on a sensor surface.
Recently, a novel Surface Plasmon Resonance imaging technique has been applied that employs a gradient of ligand density [3]. In this brief paper, we show an additional way of exploiting the ligand density gradient, namely for cell avidity measurement. As an example, we measured the specific binding of the LNCaP cell line using their EpCAM (Epithelial Cell Adhesion Molecule) receptor on a gradient of anti-EpCAM antibodies. One can observe the location where cells are still captured at a so-called tipping point. The functional ligand density at the tipping point after cell binding and controlled shear conditions are typical for a certain combination of anti-cell receptor antibodies with a certain cell line.
Keywords:EpCAM; Anti-cell receptor; CellVysion SPR imager
Introduction
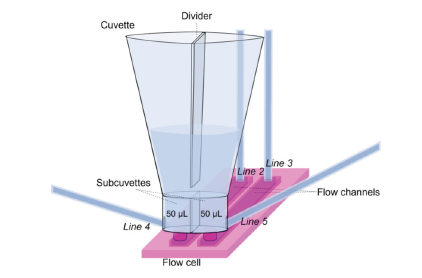
The CellVysion SPR imager of Vysens B.V. Hengelo, The Netherlands, applies a valve-less injection of samples in a so-called Cuvette Injection Flow cell (CIF) (Figure 1). Further, it enables to generate two parallel ligand density gradients on the sensor surface. “Back-and-forth” flow-based fluidics enables unlimited interaction times using only 70μL of sample. The technology seamlessly integrates to measure affinity, avidity and concentration, pivotal for advancing more efficacious therapeutics and diagnostic solutions.
Figure 1:A schematic presentation of the Cuvette Injection Flow (CIF) system applied in the CellVysion. Two flow channels are pressed on a flat hydrogel coated SPR sensor chip. The sub-cuvettes are connected to left and right drain lines (Line 4 and 5 resp.).

The fluidics; Cuvette Injection Flow (CIF), of the SPR imager of Vysens enables injection of samples directly from a cuvette which is placed on top of a two-channel flow cell. Without applying an air bubble to separate the running buffer from the sample, the analyte can be injected instantly into the flow chamber without delay. Large particles (e.g., cells) can be aspirated without clogging the fluidics. The position of the optics allows following sedimentation of the cells. In order to keep the sample volume low (e.g., 70μL), back-andforth flow is applied to reduce the sample volume while association times can be e.g., half an hour. The CIF can be applied to generate a ligand density gradient in both flow channels.
In the SPR imager, the gradient enables the availability of all ligand densities, from very high to low, up to zero. The zeroligand density location is used as a reference signal to compensate for common mode signals such as bulk refractive index shifts, temperature effects, nonspecific binding to the hydrogel, etc. [4]. In principle, it is possible to obtain the single molecular affinity parameters [5] from hundreds of biomolecular interaction events on the gradient. In the SPR imager, the generation of the gradient can be measured for both channels [6].
Result and Discussion
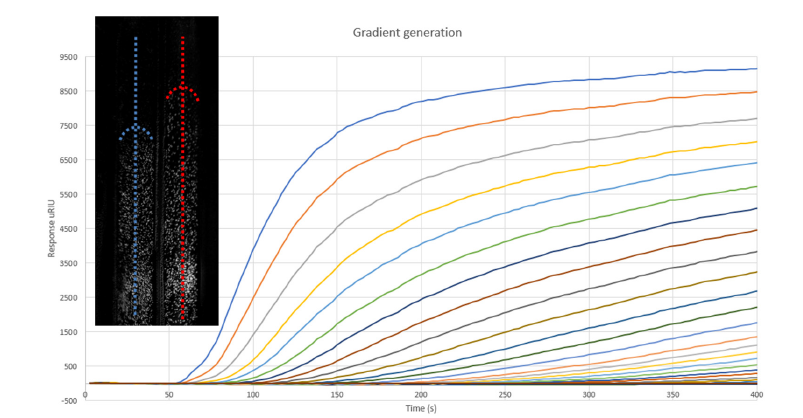
The binding process occurs at different locations (Regions of Interest, RoI) on the sensor surface. Ligands diffuse from the cuvette side to the end of the flow chamber. At the channel entrance, a high density of ligands will be present, gradually decreasing until there is no ligand density at the outlet of the flow chamber. Here, at 400 seconds the process will be stopped, and one can observe the responses at the various RoI’s as μRIU levels. In the left panel cell binding on the gradient is shown. Dashed lines show the tipping point of cells binding to the sensor surface. The characteristic ligand density for the tipping point can be measured (Figure 2).
Figure 2:Gradient formation and cell binding measurement. Top left: SPR image of LNCaP cells bound to the anti- EpCAM gradient on the sensor surface. The tipping point is represented as a dashed curved line. Graph: SPR curves obtained from Regions of Interests (RoI’s) at different locations in the flow cell. The gradient formation on the sensor surface can be followed.

Conclusion
With the method described in this report, it is possible to determine the so-called tipping point for a certain cell type - antibody combination. The tipping point is the characteristic ligand density that is just enough to capture the cells/particles and retain them under certain shear conditions. This value of avidity determined as functional Rmax value depends both on the number of receptors and the monovalent affinity per cell. Therefore, this setup and method will allow for cell-antibody avidity determination. More results will be obtained in the coming period.
References
- Lu RM, Hwang YC, Liu IJ, Lee CC, Tsai HZ, et al. (2020) Development of therapeutic antibodies for the treatment of diseases. Journal of Biomedical Science 27(1): 1.
- Oostindie SC, Lazar GA, Schuurman J, Parren PW (2022) Avidity in antibody effector functions and biotherapeutic drug design. Nature Reviews Drug Discovery 21(10): 715-735.
- Schasfoort Richard BM (2023) Gradient method for accurate affinity determinations. Analytical Biochemistry 667: 115085.
- Schuck P, Zhao H (2010) The role of mass transport limitation and surface heterogeneity in the biophysical characterization of macromolecular binding processes by SPR biosensing. Methods in Molecular Biology 627: 15-54.
- Schasfoort RBM, Lau W, Kooi A, Clevers H, Engbers GHM (2012) Method for estimating the single molecular affinity. Anal Biochem 421(2): 794-796.
- Schasfoort Richard BM (2017) Handbook of surface plasmon resonance. Royal Society of Chemistry, United Kingdom.
© 2024 Richard BM Schasfoort. This is an open access article distributed under the terms of the Creative Commons Attribution License , which permits unrestricted use, distribution, and build upon your work non-commercially.
 a Creative Commons Attribution 4.0 International License. Based on a work at www.crimsonpublishers.com.
Best viewed in


.jpg)


 Editorial Board Registrations
 Submit your Article
 Refer a Friend
 Advertise With Us
.jpg)


.jpg)


.bmp)
.jpg)
.png)
.jpg)


.jpg)


.png)

.png)


.png)


