- Submissions

Full Text
Research in Medical & Engineering Sciences
Analysis of Whole Blood Prothrombin Time/International Normalized Ratio Using Image Processing
Sarath S Nair1, Rakhi MR1, Lakshmi Sadanandan2 and Harikrishnan S3 and Anugya Bhatt1*
1Division of Thrombosis research, Sree Chitra Tirunal Institute for Medical Sciences and Technology, India
2Extracorporeal Division, Sree Chitra Tirunal Institute for Medical Sciences and Technology, India
3Department of Cardiology, Sree Chitra Tirunal Institute for Medical Sciences and Technology, India
*Corresponding author: Dr. Anugya Bhatt, Division of Thrombosis research, Biomedical Technology Wing, Sree Chitra Tirunal Institute for Medical Sciences and Technology, Trivandrum, Kerala, India
Submission: January 18, 2021Published: March 19, 2021

ISSN: 2576-8816Volume9 Issue3
Abstract
Purpose: Patients who had undergone mechanical heart valve replacements, who have atrial fibrillation or deep vein thrombosis, need drugs called oral anticoagulants to prevent blood clotting and need regular testing of Prothrombin Time/International Normalized Ratio. Conventional laboratory approaches are time consuming, need blood component separation and a regular visit to clinical labs. The burden of PT measurement on the clinical laboratory is huge globally, which raise need for point of care, quick and user-friendly device. Methods: In this study we have proposed a handheld device based on the image processing for the PT/INR detection. Cost effective disposable strips were fabricated using thromboplastin as reagent. Device and strips were tested for 100 samples in clinical set up as per the ISO standard 17593 “Clinical laboratory testing and in vitro medical devices - Requirements for in vitro monitoring systems for self-testing of oral anticoagulant therapy”. Results: Data was compared with the values obtained from clinical laboratory using automated coagulometer T Coag DT-100 (Trinity), and commercially available Point of Care (POC) device from Roche, Diagnostics. A correlation coefficient (r) of 0.87 & 0.77 was observed between lab vs Chitra device and Chitra device vs commercially available device, respectively. Conclusion: Clinically accepted correlation may be obtained after automation of the strip fabrication technique. The proposed device is cost effective and easy to operate and works on the novel approach of image processing. To best of our knowledge this is the first report on the image processing-based PT/INR monitoring device.
Keywords: Prothrombin time; International normalized ratio; Medical device; Image processing
Introduction
As per World Heart Federation, 17.1 million lives are claimed by the global burden of Cardiovascular Diseases (CVD) and stroke; 82% of which are in developing world [1]. Many of the patients with CVD like those who had undergone mechanical heart valve replacements, who have atrial fibrillation or deep vein thrombosis or stroke, need drugs called oral anticoagulants to prevent blood clotting [2,3]. These drugs have very narrow therapeutic range and even minor variation in the doses can lead to bleeding or thrombosis [4-6]. Most of the patients need lifelong drugs and regular monitoring is essentially needed to maintain the PT/INR in the narrow therapeutic range and for anticoagulant dose adjustment. This causes a huge burden on the clinical labs and discomfort to the patients as they have to travel long distances to check PT/INR. India has huge burden of CVD and we have a huge number of patients who needs oral anticoagulant therapy [7]. Most of the primary health centers, or even district hospitals in the urban areas in the country are not equipped with the PT monitoring devices; and there are logistic issues related to trained staff. So many patients are forced to skip PT/INR measurements leading to catastrophic complications [8,9]. Availability of POC devices can solve the problem of accessibility and availability. Thus, the demand for reliable POC devices is on the rise in India and other developing countries.
PT analysis depends on the clotting of blood/plasma samples
in the presence of calcium and tissue thromboplastin. The
methods used in the laboratories are based on mechanical, optical
or impedance principles [10]. The Point of Care Devices (POC)
available in this sector works on different methods like cessation
of iron nanoparticles, photoptic detection of decrease in blood
flow, change in the optical density or change in the impedance of
the samples. Potential advantages of POC INR testing include rapid
testing time (typically within seconds) and ease of frequent outof-
hospital testing. These allow INR monitoring of the patients
who are home-bound or, as well as in those for whom drawing
venous blood samples is difficult. Thus, reduces burden on health
care system and enable patients to self-test and self-manage their
Vitamin K Antagonists (VKAs) therapy with favorable outcomes [8].
Anticoagulation management services also have reported that
POC INR devices improve clinical efficiency and patient comfort and
satisfaction compared to traditional venipuncture methods [11].
POCs devices facilitates more frequent testing of anticoagulation
levels which in turn improves time in Therapeutic Range (TTR) and
reduces bleeding and thrombotic complications in patients on oral
anticoagulation therapy [12]. Though there are various PT/INR
monitoring devices are available, cost of consumables hinders their
use in the developing countries like India [7].
In our approach we explored image processing of blood
samples after reacting with thromboplastin for analyzing the PT
as a direct method. Changes in the two subsequent images were
captured continuously. Clot detection was recorded when there
was no change in the two subsequent images. INR was calculated
and data was compared with the laboratory test as well as with the
commercially available POC device. External quality control of POC
devices is essential to ensure that results are robust. One approach
was to collect a venous sample at the same time as POC testing, which
is analyzed using an appropriate hospital laboratory analyzer. It has
been recommended that INR results should be within 0.5 of each
other when measured by each method [13]. However, previous
studies have shown that when compared with clinical laboratory
values, POC devices may show statistically significant differences
between the INR values [14].
Methods
The Chitra PT/INR Monitor works on the principle of Image processing techniques by continuous monitoring and analyzing blood movement dropped to a micro porous paper. A camera is kept focused to the micro porous paper strip which has a coated well with thromboplastin or neoplastin, where a small quantity of blood preferably less than 10ul is allowed to flow. A timer is triggered, and camera starts capturing the pictures. The camera captures images of blood path while flowing through the passage and a timer is disposed to measure elapsed time when blood stops. The camera takes pictures of the blood flowing through the blood contact surface and gives to the electronic hardware where the image processing is done. The electronic hardware which obtains the captured images, perform image processing by filtering and subtracting two consecutive images, pixel by pixel to determine the clotting of blood, thus cessation of movement and exactly imposed images. The device determines blood clot time after image processing and count of pixels of subtracted image. The device checks for any variations in pictures of consecutive intervals and identifies the time when no change in consecutive images occurs as clotting time of blood sample. From the time taken for the sample of blood to clot, INR is calculated as per the Equation 1; using measured Prothrombin Time (PT test), the average Prothrombin Time (PT) stored in memory (PT control) based on the control samples tested on the same device and the International Sensitivity Index (ISI) of the reagent.
INR = (PT test/PT control)ISI (Equation-1)
The Chitra PT/INR monitoring system has two components. A. Strips B. PT/INR Monitor (Device). The details of the components are mentioned below.
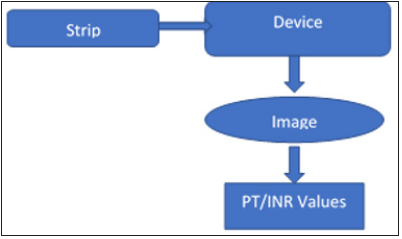
Different strip designs were tried in order to optimize the best performance in terms of consistency, repeatability and reproducibility. The final strip design is given in Figure 1, consisting of a base slide, a micro porous paper and a black film coating. The base slide is a plastic substrate of 1mm thickness having a channel of 0.2mm depth with a well on one end of depth 0.8mm and a channel length of 3cm. The base slide is made using polypropylene polymer with Rapid Prototyping 3D printing machine. A micro porous paper (Whattman 1 filter paper) with a pore size of 10-15um and thickness of 1.8mm was cut and placed into the channel present in the plastic base slide. A thin wick was extended to the well in order to maintain the stability and repeatability. The wick is provided to ensure that the blood flowing into the micro porous paper spreads only after proper mixing of blood with the reagent a shown in Figure 1. A black film coating in the same size as that of the slide is placed to cover the base slide along with the micro porous paper in the channel for its proper placement and to get the required image.
Figure 1:Pictorial abstract.
PT INR Monitor
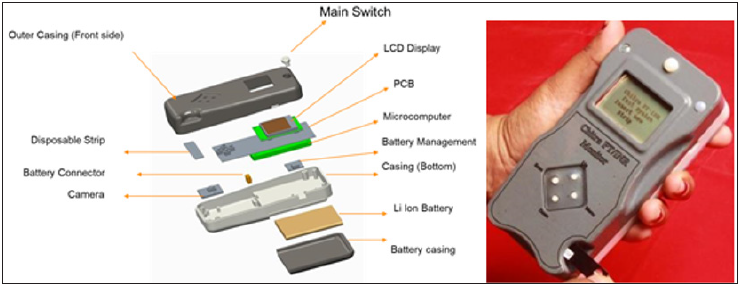
Chitra PT/INR Monitor is designed to meet the objective of creating an affordable PT/INR monitoring device with equal performance. The design is created by using a readily available low-cost microcomputer Raspberry Pi and open-source software in PYTHON. The detailed assembly drawing indicating the various parts and its physical location is given in Figure 2 and the assembled handheld device for testing is shown in Figure 2. An algorithm for capturing the images and image processing for determination of blood clot as well as computation of prothrombin time is written in Python for controlling the device as shown in Figure 3.
Figure 2:Strip design.

Figure 3:Various parts of the Chitra PT/INR monitoring device B. Assembled device.
Subject selection
Consecutive 100 subjects were recruited in the study from the PT clinic of the hospital wing of the Sree Chitra Tirunal Institute for Medical Sciences Technology, Trivandrum (An Institute of National Importance under Government of India), after obtaining the Institutional Ethics Committee approval (Approval No SCT/IEC/1086/2017) for the study. All the tests were done using the capillary blood and at the clinical set up. All subjects recruited in the study were on warfarin for regulating their PT either post surgically for implants/ stent/ or due to cardiac or neuro complications for which they were recommended regular PT monitoring. Subjects between 25-65yrs of either sex, post-surgical, with implants or on warfarin were selected as test. Healthy volunteers were tested as control samples.
Test on the device
Capillary blood was used to check the INR in the device under testing (reagent neoplastin with an ISI of 1.28) and on the commercially available POC device. Number of samples against different INR ranges for proper evaluation of the PT/INR Monitoring device test was planned as per the guidelines provided in ISO 17593. Samples were done randomly and were put into the groups as per the standard. Study was terminated up on getting desired percentage as mentioned in Table 1 was met for each group except group 4 & 5). As subjects were on medications in the doses prescribed based on their clinical condition, adequate number of patients in higher INR patients couldn’t recruited in the study as per the standard (eg INR 4.6 to 6). Table 2 summarizes the number of samples tested in each group for the study. Simultaneously, blood samples were collected through venipuncture from all subjects recruited in the study for analyzing PT value of patients in laboratory and comparing the value with the device in test. Plasma was separated by centrifuging the blood samples at 1500g for 10min and analyzed on an automated coagulometer T Coag DT-100 (Trinity) using neoplastin CI (Diagnostica Stago with an ISI of 1.4). The mean normal PT value was 14s.
Table 1:INR values of samples for system accuracy verification as per ISO 17593.
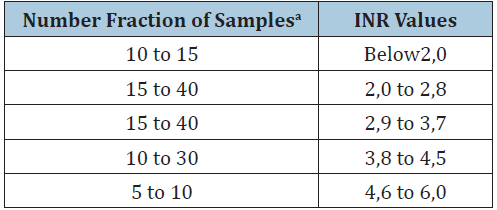
Table 2:Test samples used for the analysis in different groups.

Comparative analysis
100 samples were tested in laboratory using automated coagulometer T Coag DT-100 (Trinity), Chitra PT INR device and commercially available POC device (CoaguChek, Roche). Correlation curve was generated between the groups. Paired t test was applied to assess differences in INR values obtained by three different test methods and two sample methods. A p value of less than 0.05 was considered significant. Pearson correlation and Intraclass correlations were calculated to determine correlation between values obtained with the Chitra device and the laboratory. Data analysis was done with graph pad prism 8.2.1 software. Agreement was also assessed by Bland Altman Analysis [9].
Statistical analysis
Unaired t test was performed using the graph pad prism software.
Results and Discussion
Device and strip design
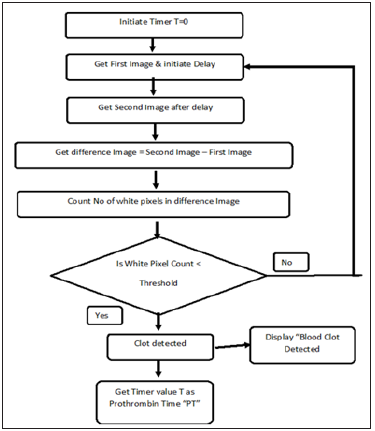
Device was designed and fabricated in-house using a novel imaging-based technology. Camera was fixed at the sample channel so that sample movement in the strip can be captured. Strips were fabricated on the polystyrene base with a reagent well and channel. Microporous filter paper was fixed in the channel and strips were sealed with thin black plastic sheet to avoid noise during the image processing. Neoplastin (Diagnostica Stago), was immobilized on the reagent well by freeze drying after optimizing the concentration of the reagent. Once samples are loaded on the reagent well, sample through capillary action moves on the strip. Movement of the sample was captured as 30 images/sec by the camera. Two subsequent images were imposing on each other to analyze the clot formation. Time point with zero difference between two images was calculated as Prothrombin time. INR was calculated using the mean PT (14sec) of control and ISI of neoplastin (1.28). Figure 4 explain the procedure for the data capturing.
Figure 4:Algorithm for prothrombin time measurement.
Comparative analysis
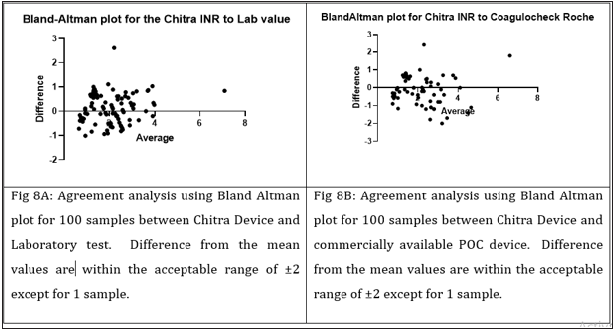
All values obtained using the Chitra device were compared with the Coagu Chek (Roche, and laboratory test data. A good correlation was seen with correlation coefficient (r) of 0.87 & 0.77 between lab vs Chitra device and Chitra device vs commercially available device respectively (Figure 5). When subjects with INR value <2.5 and those with INR ≥2.5 were analyzed separately, correlation (r) of 0.79 & 0.81 was observed for subjects <2.5 INR & >2.5 INR respectively with respect to the lab (Figure 6) and 0.51 & 0.66 with respect to the POC device. Bland Altman plot analysis for all data points as well as for the values 2.5 and 2.5 also showed differential variation within the acceptable range compare to the lab and POC device (Figure 7). It’s evident from the data that device in the test performed accuracy measurement comparable to the laboratory and the POC device (Figure 8). However, better correlation was observed with the laboratory obtained values compared to the POC device. It was also observed that values obtained in the devices were on the higher side compare to the POC device used.
Figure 5:Chitra PT INR device and different stages for collecting the data.
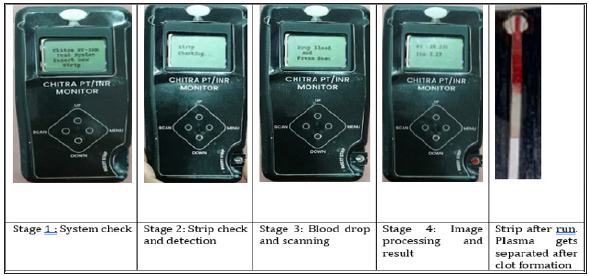
Figure 6:
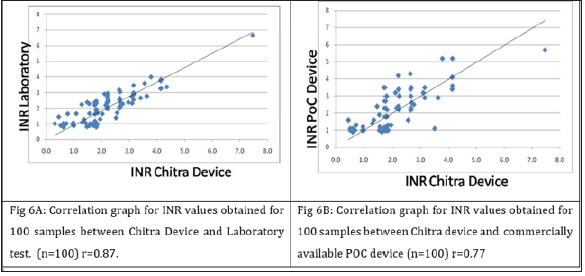
Figure 7:
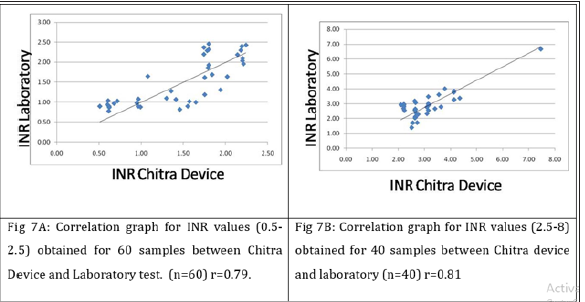
Figure 8:
Not many studies have been conducted on the POC devices in the Indian population [7]. Studies have reported variation in the INR values of POC devices compared to laboratory tests specifically in the high range of INR above 3.5 [15-17]. However, in our case slightly better correlation was observed for the high range of INR above 2.5-8. Chitra device also showed better correlation with the laboratory values than to POC device (Figure 9). Several studies have demonstrated the advantages of PoC devices in the selfmanagement as well as for the laboratories [18,19]. Finger-prick reduces the process of the sample preparation and thus the time to results, better adaptability of the patients to the drug/dosage and treatment due to the more frequent monitoring of coagulation status, which all contribute to more effective anticoagulation management that results in the reduced risk of hemorrhagic and thromboembolic complications [20-22]. Currently the cost of PoC devices hindering its uses in the developing world like India, as well as its widespread penetration in testing in hospitals or low resource settings [4]. New approaches are being explored for PT/INR monitoring that include the use of quartz crystal [23], magnetoelastic transducers [24] and MEMS sensors [25]. The mechanical perturbation employed in these methodologies might however interfere with the clot formation process and therefore may not reflect the natural coagulation process in situ. Other optical methods have been proposed that present promising alternative strategies, however thus far these approaches utilize bulky benchtop instruments that may be unsuitable for PoC use [5,26]. Recently LSR based cost effective method for PT/INR has also been reported [4].
Figure 9:
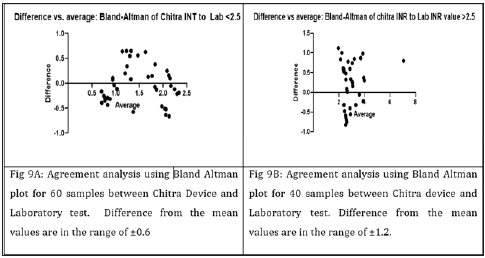
Cost of the existing POC devices and the consumable cost are the major hindering factors of the use of these devices at patient’s site in India [4,18]. Over 200 million PT/INR tests are conducted worldwide each year, placing a huge burden on health care resources. Low-cost devices such as proposed device will likely play an important role towards managing hemostasis in patients while reducing the substantial costs associated with coagulation testing. The developed device and consumables will be 1/3 of the cost of commercially available POC device. This indigenous device works on a simple novel principle of image processing and a cost-effective alternative to the Indian population for the PT/INR monitoring. It was observed that variation was high when the INR value was less than two. Improvisation of the device/strips in order to minimize the variation may lead to the successful commercialization of the Chita PT/INR monitoring system. All strips used in the study were checked for the quality control. POC devices are used to analyze and monitor the values on a regular basis of the patients. Thus, a drift in value can be easily monitored and regulated. Limitation of our study was low number of patients in high INR range as all patients who were under treatment was only considered in the study. As strips are prepared manually and channeling of the paper is critical for getting the accuracy in the data, quality of the strips may affect the accuracy, however, automation of the strip fabrication will minimize the data variation. We expect that this device may reduce the cost and burden on health care system for PT/INR testing significantly, however, automation of the system, true clinical testing needs to be done to ascertain the impact of proposed PT/INR PoC device.
Conclusion
The Chitra PT/INR monitor provides comparable values with the laboratory results and commercially available POC device and may be used in the clinical set up or at patient side. The device can be used at clinical setup using IV punctured whole blood or with fingertip capillary The analysis of clinical evaluations performed on the device shows that, preparation and quality inspection and final selection of strip has a very critical role in influencing the accuracy of the results, thus automation of the strip fabrication may reduce the variation and improve the correlation.
Acknowledgement
We acknowledge the financial support obtained from department of Science and Technology in form of Technology Research Centre. Authors would also like to acknowledge the intellectual support provided by Mr. D S Nagesh. We are thankful to Director, SCTIMST and Head BMT Wing for extending all infrastructure support for the work.
Author Contribution Statement
Mr. Sarath S Nair has contributed in designing the experiments, development of the device, and obtaining the data, critical data analysis. Ms. Rakhi MR has contributed towards strips preparation, data generation and compilation. Ms. Lakshmi S has contributed in device development, data generation, and compilation of data. Dr. Harikrishnan S has contributed towards designing the experiment, provided the patient samples, patient data and modified the manuscript. Dr. Anugya Bhatt has contributed towards the conceptualized the idea, designing the experiments, critical analysis of data and acquisition of funding support.
References
- ‘State of the Heart’ CVD Report (2017) World Heart Federation.
- Mekaj YH, Mekaj AY, Duci SB, Miftari EI (2015) New oral anticoagulants: their advantages and disadvantages compared with vitamin K antagonists in the prevention and treatment of patients with thromboembolic events. Ther Clin Risk Manag 11: 967-977.
- Medical Advisory Secretariat (2009) Point-of-care International Normalized Ratio (INR) monitoring devices for patients on long-term oral anticoagulation therapy: An evidence-based analysis. Ont Health Technol Assess Ser 9(12): 1-114.
- Tripathi MM, Egawa S, Wirth AG, Tshikudi DM, Van Cott EM, et al. (2017) Clinical evaluation of whole blood Prothrombin Time (PT) and International Normalized Ratio (INR) using a laser speckle rheology sensor. Sci Rep 7(1): 9169.
- Yang CL, Huang SJ, Chou CW, Chiou YC, Lin KP, et al. (2013) Design and evaluation of a portable optical-based biosensor for testing whole blood prothrombin time. Talanta 116(15): 704-711.
- Wieloch M, Hillarp A, Strandberg K, Nilsson C, Svensson PJ (2009) Comparison and evaluation of a point-of-care device (coaguchek XS) to owren-type prothrombin time assay for monitoring of oral anticoagulant therapy with warfarin. Thromb Res 124(3): 344-348.
- Ajit M, Thomas J, Ichaporia NR, Sahoo PK, Unni TG (2020) Oral anticoagulation therapy: Current challenges in Indian scenario. International Journal of Advances in Medicine 7(6): 1044-1052.
- Heneghan C, Ward A, Perera R, Self-Monitoring Trialist Collaboration, Bankhead C, et al. (2012) Self-monitoring of oral anticoagulation: Systematic review and meta-analysis of individual patient data. Lancet 379(9813): 322-324.
- Chaudhry R, Scheitel SM, Stroebel RJ, Santrach PJ, Dupras DM, et al. (2004) Patient satisfaction with point-of-care international normalized ratio testing and counseling in a community internal medicine practice. Manag Care Interface 17(3): 44-446.
- Bland JM, Altman DG (1986) Statistical methods for assessing agreement between two methods of clinical measurement. Lancet 1(8476): 307-310.
- Plüddemann A, Thompson M, Wolstenholme J, Price CP, Heneghan C (2012) Point-of-care INR coagulometers for self-management of oral anticoagulation: primary care diagnostic technology update. Br J Gen Pract 62(604): e798-e800.
- Perry DJ, Fitzmaurice DA, Kitchen S, Mackie IJ, Mallett S (2010) Point-of-care testing in haemostasis. Br J Haematol 150(5): 501-514.
- Fitzmaurice DA, Gardiner C, Kitchen S, Mackie I, Murray ET, et al. (2005) An evidence-based review and guidelines for patient self-testing and management of oral anticoagulation. British Journal of Haematology 131(2): 156-165.
- Gosselin R, Owings JT, White RH, Hutchinson R, Branch J, et al. (2000) A comparison of point-of-care instruments designed for monitoring oral anticoagulation with standard laboratory methods. Thromb Haemost 83(5): 698-703.
- Watson PF, Petrie A (2010) Method agreement analysis: A review of correct methodology. Theriogenology 73(9): 1167-1179.
- Ryan F, Shea SO, Ortel TL, Byrne S (2007) The Reliability of Point-of-Care (POC) prothrombin time testing - a comparison of coaguchek xs® inr, measurements with hospital laboratory monitoring. Blood 110(11): 973.
- Bloomfield HE, Krause A, Greer N, Taylor BC, Donald RM, et al. (2011) Meta-analysis: Effect of patient self-testing and self-management of long-term anticoagulation on major clinical outcomes. Ann Intern Med 154(7): 472-482.
- Wittkowsky AK, Sekreta CM, Nutescu EA, Ansell J (2005) Barriers to patient self-testing of prothrombin time: National survey of anticoagulation practitioners. Pharmacotherapy 25(2): 265-269.
- Stevanovic J, Postma MJ, Le HH (2016) Budget impact of increasing market share of patient self-testing and patient self-management in anticoagulation. Value Health 19(4): 383-390.
- Pena JA, Lewandrowski KB, Lewandrowski EL, Gregory K, Baron JM, et al. (2012) Evaluation of the i-STAT point-of-care capillary whole blood prothrombin time and international normalized ratio: Comparison to the Tcoag MDAII coagulation analyzer in the central laboratory. Clin Chim Acta 413(11-12): 955-959.
- Pozzi M, Mitchell J, Henaine AN, Hanna N, Safi O, et al. (2016) International normalized ratio self-testing and self-management: improving patient outcomes. Vasc Health Risk Manag 12: 387-392.
- Müller L, Sinn S, Drechsel H, Ziegler C, Wendel HP, et al. (2010) Investigation of prothrombin time in human whole-blood samples with a quartz crystal biosensor. Analytical Chemistry 82(2): 658-663.
- Pucketta LG, Lewis JK, Urbasa A, Gao D, Bachas LG, et al. (2005) Magnetoelastic transducers for monitoring coagulation, clot inhibition, and fibrinolysis. Biosensors & Bioelectronics 20(9): 1737-1743.
- Jose M, Kowarz MW, Sarbadhikari KK, Ashe PR (2008) MEMS interstitial prothrombin time test. USA patent US, USA.
- Piederriere Y, Cariou J, Guern Y, Brun GL, Jeune BL, et al. (2004) Evaluation of blood plasma coagulation dynamics by speckle analysis. J Biomed Opt 9(2): 408-412.
- Faivre M, Peltié P, Planat-Chrétien A, Cosnier ML, Cubizolles M, et al. (2011) Coagulation dynamics of a blood sample by multiple scattering analysis. J Biomed Opt 16(5): 057001.
© 2021 Anugya Bhatt. This is an open access article distributed under the terms of the Creative Commons Attribution License , which permits unrestricted use, distribution, and build upon your work non-commercially.
 a Creative Commons Attribution 4.0 International License. Based on a work at www.crimsonpublishers.com.
Best viewed in


.jpg)


 Editorial Board Registrations
 Submit your Article
 Refer a Friend
 Advertise With Us
.jpg)


.jpg)


.bmp)
.jpg)
.png)
.jpg)


.jpg)


.png)

.png)


.png)


