
- About Us
- Information
-

The Author ensures that the research has been conducted responsibly and ethically with adherence to all relevant regulations. read more..
- For Authors
- For Reviewer
- Manuscript Guidelines
- Membership
- Publication Ethics
-
- Journals
- Reprints
- e-Books
- Videos
- Policies
- Contact Us
 COVID-19
- Submissions


Full Text
Research in Medical & Engineering Sciences
Venturi Method Concept for Human Pulmonary Ventilation
Praneel John Titheradge1* and Robert Robergs2
1Charles Sturt University, Australia
2Queens!and University of Technology, Australia
*Corresponding author: Praneel John Titheradge, Charles Sturt University
Submission: November 14, 2017; Published: January 12, 2018

ISSN: 2576-8816Volume3 Issue2
Introduction
No evidence exists for the application of a Venturi meter used as a pulmonary airflow sensor. This commentary article outlines the fluid dynamic principles behind the concept and rationale for the instrumentation processes involved for future validation of a Venturi air flow sensor, to be used for human pulmonary ventilation measurement.
The process of quantifying volumetric flow rate of the human breath is a common tool used within a subcategory of human physiology, called pulmonary ventilation. This method involves utilizing an airflow sensor, coupled with respiratory mouthpieces and tracheal tubing, to channel a given volume of breath through the sensor for measurement. There are many validated airflow devices, including the Pneu motachometer [1-9], Turbine flow meter [10], Hot-wire Anemometer [11-14], Pitot-static tube [15-17], as well Wellesley Court, Raglan, 2795, Bathurst NSW, Australia, as the fixed or variable orifice tube [18,19]. Yet, no research has been conducted on the application, nor validation of the Venturi method to human pulmonary ventilation. Given its simple design, and ease of maintenance, the Venturi method provides a potentially inexpensive, reliable alternative to common methods that are prone to damage and relatively expensive to purchase and maintain. So how does it work?
The Venturi method operates by having a differential pressure transducer quantify the differential pressure (P1-P2) of air that occurs between two sections of a pipe of different diameter during fluid motion. This phenomenon is known as the Venturi effect and is described by the underlying fluid dynamics, known as the Bernoulli principle, which states that total pressure of a fluid remains a constant.
Figure 1: Venturi Tube convergent, throat, and divergent sections.

Bernoulli's theorem indicates that if a fluid flows horizontally so that gravitational potential energy remains negligible, then a change in the fluid's pressure is directly proportional to its velocity Consider a small element of fluid of mass (m), which is acted on only by a pressure force (P) and not subject to the forces of gravity The fluid is regarded as isotropic and may differ from point to point in space, but does not differ with time. It is a well-known effect of Newton’s laws of motion that when a particle of m moves under the influence of its weight (mg) (where g is the gravitational acceleration, -9.8m/s2) and an additional force (F), from a point (1) where its velocity is C1 and its height is Z1, to another point(2) where its velocity is C2 and its height is Z2, the work done by the additional force is equal to the change in kinetic and potential energy of the particle. In physics, kinetic energy is akin to the energy attributed to a fluid's velocity, whereas potential energy is akin to the hydrostatic pressure of a fluid. Static pressure however, refers to energy within a fluid that is measurable upon any point in a streamline, and is equal to total or atmospheric pressure when the fluid is stationary.
Venturi used Bernoulli's knowledge to demonstrate this relationship between a fluid's pressure and velocity by designing a pipe consisting of a convergent section, leading into a narrow throat section, followed by a divergent section where the pipe then returns into its original diameter (see Figure 1). The combination of these features is known as a Venturi Tube (fV), which can be used as a vacuum pump or a fluid measuring device (Figure 1).
As fluid flows through the fV, the transducer detects the pressure differential at pi and p2, a measurement of static pressure at each section of the pipe (see Figure1). Because the fluid is flowing horizontally, hydrostatic pressure is negated. This means changes in fluid velocity can be detected by changes in static pressure. Given this relationship between fluid pressure and velocity can be measured, as well as the area of pipe at which the pressure was taken, the volumetric flow rate can be quantified using equation 1
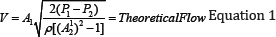
V = Volumetric Flow Rate
A2 = Area of constricted pipe diameter (Thtoat section)
P1 - P2=Differentalpressure
p = fluid density
Establishing the configuration of a fV, that is, the area of the inlet, throat section, and outlet, can be conducted through computational methods to find the ideal setup for a particular application. For example, if a fV were to be used for paediatric pulmonary ventilation monitoring V.s. a fV used for adult high intensity exercise testing, such as during exercise testing with ventilation measurement and expired gas sampling, the configuration of the fV can be optimised for each condition initially through computational methods. This is demonstrated in Figure 2. which reveals P1-P2 readings from two fV devices with 9.5m and 12mm throat diameters matched to differential pressure transducers (Setra Systems, Inc. Boxborough, MA, USA, Model 267: 0-1KPa input & 0-7KPa input/ 10Volt output), during an airflow condition. The airflow rate was determined by a criterion device
Figure 2: fV devices exposed to different airflow conditions. a) 12mm and 9.5mm throat fV specifications matched to 7kpa transducer. b) 12mm and 9.5mm throat fV specifications matched 1kpa transducer. Criterion airflow determined by Pneumotachometer

(Pneumotachometer by Hans Rudolph, Inc. Shawnee, Kansas, USA). Based on the two fV instrumentation specifications, we can compare the measured P1-P2 reading to a predicte P1-P2 reading based on criterion airflow determination utilised in equation 1. In theory, a hypothetical value computed through equation 1 should be similar to actual measurements. Therefore, by performing algebraic substitution of equation 1, the effects from fV configuration and transducer specification can be revealed, which subsequently can be used for further instrumentation to optimise a fV device to meet application needs (Figure 2).
The Venturi equation utilises which takes into account the fluid density of air being measured. To compute fluid density, certain environmental conditions must be known in order to improve the accuracy of volumetric airflow measurements. These include relative humidity, fluid temperature, and atmospheric pressure, which are used to compute equation 2, then subsequently used within equation 1.
ρ=ρ(1+X)/(1+1.609x) Equation. 2
p = density of moist air (kg/m3)
ρda = humidity ratio by mass (kg/m3)
X = humidity ratio by mass (kg/kg)
1.609=gas constant ratio between water vapour and air
All airflow sensor pulmonary ventilation measurements need to be converted to a standard measurement. For example, atmospheric, temperature, pressure, saturated conditions (L.min-1ATPS), converted to standard, temperature, pressure, dry conditions (L.min-ISTPD), is carried out using equation 3. The standardisation of pulmonary ventilation measurements to constant conditions allows for comparison of tests with varying gas temperature, pressure and water vapour content between data collections.
VISTPD = VIATPSx(273+27Tr3oom) x (PB-76P0H2O) Equation 3
Figure 3: Continuous pulmonary ventilation monitoring during exercise to maximal exertion. A) resting ventilation b) Steady-state ventilation c) Pulmonary ventilation near maximal exertion.

The following subject data presented in Figure 3 is the continuous monitoring of pulmonary ventilation during an incremental physical exertion ramp test, conducted on a stationary cycle. The participant was setup with a pulmonary mouthpiece and one-way t-shaped valve (Hans Rudolph, Inc. Shawnee, Kansas, USA), with the fV device situated to measure inspired air. Independent measurement of environmental conditions was carried out by a laboratory weather station device. Note the high frequency of breaths that can be observed during end of test (c). The fV signal reaches the baseline before each successive breath, indicating its dynamic performance is suitable for such applications (Figure 3).
Figure 4: Parametric modelling of an fV design via Solid Works software.

Based on this rationale, we have continued research on developing the fV airflow sensor, through design and manufacturing via parametric modelling software and three-dimensional (3D) printing (See Figure 4).
We are working towards finalising results for computational design of an optimised fV for exercise testing, signal quality, dynamic performance, and clinical application. The fV device is simple and durable in design, readily accessible and easily cleaned and maintained, which can potentially reduce costs and minimise research and clinical disruptions due to damage.
Acknowledgements and Funding
This research endeavour has been funded by an Australian Government Ph.D. Research Training Program.
Conflict of Interest
This research was conducted in the absence of any commercial or financial relationships that could be construed as a potential conflict of interest.
References
- Blumenfeld W, Turney S, Cowley R (1973) Mathematical model for flow in the heated fleisch pneumotachometer. Medical and Biological Engineering and Computing 11(5): 546-551.
- Fincane KE, Egan BA, Dawson SV (1972) Linearity and frequency response of pneumotachographs. J Appl Physiol 32(1): 121-126.
- Kreit JW, Sciurba FC (1996) The accuracy of pneumotachograph measurements during mechanical ventilation. Am J Respir Crit Care Med 154(4 pt 1): 913-917.
- Ross SM, Kao FF (1961) Inexpensive pneumotachometer (PTM). J Appl Physiol 16(2): 380-381.
- Stromberg N, Gronkvist MJ (1999) Improved accuracy and extended flow range for a Fleisch pneumotachograph. Med Biol Eng Comput 37(4): 456-460.
- Turney S, Blumenfeld W (1973) Heated fleisch pneumotachometer: a calibration procedure. J Appl Physiol 34(1): 117-121.
- Yeh MP, Adams TD, Gardner RM, Yanowitz FG (1987) Turbine flowmeter vs. Fleisch pneumotachometer: a comparative study for exercise testing. J Appl Physiol 63(3): 1289-1295.
- Yeh MP, Adams TD, Gardner RM, Yanowitz FG (1982) Computerized determination of pneumotachometer characteristics using a calibrated syringe. J Appl Physiol Respir Environ Exerc Physiol 53(1): 280-285.
- Zock JP (1981) Linearity and frequency response of Fleisch type pneumotachometers. Pflugers Archiv 391(4): p. 345-352.
- Frayne R, Holdsworth DW, Smith RF, Kasrai R, Larsen JP, et al.(1994) Turbine flow sensor for volume flow rate verification in MR. Magn Reson Med 32(3): 410-417.
- Bruner H (1947) The hot wire anemometer as a flowmeter. Fed Proc 6(1): 312.
- Caruso H (1973) The use of the hot-wire anemometer in respiratory processes. Acta physiologica latino Americana 24(1): 25-36.
- Lundsgaard J, Gr0nlund J, Einer-Jensen N (1979) Evaluation of a constant-temperature hot-wire anemometer for respiratory-gas-flowmeasurements. Med Biol Eng Comput 17(2): 211-215.
- Plakk P, Liik P, Kingisepp PH (1998) Hot-wire anemometer for spirography. Medical and Biological Engineering and Computing 36(1): p. 17-21.
- Kirkness J, Verma M, McGinley BM, Erlacher M, Schwartz AR, et al.(2010) Pitot-tube flowmeter for quantification of airflow during sleep. Physiol Meas 32(2): 223-237.
- Porszasz J, Barstow TJ, Wasserman K (1994) Evaluation of a symmetrically disposed Pitot tube flowmeter for measuring gas flow during exercise. J Appl Physiol (1985) 77(6): 2659-2665.
- Wolf AR, Volgyesi GA (1987) A modified Pitot tube for the accurate measurement of tidal volume in children. Anesthesiology 67(5): 775-778.
- Fortuna ADO, Gurd JR (1999) Numerically based design of an orifice plate flowmetering system for human respiratory flow monitoring. Ann Biomed Eng 27(3): 356-365.
- Jitschin W (2004) Gas flow measurement by the thin orifice and the classical Venturi tube. Vacuum 76(1): 89-100.
© 2018 Praneel John Titheradge. This is an open access article distributed under the terms of the Creative Commons Attribution License , which permits unrestricted use, distribution, and build upon your work non-commercially.
Editor In Chief


.jpg)


Signup for Newsletter

Quick Links
 Editorial Board Registrations
 Submit your Article
 Refer a Friend
 Advertise With Us
Our Recent Edition

.jpg)


Top Editors


.jpg)


.bmp)
.jpg)
.png)
.jpg)


.jpg)


.png)

.png)


.png)


Financial Support

Sponsors

Latest e-Books

Latest Video

 a Creative Commons Attribution 4.0 International License. Based on a work at www.crimsonpublishers.com.
Best viewed in
a Creative Commons Attribution 4.0 International License. Based on a work at www.crimsonpublishers.com.
Best viewed in