- Submissions

Full Text
Research & Development in Material Science
Enhancement of Photocatalytic NOx Absorption by Ca-doped TiO2 Nanoparticles
Lovlyn Sanjay1*, Apostolos Papadopoulos2 and Ramana Sundara1
1Lincoln Institute of Agri-Food Technology, University of Lincoln - Riseholme Campus, United Kingdom
2Crop Intellect Ltd., Riseholme College, Lincoln LN2 2LG, United Kingdom
*Corresponding author:Lovlyn Sanjay, Lincoln Institute of Agri-Food Technology, University of Lincoln - Riseholme Campus, Lincoln LN2 2BJ, United Kingdom
Submission: December 09, 2024;Published: December 18, 2024

ISSN: 2576-8840 Volume 21 Issue 2
Abstract
Increased NOx gas emissions from the technological development and urbanization from 20th century is one of the major air pollutants. The nitrogen as an essential nutrient for plant’s growth and development can be obtained/adsorbed from air containing nitrogen compounds. Photocatalytic absorption is a method that is used to convert atmospheric nitric oxide into nitrate which is the desired form of nitrogen that is absorbed and assimilated by most plants. In this study, photocatalytic adsorption efficiency of TiO2 and Ca-doped TiO2 is analysed. Along with, materials the synthesis method is also compared. The synthesized materials were evaluated using particle size analyser for particle size, FTIR for bonds in the samples, SEM for morphology, EDAX for elemental composition, NO3- meter for NO3- conversion ability of the samples. Calcium doping over TiO2 enhances the NO3- conversion ability of undoped TiO2. Treatment 3 (R-Leaf) performed significantly better in producing nitrate under outdoor light conditions, demonstrating its potential to be utilised in crop production as a replacement for synthetic nitrogen.
Introduction
Industrialisation has brought great prosperity to the economy and technological growth of a country but failed to preserve the quality of environment, resulting in air pollution, contamination of river, lakes and other water bodies, soil degradation and so on [1].
Air pollution is currently one of the alarming issues in the world that causes serious health and environmental threats. Exposure to polluted air is solely responsible for almost 16% death globally and it is found that children are more vulnerable to get sick even at very low exposure to toxic air [2]. It is estimated that about seven million people die due to air pollution worldwide every year. 99% of the global population inhale air with high pollutants [3].
Figure 1:Images of effects of air pollution in the cities of (a) Paris [4] and (b) New Delhi [5].
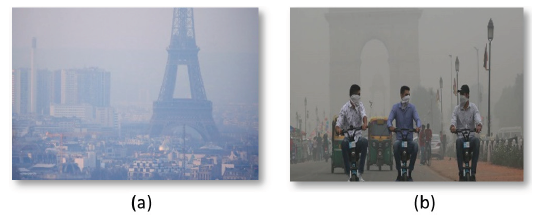
Over the past 200 years, urbanization and industrialization has resulted in a release of a wide range of environmental toxins into the atmosphere [2]. Air pollution is not only caused by human activities but also by natural sources such as forest fires, volcanic eruptions, dispersion of pollen grains, etc. However, human activities such as agriculture, energy production, industries and factories, transportation, heating and cooling systems, household activities (Figure 1; [4,5]), and several other human activities cause a major impact on the atmosphere [6]; Table 1.
Table 1:Major pollutants and their sources.

Nitrogen Oxides (NOx)
NOx gases are released from natural sources such as nitrogen cycle and lightning bolts and human activities that include transportations (cars, buses, trucks, and other non-road vehicles such as ships, airplanes, railways, etc.,) as well as from industrial sources namely commercial boilers, heaters, and coolers, cement kilns, power plants, turbines, mining, oil and gas extraction, etc. NOx emissions from natural sources are less than 10% of the total NOx emission [7]. These gases are mainly emitted due to the combustion of fuel at high temperatures. NOx has many adverse effects on human health and the environment.
Due to its low solubility in water, nitric oxide, also called nitrogen monoxide spreads throughout the respiratory system. They diffuse through the alveolar cells and the adjacent capillary vessels of the lungs disrupting the alveolar structures and their function in the lungs [8]. Inhaling high concentrations of nitrogen dioxide irritates the human respiratory tract causing cough, wheezing, or breathing difficulties and can aggravate respiratory diseases notably asthma. Long-term exposure to these gases can lead to respiratory infections and chronic lung diseases. These gases can also affect the senses of human beings, for example, the person’s ability to smell can be reduced [9-11].
Oxides of nitrogen highly reactive gases. The oxides of nitrogen react with water, oxygen, and other chemicals in the atmosphere to form acid rain which can not only affect sensitive ecosystems such as lakes and forests but also buildings and other areas. The nitrate particles make the air hazy by reducing visibility. NO2 can make the fabrics and furnishings fade and decolorize. The NOx presence in the atmosphere gives rise to nutrient pollution [9-11].
Photocatalytic NOx absorption
Nitrogen is a vital nutrient throughout the growth and development of plants. It is an essential component of photosynthesis. Particularly, the Specific Leaf Nitrogen (SLN) has an influence on photosynthesis as nitrogen content decides the pigment of the leaf and nitrogen is a basic component of various biomolecules such as RNA, DNA, protein, enzymes, chlorophyll, ATP, auxin, and cytokinin that are a part of photosynthetic process [12,13].
Low nitrogen availability in soil and the inability of plants to get the available nutrition due to competition between plants and other environment factors are the primary factors that limit the growth and yield of plants [12,14]; (Table 2, Figure 2).
Table 2:Nitrogen oxide and their properties [7].

Figure 2:Working of the photocatalyst [17].
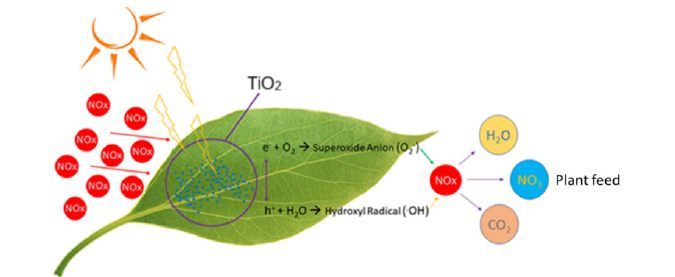
When the catalyst is exposed to sunlight, electrons and holes are generated. The electrons (e-) which are negatively charged attract oxygen from the atmosphere and forms superoxide anions (O2-). The positively charged holes (h+) interact with water molecules in the atmosphere and forms hydroxyl radicals (OH). When the NOx gases in the atmosphere react with the formed superoxide anion and hydroxyl radical, NOx is broken into nitrate (NO3-), water (H2O), and carbon dioxide (CO2) which are necessary for plant growth [15]. TiO2 is a biocompatible material with a high photocatalytic activity making it a suitable material for the study. In the present study, the photocatalytic conversion of atmospheric NOx into valuable nutrients for the plant through TiO2 photocatalyst with surface modification by alkaline earth metals was investigated. Along with this, the novel synthesis method has been developed for the present photocatalyst.
Experimental Procedure
Materials
Titanium Tetra Isopropoxide (Sigma Aldrich,97%), Calcium Carbonate (Sigma Aldrich >=98%), Ethanol (Sigma Aldrich, absolute ethanol EMSURE® ACS Reagent), Distilled water, and Nitric Acid (Sigma Aldrich, EMPLURA®, 65%) were used for the synthesis of doped and undoped TiO2 nanoparticles.
Synthesis of TiO2 particles
The TiO2 nanoparticles were synthesized by two methods, solgel and sonication assisted sol-gel method. First, an appropriate amount of 30ml titanium tetra isopropoxide was added dropwise in 50ml ethanol. The acidity of the solution was maintained by 10ml of 1.3% nitric acid solution. The solution was made up of another 50ml ethanol and kept solution under stirring for couple of hours. After the precipitate was completely dispersed in the solution, a heat of 50 °C is applied to the solution. The dried sample was placed in the furnace at 60 °C for 5 hours. Then the sample was ground well to form TiO2 nanoparticles. In another method, sonication assisted sol-gel method was developed for synthesis of nanoscale TiO2. In this method, 100ml titanium tetra isopropoxide was added dropwise in 250ml of ethanol under stirring at 200rpm for 40 minutes. Distilled water was added in drops till the precipitate was formed. The solution was sonicated until it became opaque and yellow. The nitric acid solution was added dropwise and sonicated. 200ml of distilled water was added at a fast pace and sonicated again. After 1 hour and 45 minutes of spinning, a heat of 50 °C is applied to the solution. When the solution becomes dry it is ground well and then TiO2 nanoparticles are obtained (Table 3).
Table 3:Names of the samples synthesized.

Synthesis of CaCO3 doped TiO2
Appropriate amount of finely ground CaCO3 powder was weighed and mixed with finely ground the formed TiO2 powder using mortar and pestle. The mixed powder was then heated at 650 °C for 4 hours in the muffle furnace. Thus, Ca-doped TiO2 nanoparticles are formed.
Nomenclature
The synthesized samples are named based on the synthesis procedure and doping as shown in Table 2. The first two samples are synthesized by sol gel method with and without calcium doping and the rest two samples are synthesized by sonication assisted sol-gel method with and without calcium doping.
Characterisation
The particle size, the bonds present in, the morphology and the absorption range of the synthesized TiO2 particles and the Ca and doped TiO2 particles were studied by DLS, FTIR, and UV - Visible Spectroscopy. The particle size of the samples was measured using the particle size analyser. The functional groups present in the samples were analyzed by FTIR. The morphology of the samples was viewed by Scanning Electron Microscopy. The percentage of the chemicals present in the samples was confirmed by Energy Dispersive X-ray Analysis. The absorption properties of the samples were observed using UV - Visible Spectroscopy.
Determination of NO3- conversion capability
Two sets of 0.5g of all the four samples were taken in different vials and were named. A small quantity of N2 gas is passed into all the vials. One of the sets was placed under UV radiation as shown in Figure 3(a) and the other set was placed under fluorescent light as shown in Figure 3(b). Both the sets were kept under the lights for 3.5 hours (Figure 3 & 4; Table 4).
Figure 3:Samples under (a) UV radiation and (b) fluorescent light.
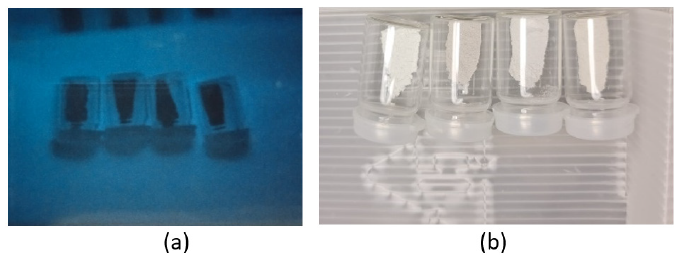
Figure 4:Particle size analysis of (a) T1, (b) T2, (c) T3, and (d) T4.
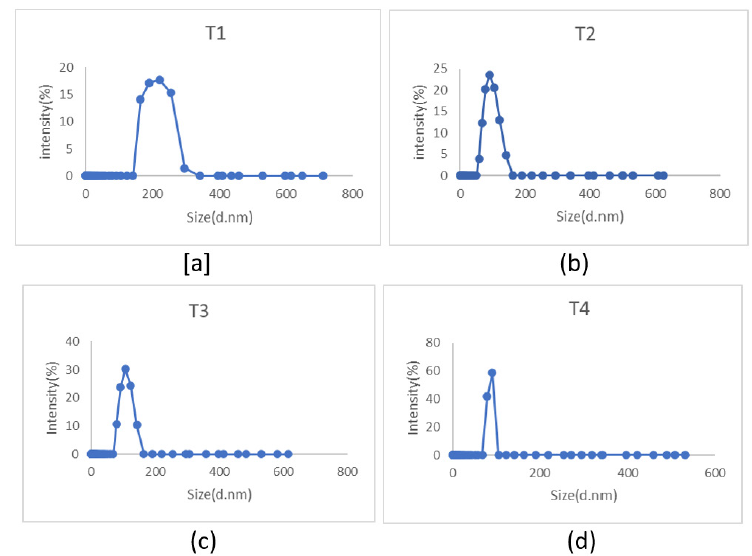
Table 4:Particle size of the samples.

Results and Discussion
Particle size analysis
The size of the samples T1, T2, T3, and T4 were analysed using particle size analyzer. The average particle size of the samples is tabulated in the Table 4.
From the particle size analysis, it is observed that the particles synthesized by sonication assisted sol-gel method has smaller size than the conventional sol-gel method. The sample prepared by conventional sol-gel method with Ca doping has shown the highest particle size of 130.46nm among the other samples while the material prepared by modifying the sol-gel method using sonication has shown lesser particle of 114.59nm in spite of Ca doping.
Bonding analysis
To study the presence of functional groups and compositional confirmation the FTIR spectra were recorded of the samples T1, T2, T3, and T4 (Figure 5). The peaks found around 400-600cm-1 in the FTIR spectra of all the four samples indicate the Ti - O bonds [16- 18]. The peak formed around 800cm-1 in the samples is due to the presence of CaCO3 in the sample [19].
Figure 5:(a) Bonding analysis of T1 (b) Bonding analysis of T2 (c) Bonding analysis of T3 (d) Bonding analysis of T4.
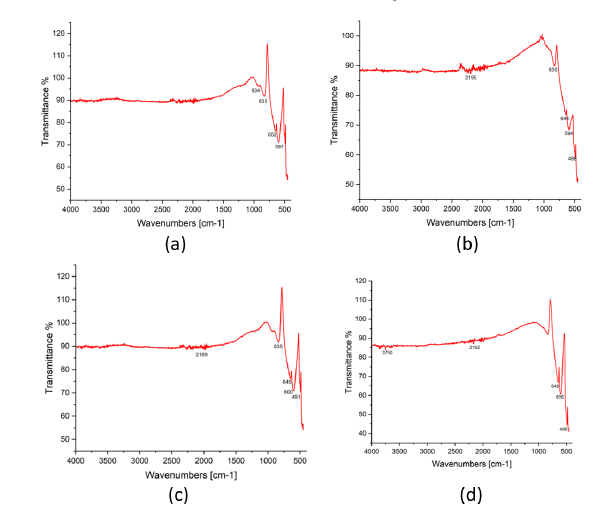
The peaks, 2195cm-1 and 2169 in the samples T2 and T3 respectively might be due to the interference of alkyne bonds from the atmosphere. The peak formed around 3750cm-1 in T4 might be due the O-H from the atmosphere [20].
Morphological studies
The morphology of the samples was analysed by scanning electron microscope. The elements present in the samples were confirmed by energy-dispersive x-ray spectroscopy.
SEM image of all the samples under 10μm resolution can be seen in the Figure 6. The agglomerated clusters of the samples can be seen in the image. The doped samples T1 and T3 which are shown in Figure 6(a) & 6(c) appear to be bigger than the undoped samples which are shown in Figure 6(b) & 6(d); (Table 5, Figure 7 & 8).
Figure 6:(a) SEM and EDAX result of T1 (b) SEM and EDAX result of T2 (c) SEM and EDAX result of T3 (d) SEM and EDAX result of T4.
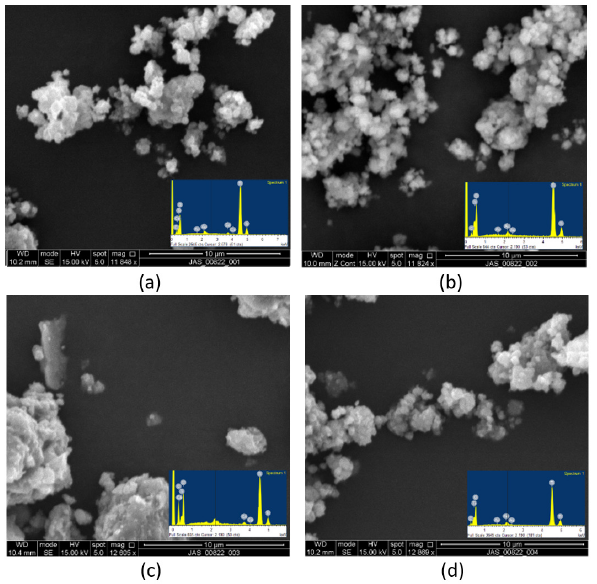
Figure 7:NO3- meter.
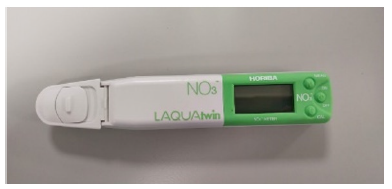
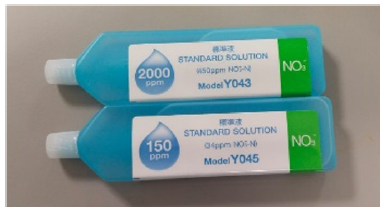
Figure 8:Tester solution.
NO3- conversion capability
After 3.5 hours of exposure to UV and fluorescent lights, the samples were taken away from the lights. 0.5g of the samples were taken and diluted with distilled water. The NO3- conversion capability of the samples was tested using the NO3- meter. The zero error of the device was checked with the tester solution. Then the readings for the samples are shown in Table 5.
Table 5:Sample response to UV and fluorescent light.
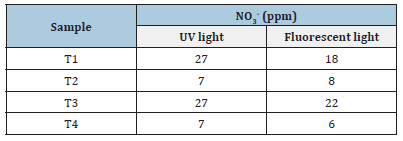
From the Table 5, we can see that samples were able to form NO3- molecules. It is clear that the doped particles have more capability to form NO3- molecules than undoped particles. The samples also possess more NO3- conversion ability under UV light compared to fluorescent light. T3 has around 4 times higher photocatalytic properties under UV light and around 3 times under fluorescent light than other samples [21,22].
Conclusion
Photocatalytic absorption of atmospheric nitric oxides into nitrates is a method that can be applied to simultaneously improve the nitrate absorption in plants and reduce the environmental pollution.
In this study, Ca-doped TiO2 nanoparticles are prepared by two methods and its ability to convert NO3- particles are tested and compared with undoped TiO2 nanoparticles. It is observed that the Ca-doped TiO2 possesses better photocatalytic absorption compared to undoped TiO2 nanoparticles. The sonochemically synthesized Ca-doped TiO2 has 3 times higher conversion compared to the other under fluorescent light and can be considered a suitable photocatalyst and can be used for further studies such as plant testing and then field testing.
Acknowledgement
The author expresses sincere gratitude to Crop Intellect Ltd., Lincoln for giving the opportunity to conduct this study and sharing their knowledge. The authors are thankful to the officials of Joseph Bank Laboratories, University of Lincoln for their support and providing access to work in the laboratory during the time of COVID 19.
References
- Raihana Nazirah Roslan T, Rukayyah Al-Munirah Ayob M, Yi Sean O, Zainuddin N (2022) Risk of Air Pollution from Industrialization Towards Health: A Comparative Risk Assessment. EDPACS 65(5): 1-16.
- Power AL, Tennant RK, Jones RT, Tang Y, Du J, et al. (2018) Frontiers in Earth Science 2018, 6,131.
- World Health Organisation (2021).
- BBC News (2021).
- The Indian Express (2020).
- Ashmore M (2013) Encyclopedia of Biodiversity 1: 136-147.
- (1999) Nitrogen oxides (NOx), why and how they are controlled. United States Environmental Protection Agency, Clean Air Technology Center, North Carolina, USA.
- Boningari T, Smirniotis PG (2016) Impact of nitrogen oxides on the environment and human health: Mn-based materials for the NOx Current Opinion in Chemical Engineering 13: 133-141.
- United States Environmental Protection Agency (2021).
- United States Environmental Protection Agency (2021).
- https://www.qld.gov.au/environment/management/monitoring/air/air-pollution/pollutants/nitrogen-oxides
- Andrews M, Raven JA, Lea PJ (2013) Do plants need nitrate? The mechanisms by which nitrogen form affects plants. Annals of Applied Biology 163: 174-199.
- Bassi D, Menossi M, Mattiello L (2018) Nitrogen supply influences photosynthesis establishment along the sugarcane leaf. Scientific Reports 8(1): 2327.
- Novoa R, Loomis RS (1981) Nitrogen and plant production. Plant and Soil 58: 177-204.
- von Wirén N, Gazzarrini S, Frommer WB (1997) Regulation of mineral nitrogen uptake in plants. Plant and Soil 196(2): 191-199.
- Engels C, Marschner H (1995) Nitrogen fertilization in the environment. Pp: 41-81.
- Crop Intellect (2021).
- Rajakumar G, Rahuman AA, Roopan SM, Khanna VG, Elango G, et al. (2012) Fungus-mediated biosynthesis and characterization of TiO2 nanoparticles and their activity against pathogenic bacteria. Spectrochimica Acta Part A: Molecular and Biomolecular Spectroscopy 91: 23-29.
- Bagheri S, Shameli K, Abd Hamid SB (2013) Journal of Chemistry 2013.
- Vetrivel V, Rajendran K, Kalaiselvi V (2015) Synthesis and characterization of Pure Titanium dioxide nanoparticles by Sol- gel method. International Journal for Chem Tech Research 7(3): 1090-1097.
- Reig FB, Adelantado JG, Moreno MM (2002) FTIR quantitative analysis of calcium carbonate (calcite) and silica (quartz) mixtures using the constant ratio method. Application to geological samples. Talanta 58(4): 811-821.
- https://www.sigmaaldrich.com/GB/en/technical-documents/technical-article/analytical-chemistry/photometry-and-reflectometry/ir-spectrum-table
© 2024 Lovlyn Sanjay. This is an open access article distributed under the terms of the Creative Commons Attribution License , which permits unrestricted use, distribution, and build upon your work non-commercially.
 a Creative Commons Attribution 4.0 International License. Based on a work at www.crimsonpublishers.com.
Best viewed in


.jpg)


 Editorial Board Registrations
 Submit your Article
 Refer a Friend
 Advertise With Us
.jpg)


.jpg)


.bmp)
.jpg)
.png)
.jpg)


.jpg)


.png)

.png)


.png)


