- Submissions

Full Text
Research & Development in Material Science
Warranty Forecast implementation for Problem Solving- An Automobile Case Study
Madan Jagtap*
Symbiosis Institute of Operations Management, Constituent of Symbiosis International (Deemed University), India
*Corresponding author:Madan Jagtap, Symbiosis Institute of Operations Management, Constituent of Symbiosis International (Deemed University), Pune, Maharashtra, India
Submission: May 02, 2024;Published: May 20, 2024

ISSN: 2576-8840 Volume 20 Issue 1
Abstract
The current task involves putting management techniques into place to lower warranty costs and estimate warranties using truncated data sets for claims that are available for passenger car steering movement that is excessive at the time of repair. The idea is that while repairing a device during its warranty period in response to a customer’s claim, keeping track of the number of claims and their frequency aids in identifying the product’s main issues. Seven quality control instruments were provided with Analogously, the Plan-Do-Check-Act cycle steps improve issue solving. A management technique called the Augmented Plan-Do-Check-Act cycle aids in identifying potential reasons for steering movement resistance. The primary reason for the harsh steering movement is the Prevailing Torque Type nut’s wear out, which also affects the valve body’s axial motion and creates friction. Dealers have first-time failure data going back five months, which can be used as a data set for warranty projections. The Monthly In-Service (MIS) of the product is compared with repair per thousand (R/1000), cumulative hazard rate, and cost per unit (CPU) for each manufacturing month. The Reliasoft statistical analyser’s Synthesis 9 software was used to analyse the data set and forecast the warranty. The data was organized by the month of manufacturing and the month of the dealer’s first claim. Additionally, synthesis 9 makes it easy to analyse the product’s reliability; Weibull distribution forecasts warranty returns for the following six months, which indirectly indicates warranty cost, which must be applied at the time of product sale. It also helps to maintain minimum variance during analysis. It was determined that in order to reduce warranty costs, the Plan-Do-Check-Act cycle should be implemented as a management technique during the product development phase. In terms of warranty cost analysis, or forecasting, the Weibull distribution is a statistical tool that helps to improve product warranties by assessing future warranty claims and their likely costs during the development stage.
Keywords: Warranty; Forecasting; CPU; P-D-C-A; Reliability
Introduction
An automobile is an extremely complex product, with about 7000 parts. Although it is preferable to use the greatest quality and reliability methods during the development, manufacturing, and assembly stages of a product, unanticipated failures do happen during warranty periods, costing automakers billions of rupees a year in warranty claims. Programs to lower warranty costs are highly prioritized in these industries. Teams from many industries collaborate to meet objectively set goals for reducing warranty costs, which are frequently based on the warranty claims of cars from prior model years. Forecasts are crucial because if they are much higher than actual repairs or complaints, it could lead to needlessly expensive design, production, or service actions.
However, suppose they are much lower than the actual repairs or complaints. In that case, there may be a false sense of security that the year-end targets for warranty returns would be met, which could result in higher-than-expected warranty expenses. Usually completed after the year’s first quarter, forecasting provides a prognosis nine months in advance. These forecasts vary in scope from subassemblies like turbochargers, torque converters, and pumps to big assemblies like engines and transmissions. Now and then, a significant consumer concern like fluid leaks, engine sound, low power, difficult steering, etc. is also directly addressed. In addition to assisting vehicle engineers in optimizing their approaches for reducing warranty costs through design, manufacture, or servicing, a reliable forecasting technique also helps the business prepare to pay any unused warranty costs. Most businesses want to give their clients the highest-quality goods possible. The majority of these initiatives are focused on research and development. The research explores the profitability and pricing strategy of complimentary extended warranties, emphasizing the influence of customer risk attitudes on the success of this warranty model. It also discusses the importance of online registration in attracting customers to avail of the extended service, showcasing how manufacturers can benefit from customer information for targeted marketing and product improvement. The research also suggests future research directions, such as considering dynamic post-purchase decision processes and customer preferences for product replacement, to enhance the effectiveness of warranty policies. Product quality is nearly entirely established once drawings and specifications are finished Reliability Analysis and Prediction with Warranty Data and production processes are chosen, according to Wu [1].
The production engineers are then limited in their ability to enhance product quality. The study introduces a novel fuzzy system integrated with a genetic algorithm to optimize profit and minimize waiting time by analysing the impact of sales price and warranty length on customer demand in a service centre, showcasing effective decision-making in industrial engineering applications. Numerous tasks are carried out during the development stage, such as robust design trials, design verification planning and reporting, concept/design failure mode and impacts analysis, and so on. In lab life testing, the efficacy of these efforts in producing dependable and durable goods is frequently assessed. A car is an extremely complex product since it has hundreds of pieces and interactions between them. It turns thorough testing and analysis into an unmanageably large, if not impossible, undertaking at the stages of product development, manufacture, and assembly. Therefore, it is not uncommon for there to be an unanticipated lack of quality and reliability once the car is put on the market, which would result in expensive warranty expenses.
When evaluating the success of product development, manufacture, and assembly, it is common to look for issues with quality and reliability that arise after the vehicle is put into service. The following definition of reliability has been used historically [2]. The likelihood that a piece of machinery, equipment, or a system will function flawlessly for a predetermined amount of time under predetermined circumstances. The term given above more closely pertains to laboratory testing, when test conditions are more precisely defined. Nevertheless, it’s possible that the item’s listed conditions differ from the real ones faced when using it in the field. A production inventory model integrating carbon emission control and warranty policy, utilizing meta-heuristic algorithms and c-r optimization techniques for optimal decision-making. Key factors include interval-valued parameters, defective production considerations, and suggestions for model enhancements to address time-dependent production rates and green credentials [3].
The goal is to determine how a Two-Dimensional Warranty period for remanufactured products using the sensor information about the age and usage of each and every. End-Of-Life product on hand to meet product, component and recycled material demands while minimizing the cost associated with warranty and maximizing remanufacturer’s profit. The main objective was to extend the product life cycle by producing remanufactured products and providing a Two-Dimensional Warranty policy for end-of-life products in order to help change the customer perspective towards remanufactured products’ quality and to reduce the environmental burden [4].
Under a renewing policy, whenever an item fails within the warranty period, it is replaced by a new identical one, and the new replacement is attached with a new warranty; while the repair or replacement of a failed item protected by a non-renewing warranty does not alter the original warranty. The existing studies on warranty cost modelling and analysis focus predominately on renewing free replacement warranty, non-renewing free repair/ replacement warranty, and hybrid or combination warranty, among others [5].
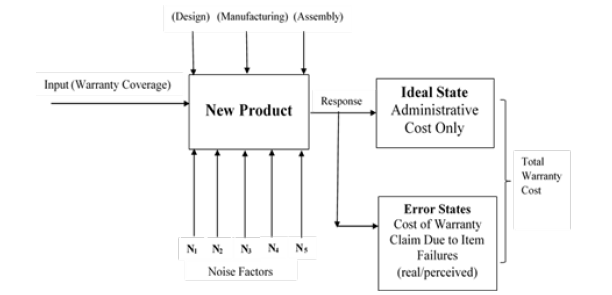
For instance, the fact that users might utilize a steering wheel assembly as a handle to enter the vehicle may not be covered by the conditions provided for laboratory testing. The term encountered is more suited to use instead of the word mentioned in the definition of reliability, according to Meeker [6]. Nevertheless, it is nearly impossible to duplicate possibly every usage condition found during laboratory testing. As a result, design engineers cannot fully rely on the results of laboratory life testing to provide feedback and confidence regarding field performance. It has been shown that compared to laboratory data, field data offer more trustworthy information regarding the distribution of life [7]; [8]. Actual usage patterns and the cumulative effects of environmental exposures are captured by field data, which are challenging to replicate in a lab setting. Fleets of production cars are occasionally used by automakers to get quick feedback on the type of field failures [9]. The modest number of cars in the fleet provides easily available data, making the modelling and analysis of such data not a major challenge [10]. But in automakers, warranty data is the primary source of field data access. Therefore, in order to get more precise design feedback, engineers and designers working on current and future model cars also anticipate receiving warranty data. Using warranty data, engineers and Six Sigma black belts can find ways to reduce warranty costs through suitable design, manufacturing, or service fixes. Using a parameter diagram, Figure 1 illustrates some of the key elements that affect a new car’s total warranty cost [11]. The inherent reliability of a product is determined by the choices and actions made during its design, manufacture, and assembly, according to Murthy [12]. Robust products function well even when there are noisy sources present. It makes sense that the more factors related to design, manufacture, and assembly are under control [13].
Figure 1:Factors influencing warranty cost [13].
Where,
N1- Variations in production from piece to piece
N2- wear and tear on components
N3- Variations in consumer behaviour, such as individual customers’ mileage accumulation
N4- Changing weather and road conditions
N5- Relationships between smaller systems
Research Methodology
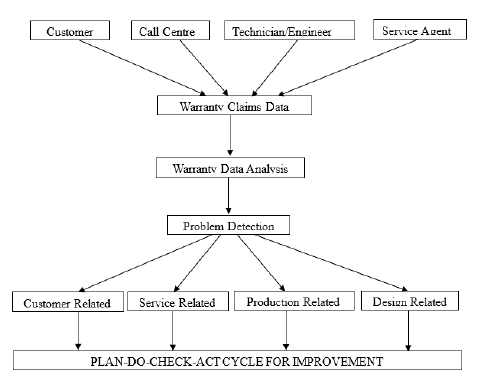
To improve present product designs, data from industry sources is analysed and suitable management systems are applied. Estimating warranty costs is aided by data obtained from insurance claims. Further warranty forecasting provides results regarding the risk of putting the price and duration of the warranty for that product into effect. One method of making a product cheaply priced is through a warranty. Evaluating the advantages and disadvantages of offering a warranty is a difficult undertaking. Reliability engineers are frequently asked to evaluate the risk associated with offering a system warranty. Of course, providing a warranty for an unproven technology is quite risky. However, failing to provide a guarantee for their products has a risk as well because it means greater life cycle costs for the customer, particularly if the competition offers a warranty. Figure 2 explains the study methodology for problem detection with warranty data analysis and how the P-D-C-A cycle is used to solve the problem.
Figure 2:Problem detection flow chart.
Data Analysis
To provide meaningful and practical findings, data analysis needs to be done at three different levels, by an analyst with a strong background in statistics, and by someone who understands the warranty process inside and out. The following lists the three different analytical levels.
Level 1
Customer complaints via text are typical. Text mining algorithms provide a methodical way to recognize and classify the complaints’ raised issues. When a customer reports a problem, it commonly happens that the customer care agent is unable to determine what caused it.
Level 2
This can require more than one step. The first phase involves merging data to assess product-level failures without differentiating between MOP and MIS, and then doing a Pareto analysis based on failed components and/or failure mode. These assessments identify the most common modes of failure and highlight the weakest parts (low dependability). The second stage is to plot failure data at the product level, which means organizing the data based on MOP, MIS, or other criteria without distinguishing between them based on fault code. These results are used to produce a variety of graphs, such as time series plots, MIS-MOP plots, and plots that show how time is related to MOP.
These evaluations look for noticeable trends or sudden changes that could indicate a problem. An analysis similar to the second stage’s has to be done in the third stage, but in greater detail— for example, for each unique fault code or any other important classification. Determination of Problems Predefined rules for detection are used to identify problems; these rules are often the same as those that are used to identify quality variation based on control.
Any detection rule is susceptible to two different kinds of
errors:
a) Type 1 error: When there is an underlying issue, the rule
says there isn’t a problem.
b) Type 2 error: When there isn’t one, the rule suggests that
there is.
The uncertainty resulting from small sample sizes and the dearth of available data are the primary drivers of these mistakes.
Level 3
There are two types of analysis at Level 3. The first phase entails having internal or external experts do a comprehensive study of malfunctioning components in order to better understand the causes of the various types of failures. Understanding the failure mechanism and its contributing factors (material used, vendor, and design, for example) is necessary to achieve this. The other is to link component failure to certain processes (such as design approach, production quality control, etc.) at various points in the product life cycle. In either case, substantial information is required for problem detection and increasingly advanced technologies are required.
Problem Detection
Customer related problems
Customer data collected by service agents at the time a warranty claim is made, and customer surveys are the two primary sources of information utilized to detect issues related to customers. Rising trends in the proportion of consumers dissatisfied with the product’s performance and/or warranty services provided point to needs and opportunities for improvement.
Service-related problems
The primary source of data used to identify service-related problems is customer complaints regarding warranty servicing and reimbursement claims. For this type of data to have the most impact, it must be carefully examined for each service agent. The information needed includes labour costs, service times for specific labour or defect codes, and other critical metrics, many of which are product specific. The service agents’ values are then compared to determine which have much higher or lower values. Significant differences imply that there might be a problem with the service representative.
Production related problems
Most of the knowledge on this topic comes from the service agents’ maintenance of malfunctioning equipment. The production department and component suppliers supply the data. In addition to the component’s manufacturer which could be the company that makes the product or an outside vendor the data must enable the identification of a problematic component by batch number or manufacturing month.
Design related problems
The primary source of data on design features is the extensive study carried out at Level 3. The analysis’s objective is to comprehend the failure mechanism and the design flaws that neglected to account for it. The problem with the analytical level is shown in Table 1.
Table 1:Problem type and level of analysis.

Non-parametric data analysis
Data analysis begins with the use of graphical and analytical approaches in order to gain insights and make conclusions without making any assumptions about the mathematical formulation that is appropriate for modelling the data. Nonparametric methods are essential in this type of data analysis. They provide a compromise for creating more structured models that allow for more precise inferences with a degree of assurance about the model’s underlying assumptions. Because of this, nonparametric methods are often known as distribution-free approaches.
The nonparametric technique allows the user to analyse data without assuming anything about the underlying distribution. Put another way, the technique doesn’t need to know the composition of the sampled population. The nonparametric approach has a few inherent disadvantages in addition to several advantages. When data analysis is done without assuming an underlying life distribution, several potential issues that could result from making incorrect assumptions about the distribution are avoided. However, because information loss occurs, using nonparametric techniques on data that can be handled by parametric procedures is inefficient.
Specifically, the nonparametric technique typically yields wider confidence bounds than the parametric approach, and it typically precludes making predictions outside of the observational range. Any set of warranty data should ideally undergo a nonparametric analysis before proceeding with parametric analyses predicated on the identification of a certain underlying distribution. The application of nonparametric methods to draw conclusions about distribution functions F(t), density functions f(t), reliability functions R(t), hazard functions h(t), cumulative hazard functions H(t), renewal functions M(t), mean cumulative function (MCF) l(t), and warranty claim rates (WCR) at the product, component, or intermediate level. Future warranty expenses may be predicted and estimated using these quantities. Estimates of M(t), for instance, are required to calculate warranty costs for the non-renewing FRW policy in cases where defective products are replaced with new ones, and of l(t) in cases when defective items are fixed with little repair.
For the automotive sector Repairs per thousand, cost per unit, and hazard rate are used in non-parametric analysis. Table 2 illustrates how changes in a product’s month of manufacture and subsequent month of service affect its hazard rate, repairs per thousand, and cost per unit. Tables for the production months of September, October, November, December, and January are provided. The hazard rate, repairs per thousand, and cost per unit are shown to vary with the month of service.
Table 3 shows end values of hazard rate, repairs per thousand and cost per unit for each month of production.
Table 2:Warranty claim data for successive MOP.

Table 3:Hazard rate H(t), cost per unit and repair per 1000 data for successive months.

For Studying variations with month in service, Table A1 (data taken from appendix) explains variation of cumulative hazard rate for month of production with successive month in service, for successive month in service hazard rate increases as month in service increases and afterwards it decreases, Figure 3 is to show variations graphically.
Figure 3:Hazard rate variation with MIS.
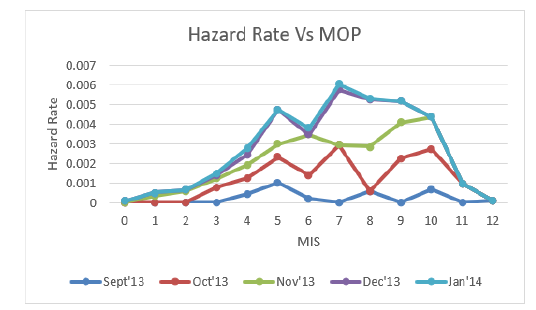
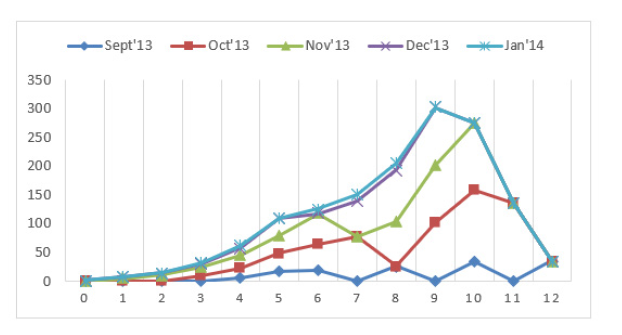
Table A2 shows variations of cost per unit for month of production with successive month in service and Figure 4 shows variations graphically, for successive month in service Cost per unit increases as month in service increases and afterwards it decreases, it has been observed that this much data analysis is not sufficient, therefore it requires parametric analysis for data.
Figure 4:CPU Variation month wise.
Parametric data analysis
The parametric approach to data analysis is concerned with
the construction, estimation, and interpretation of mathematical
models as applied to empirical data. This involves the following
three steps:
Step 1: Model selection
Step 2: Estimation of model parameters
Step 3: Model validation
Step1: Model selection
There are two basic approaches to selecting a model (1) Physics-based modelling, where the model is based on a physical theory, and (2) Data-dependent modelling, where the model is developed solely on the basis of the available data.
The models involve either statistical parametric life distributions or the density or hazard functions associated with them. There are a number of parametric models that can be used successfully in modelling warranty data.
Step2: Estimation of model parameters
The model will ordinarily involve one or more parameters
whose values are unknown. Method for using sample data to
estimate unknown parameters were discussed.
Step3: Model validation
Validation is the process of determining the degree to which a
selected model (along with the assigned or estimated parameter
values) is an accurate representation of the real-world problem
of interest. A poor fit of model (either graphical or analytical) may
occur for two reasons: (1) the model is incorrect, or (2) the model is
correct, but the parameter values specified or estimated may differ
from the true values by too great an amount. Several approaches
can be used for model validation. A straightforward approach to
validating the model involves a goodness-of-fit test. Some of the
commonly used statistical tests for validating model are the Chi-
Square test, the Kolmogorov - Smirnov (KS) test and the Anderson
- Darling (AD) test,
Data depending modelling
Model selection: Even with two or three failures for engineering analysis, the Weibull approach may operate with incredibly small samples. This attribute holds significance in the context of aeronautical safety issues and in small-scale development testing. (Bigger sample sizes are required for statistical significance.) Weibull analysis allows for the implementation of sophisticated techniques like failure forecasting and test design substantiation. Figure 5 illustrates the variation of the cumulative density function with time length. This function, often referred to as probability Weibull, is plotted to determine how well the curve fits the existing data. It concludes that the Weibull distribution and the available data fit each other well.
Figure 6 illustrates the quantity of suspensions and failures for the provided data. Suspensions are values for products that have not failed throughout their lifetime; failure suspension also indicates that several products may fail at a later date. The failure/Suspensions (F/S) indicates that how it occurs particular time interval. It is indicative of the failure time for the particular rejection component. It gives the value of the β, which conclude the problem about the PTT nut.
Figure 5:Probability weibull plot.
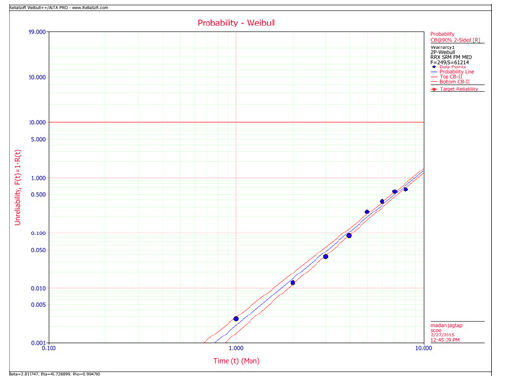
Figure 6:F/S timeline.
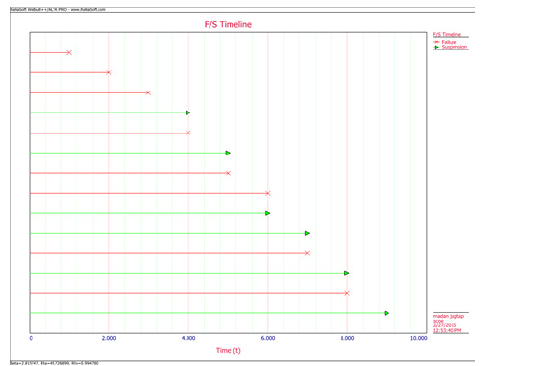
Table 4 projects the number of hard steering movement failures throughout the course of the next several years. It also indicates an increase in failures, which is directly related to an increase in product warranty costs.
These failures are unpleasant surprises if they transpire during the design lifecycle. This class includes a wide variety of mechanical failure modes, and for generic failure modes, beta is predictable.
Beta fluctuates between 2.5 and 4.0 for low cycle fatigue.
Ball bearing failures - beta = 2.0, roller bearings - beta = 1.5
Corrosion, erosion- beta =2- 3.5,
However, stress corrosion will be 5.0 or greater
V-belts - beta = 2.5
In current case β = 2.8157
And also increase in failure rate that explains
Result: N2- Wearing out of parts with time and usage
Table 4:Warranty forecast with successive month of production.

Implementation of P-D-C-A Cycle
Plan: First, pinpoint the precise nature of the issue. To truly get to the bottom of things, you can use tools like the Why, Cause and Effect Diagrams, and Drill Down to find it. After completing this, it might be good to gauge the workflow. After that, gather any further data you’ll need to begin outlining potential solutions. Analysing Cause and Effect is shown in Figure 7. Taking into account the child portion and assemblies, it is determined that the PTT nut was discovered to be loose.
Figure 7:Root-cause analysis for detected problem.
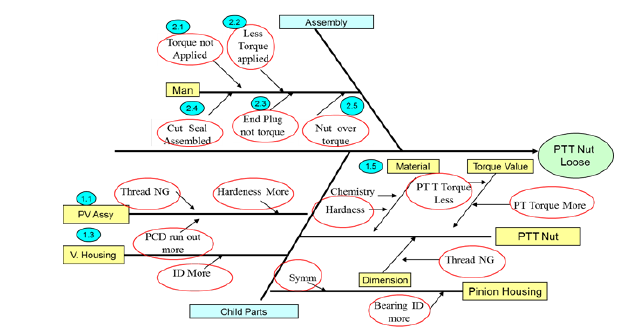
Table 5:Identify the root causes: outflow.

Table 6:WHY-WHY analysis.

Testing for issues found during the plan phase is crucial, but it’s also crucial to look for solutions. Tables 5 & 6 demonstrate the need for a stopper to halt the axial movement of the rack on the machine during Plan Make sure to test any issues found during manufacturing and operation that will be fixed. It was discovered that there is an axial shift in the valve housing assembly stopper, which needs to be prevented. Additionally, defects in the PTT nut itself were discovered, necessitating a post-manufacturing PTT inspection.
Do: Table 7 shows observations for three assemblies, all has NO-GO situation while testing.
Table 7:PTT nut in working condition.

Check: Table 8 explains results for Prevailing Torque Type (PTT) nut fatigue test, Table shows fault with handling process of PTT nut. Figure 8 shows observation of Fatigue test graphically.
Act: Table 9
Figure 8:PTT nut fatigue test histogram.
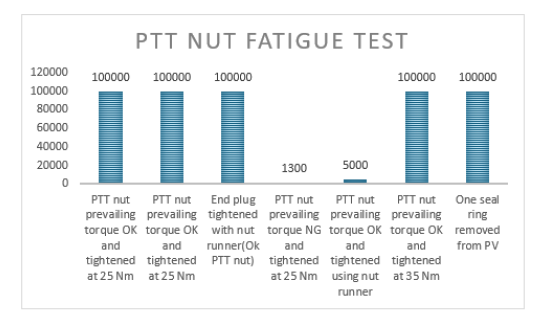
Table 8:PTT nut testing.

Table 9:Modification in PTT nuts

Result and Discussion
It is observed after implementation of PDCA to detected problem it helps in reduction of rejection in recalls for product under warranty, refer Table 10.
Table 10:Modification in PTT nuts

Conclusion
Through the application of a case study, it is evident that data analysis is a crucial component of research methodology, as it allows for the precise identification of issues with warranty claim products during servicing. This is achieved by identifying the problem as noise factor, as indicated by the value of β = 2.8157, and making it simple to identify issues with service agents and production. The QC story’s Plan-Do-Check-Act cycle is helpful in identifying real-world issues, and steering movement hard data reduces product risk. Plan-Do-Check-Act cycle application done methodically identifies and eliminates PTT nut related issues.
Appendix
MOP: Month of Production; MIS: Monthly in Service; CPU: Cost Per Unit; PTT: Prevailing Torque Type; QC: Quality Control; PDCA: Plan-Do-Check-Act; NG: No Go; KS: Kolmogorov Smirnov; AD: Anderson Darling; MCF: Mean Cumulative Function; WCR: Warranty Claim Rates; F/S: Failure/Suspension
References
- Wu Y, Wu A (2000) Taguchi methods for robust design. ASME, New York, USA.
- Andrews J, Moss T (2002) Reliability and risk assessment. Professional Engineering Publishing, London.
- Manna A, Das S, Shaikh A, Bhunia A, Moon I (2023) Carbon emission-controlled investment and warranty policy-based production inventory model via meta-heuristic algorithms. Computers & Industrial Engineering 177: 1-17.
- Alqahtani A, Gupta S, Yamada T (2017) Combination two-dimensional non-renewable warranty policy analysis for remanufactured products. Procedia CIRP 61: 189-194.
- Wang X, He K, He Z, Li L, Xie M (2019) Cost analysis of a piece-wise renewing free replacement warranty policy. Computers & Industrial Engineering 135: 1047-1062.
- Meeker W, Escobar L (2004) Reliability: The other dimension of quality. QTQM 1(1): 1-25.
- Suzuki K (1995) Role of field performance data and its analysis. Recent Advances in Life-Testing and Reliability, pp. 141-151.
- Oh YS, Bai DS (2001) Field data analysis with additional after-warranty failure data. Reliability Engineering and System Safety 72: 1-8.
- Inman RR, Gonsalvez DJA (1998) A cost-benefit model for production vehicle testing. IIE Transactions 30: 1153-1160.
- Wallace RB, Rezaul KM, Prabhakar MDN (2011) Warranty data collection and analysis. Springer London Dordrecht Heidelberg New York.
- Phadke MS (1989) Quality engineering using robust design. Prentice Hall, New Jersey, USA.
- Murthy DNP, Djamaludin I (2002) New product warranty: A literature review. International Journal of Production Economics 79(3): 231-260.
- Bharatendra KR, Singh N (2009) Reliability analysis and prediction with Warranty data. Taylor & Francis Group, LLC.
© 2024 Madan Jagtap. This is an open access article distributed under the terms of the Creative Commons Attribution License , which permits unrestricted use, distribution, and build upon your work non-commercially.
 a Creative Commons Attribution 4.0 International License. Based on a work at www.crimsonpublishers.com.
Best viewed in


.jpg)


 Editorial Board Registrations
 Submit your Article
 Refer a Friend
 Advertise With Us
.jpg)


.jpg)


.bmp)
.jpg)
.png)
.jpg)


.jpg)


.png)

.png)


.png)


