
- About Us
- Information
-

The Author ensures that the research has been conducted responsibly and ethically with adherence to all relevant regulations. read more..
- For Authors
- For Reviewer
- Manuscript Guidelines
- Membership
- Publication Ethics
-
- Journals
- Reprints
- e-Books
- Videos
- Policies
- Contact Us
 COVID-19
- Submissions


Full Text
Research & Development in Material Science
Analysis of Thermophysical Properties of Some Nanomaterials Using the Improved Jiang Model
Singh MP1*, Sunil K2 and Sharma BS1
1Department of Physics, Institute of Basic Sciences, Dr. Bhimrao Aamedkar University, India
2Department of Applied Science (Physics), IET, Dr. Bhimrao Aamedkar University, India
*Corresponding author: Singh MP, Department of Physics, Institute of Basic Sciences, Dr. Bhimrao Aamedkar University, Khandari Campus, India
Submission: May 27 2023;Published: June 21, 2023

ISSN: 2576-8840 Volume 19 Issue 1
Abstract
We have studied melting temperature, Debye temperature, thermal expansivity and specific heat for some nanomaterials viz. Al, Fe, Co, Cu, Se, Ag, In, Sn, Au and Pb by using the Jiang model and other models reported in recent literature. We have also modified these models by taking into account the dependences of thermophysical properties on the size and shape as well as the change in lattice volume of nanomaterials. The modified formulations have been used to obtain the results for various properties of nanomaterials. The results have been compared with the available experimental data. It is found that the predicted results present good agreement with the experimental studies as well as with theoretical results reported recently. The melting temperature and other thermophysical properties for the nanomaterials under study are improved significantly by taking into account the variation of lattice volume.
Keywords:Melting temperature; Debye temperature; Thermal expanisivity; Specific heat; Nanomaterials; Shape and size dependence
Introduction
It is well known that melting temperatures of nanocrystals with free surfaces or deposited on inert substrates, including metallic [1-3], organic [4,5], inert gas [6] and semiconductors [7,8], decrease as their sizes decrease. Attempts have been made to develop a model for the melting temperature of nanocrystals [2,3,5,6] based on the size dependent amplitude of the atomic thermal vibrations in terms of the Lindemann criterion. The model thus formulated for the size-dependent melting is based on the Mott expression for the vibrational entropy for metallic crystals at melting temperature [9]. Nanocrystals are intrinsically characterised by a large ratio of the number of surface atoms to volume atoms which modifies some of the basic material properties such as the thermodynamic and thermophysical properties. Earlier models [10-14] of melting assume spherical shape of nanomaterials and yield a linear relationship between the melting temperature and the reciprocal of the particle size.
Because of the importance of melting thermodynamic parameters of nanomaterials on their physical and chemical properties, the latent heat of nanomaterials in terms of Hm(D) function has been studied experimentally and theoretically [4,5,15-19]. It is found that Hm(D) function has a size-dependent value which drops as D decreases. Kim et al. [20] pointed out that it is necessary to investigate the size-dependent cohesive energy of nanomaterials Ec(D), which should be more directly related to the nature of the thermal stability of nanomaterials in terms of solid-vapour transition than Hm(D) function. Jiang et al. [21] have given a quantitative model for the size dependence of latent heat which has been extended to determine Ec(D) function related to the solid-vapour transition. Qi [22] introduced a shape factor to account for the particle shape difference and developed a model for the size and shape dependent cohesive energy of nanoparticles. According to the relation between melting temperature and cohesive energy, the expression for the size and shape dependent melting temperature of nanoparticles has been formulated.
Following the work of Jiang et al. [21] on the size-dependent cohesive energy of spherical nanoparticles and the shape effect on the ratio of surface atoms to the total atoms, Lu et al. [23] have developed a unified model to describe size, dimensionality and shape dependent melting temperature of nanocrystals. Goyal et al. [24] concluded that the Jiang model [21] is the best suited model for calculation of melting temperature and other thermophysical properties as compared to the Lu model [23]. They have also used various models for calculating thermophysical properties of some nanomaterials without taking into account the change in lattice volume [25,26]. Effect of nanoscale size on lattice volume in solid materials has been studied by Chattopadhyay et al. [27], Omar [28] and Abdullah et al. [29].
We present a model based on the ratio number of surface atoms to that of its interior, to calculate the size dependence of lattice volume of nanomaterials. The expression for melting point is modified by considering the effect of lattice volume in the Lindemann law [30]. Both values of lattice volume and melting point obtained for nanomaterials are used to calculate lattice thermal expansion by using a formula applicable for tetrahedral semiconductors [28]. Abdullah et al. [29] have estimated the effect of size on bulk modulus and related parameters, including melting temperature and mass density. Kumar et al. [31] extended the work for the size-dependence of cohesive energy and Debye temperature.
In the present study we consider the nanomaterials of ten metals viz. Al, Fe, Co, Cu, Se, Ag, In, Sn, Au, Pb. We determine melting temperatures, Debye temperatures, thermal expansivity, specific heat using the modified formulations derived from the Jiang model [21], Lu model [23] and Bhatt-Kumar model [31]. The results based on different models are compared with each other and also with the experimental data available for various nanomaterials under study. The formulations are modified by taking into account the variations of lattice volumes for nanomaterials.
Method of Computation
According to Jiang model [19,21], the size dependent melting temperature of nanomaterials can be written as follows:
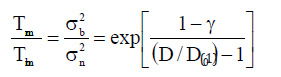
where Tmn is the melting temperature for nanomaterial and Tmb is melting temperature for the corresponding bulk material.σn2 is the average Mean Square Displacement (MSD) of atoms, and σb2 is their corresponding bulk value, γ is the ratio between MSD of atoms at the surface and that within the material. D0 is defined as the critical size at which all the atoms are present on the surface of nanomaterials [32] and it is given below
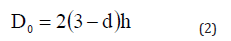
where d denotes the degree of freedom and h represents atomic diameter. For spherical nanomaterials we have d=0, for nanowire d=1, for thin films d=2 [18,21]. The vibrational entropy at melting temperature of bulk materials can be used to determine γ for nanomaterials with free surface [5]
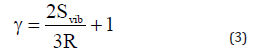
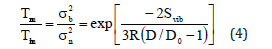
Here R is the universal gas constant, Svib is the vibrational entropy at melting temperature of bulk materials. Equation (1) reduces to the following expression
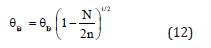
According to Jiang model, shape and size dependences of Debye temperature Dθ , thermal expansivity α and specific heat Cp for nanomaterials are given as follows [24]
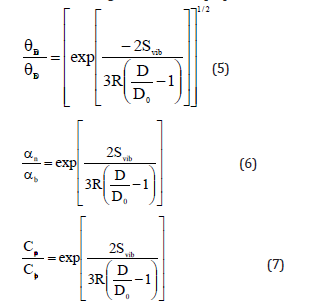
Equation (5) is obtained from the Lindemann law according to which Tm is proportional to θ2D . Equation (6) is based on the inverse proportionality of Tm with thermal expansivity α [24]. Equation (7) takes Cp to be proportional to α [24].
Bhatt [31] developed a model for melting temperature, cohesive energy and Debye temperature by using the formulation due to Qi [33] given below
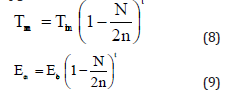
where t is a dimensionless parameter which may have different values for different models. If t→0 the size effect is very low. Further if t=0 the material can be treated as bulk material with no size effect, as summarized by Bhatt and Kumar. It should be mentioned here that for t=1, Eq. (8) reduces to the relation of size dependence of melting temperature as proposed by Qi [33]. Using Lindemann criterion of melting [30]
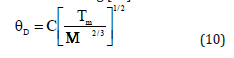
where M is the molecular mass and V is the volume for atom. Using equation (10), Liang [34] reported the following relation
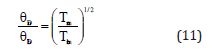
Combining Eqs. (8) and (11) we get the following relationship
According to Bhatt-Kumar model [35,36] the shape and size dependent thermal expansivity and specific heat for nanomaterials are given by the expressions
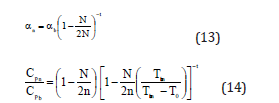
where T0 is the reference temperature. It should be emphasized that Eq. (11) follows from Eq. (10) only when the volume is considered to remain the same for bulk and nanomaterial, i.e. Vb=Vn. However, this is not valid as discussed by Omar and coworkers [28,29]. In the present study we have used the following modified expression obtained by taking Vb not equal to Vn. Eq. (11) is modified as follows
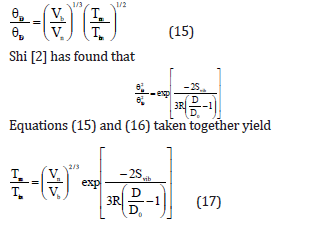
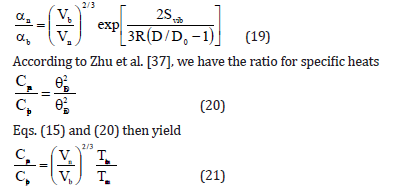
It is known [37] that for bulk material αb is proportional to 1/Ecb , and Ecb to Tmb . We can thus write
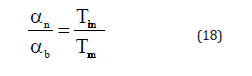
where αn is the volume thermal expansion coefficient or thermal expansivity for nanomaterial and b α is that for the bulk material. Now from Eqs. (17) and (18) we get
Results and Discussion
Values of input data [38-42] used in computational work for the nanomaterials under study are given in Table 1. Values of shape and size dependent parameters are given in Table 2. We have obtained the results for melting temperature, Debye temperature, thermal expansivity, specific heat by taking into account the size and shape dependences for nanomaterials viz. Al, Fe, Co, Cu, Se, Ag, In, Sn, Au, Pb. The melting temperatures are computed using Eqs. (4), (8) and (17). The results for some selected nanomaterials are given in Figures 1-7.
Table 1:Values of input data used in calculation for ten nanomaterials.

Table 2:Size and shape dependent of parameters [18, 21] used in computations. Values of atomic diameter are given in Table 1.

Figure 1:Size dependence of melting temperature Tmn (K) for Al nanomaterial spherical shape. Values calculated from the Jiang model, Eq. (4), are represented by open circles ( ), Bhatt-Kumar model, Eq. (8), by broken curve ( ), improved model Eq. (17) by continuous curve ( ). Experimental data [43] are represented by dark circles ( ).

Figure 2:Size dependence of melting temperature Tmn (K) for Ag nanomaterial spherical shape. Values calculated from the Jiang model, Eq. (4), are represented by open circles ( ), Bhatt-Kumar model, Eq. (8), by broken curve ( ), improved model Eq. (17) by continuous curve ( ). Experimental data [38] are represented by dark circles ( ).

Figure 3:Size dependence of melting temperature Tmn (K) for in nanomaterial spherical shape. Values calculated from the Jiang model, Eq. (4), are represented by open circles ( ), Bhatt-Kumar model, Eq. (8), by broken curve ( ), improved model Eq. (17) by continuous curve ( ). Experimental data [44] are represented by dark circles ( ).

Figure 4:Size dependence of melting temperature Tmn (K) for Sn nanomaterial spherical shape. Values calculated from the Jiang model, Eq. (4), are represented by open circles ( ), Bhatt-Kumar model, Eq. (8), by broken curve ( ), improved model Eq. (17) by continuous curve ( ). Experimental data [16] are represented by dark circles ( ).

Figure 5:Size dependence of melting temperature Tmn (K) for Pb nanomaterial spherical shape. Values calculated from the Jiang model, Eq. (4), are represented by open circles ( ), Bhatt-Kumar model, Eq. (8), by broken curve ( ), improved model Eq. (17) by continuous curve ( ). Experimental data [45] are represented by dark circles ( ).

Figure 6:Size dependence of melting temperature Tmn (K) for in nanomaterial nanowire shape. Values calculated from the Jiang model, Eq. (4), are represented by open circles ( ), Bhatt-Kumar model, Eq. (8), by broken curve ( ), improved model Eq. (17) by continuous curve ( ). Experimental data [46] are represented by dark circles ( ).

Figure 7:Size dependence of melting temperature Tmn (K) for in nanomaterial thin film shape. Values calculated from the Jiang model, Eq. (4), are represented by open circles ( ), Bhatt-Kumar model, Eq. (8), by broken curve ( ), improved model Eq. (17) by continuous curve ( ). Experimental data [47] are represented by dark circles ( ).

The three models have been used to study the size and shape dependences of thermophysical properties of nanomaterials. The results obtained for size dependence of melting temperature Tmn of Al and Ag nanomaterials are in given Figures 1 & 2 respectively. It is found that Bhatt-Kumar model (Eq. 8) and the improved model used in the present study (Eq. 17) give approximately similar results, which are in good agreement with the available experimental data [38,43]. However, the Jiang model [21] is found to deviate significantly from the results experimental. For In nanomaterial (spherical shape) all the models give similar variations of melting temperature Tmn with size D as shown in Figure 3. An improved model is nearly about the experimental data [44]. The variation of melting temperature Tmn with size D for Sn spherical nanomaterial shown in Figure 4, the improved model gives better results with the available experimental data [16] as compared to Jiang model [21] and Bhatt-Kumar model [31]. For Pb nanomaterial with spherical shape (Figure 5) the improved model and Bhatt-Kumar model [31] yield good agreement with the available experimental data [45], but the Jiang model [21] is found to deviate.
We have computed the variations of melting temperature Tmn with size D in case of in nanomaterial also with nanowire and thin film shapes. The results Figure 6 show that the improved model is close to the available experimental data [46]. The Jiang model [21] and the improved model give similar variations in Figure 7 while the Bhatt-Kumar model [31] becomes away from the available experimental data [47] as the value of D increases.
The Debye temperatures computed from Eqs. (5), (12) and (15) are reported in Figures 8-10 for Co, Se and Au nanomaterials all with spherical shape. It is found that the Debye temperature increases with increasing size (D). The improved model yields good agreement with the available experimental data for Co [48]. Size dependence of Debye temperature Dn θ for Se nanomaterial with spherical shape as shown in Figure 9 reveals that the experimental data [49] lie in between the Bhatt-Kumar model [31] and the improved model but deviate from the Jiang model [21]. For Au nanomaterial with spherical shape (Figure 10), both the Bhatt- Kumar model and the improved model give similar results in agreement with the available experimental data [49].
Figure 8:Size dependence of Debye temperature θDn (K) for Co nanomaterial spherical shape. Values calculated from the Jiang model, Eq. (5), are represented by open circles ( ), Bhatt-Kumar model, Eq. (12), by broken curve ( ), improved model Eq. (15) by continuous curve ( ). Experimental data [48] are represented by dark circles ( ).

Figure 9:Size dependence of Debye temperature θDn (K) for Se nanomaterial spherical shape. Values calculated from the Jiang model, Eq. (5), are represented by open circles ( ), Bhatt-Kumar model, Eq. (12), by broken curve ( ), improved model Eq. (15) by continuous curve ( ). Experimental data [49] are represented by dark circles ( ).

Figure 10:Size dependence of Debye temperature θDn (K) for Au nanomaterial spherical shape. Values calculated from the Jiang model, Eq. (5), are represented by open circles ( ), Bhatt-Kumar model, Eq. (12), by broken curve ( ), improved model Eq. (15) by continuous curve ( ). Experimental data [49] are represented by dark circles ( ).

Values of volume thermal expansion coefficient or thermal expansivity computed from Eqs. (6), (13) and (19) for Fe, Cu, Se nanomaterials are given in Figures 11-13. The variations of thermal expansivity n α with size (D) show that the thermal expansivity increases with increasing size D. The results obtained from the improved model present good agreement with the experimental data for Fe nanomaterial [50]. For Cu nanomaterial (Figure 12); [51], the improved model gives better results than those determined from the Jiang model [21] and the Bhatt-Kumar model [31]. The variations of thermal expansivity ( ) n α with size (D) for Se nanomaterial are shown in Figure 13. All the three models give similar results in reasonably good agreement with the available experimental data for [52].
Figure 11:Size dependence of thermal expansivity αn(10-5K-1) for Fe nanomaterial spherical shape. Values calculated from the Jiang model, Eq. (6), are represented by open circles ( ), Bhatt-Kumar model, Eq. (13), by broken curve ( ), improved model Eq. (19) by continuous curve ( ). Experimental data [50] are represented by dark circles ( ).

Figure 12:Size dependence of thermal expansivity αn(10-5K-1) for Cu nanomaterial spherical shape. Values calculated from the Jiang model, Eq. (6), are represented by open circles ( ), Bhatt-Kumar model, Eq. (13), by broken curve ( ), improved model Eq. (19) by continuous curve ( ). Experimental data [51] are represented by dark circles ( ).

Figure 13:Size dependence of thermal expansivity αn(10-5K-1) for Se nanomaterial spherical shape. Values calculated from the Jiang model, Eq. (6), are represented by open circles ( ), Bhatt-Kumar model, Eq. (13), by broken curve ( ), improved model Eq. (19) by continuous curve ( ). Experimental data [52] are represented by dark circles ( ).

Equations (7), (14) and (21) have been used to obtain specific heat for Ag nanomaterial. The results are given in Figure 14. The improved model is closer to the experimental data [53] as compared to other models.
Figure 14:Size dependence of specific heat Cpn (J mol-1K-1) for Ag nanomaterial spherical shape. Values calculated from the Jiang model, Eq. (7), are represented by open circles ( ), Bhatt-Kumar model, Eq. (14), by broken curve ( ), improved model Eq. (21) by continuous curve ( ). Experimental data [53] are represented by dark circles ( ).

Following the method used by Goyal et al. [24] we have determined the size and shape dependences of various properties for Au, Se and Ag nanomaterials. The results are given Figures 15- 18. We have computed the variations of melting temperature Tmn for Ag nanomaterial, Debye temperature θDn for Au nanomaterial, thermal expansivity n α for Se nanomaterial and specific heat Cpn for Au nanomaterial with size D considering different shapes viz. spherical, nanowire and thinfilm. The results given in Figures 15- 18 are determined from
Figure 15:Shape and size dependences of melting temperature Tmn computed using equation (17) for Ag nanomaterials shown by (spherical shape), (nanowire), (thin film). Experimental data [38] are represented by dark circles ( ).

Figure 16:Shape and size dependences of Debye temperature θDn (K) computed using equation (15) for Au nanomaterials shown by (spherical shape), (nanowire), (thin film). Experimental data [49] are represented by dark circles ( ).

Figure 17:Shape and size dependences of Thermal expansivity αn (10-5K-1) computed using equation (19) for Se nanomaterials shown by (spherical shape), (nanowire), (thin film). Experimental data [18] are represented by dark circles ( ).

Figure 18:Shape and size dependences of specific heat Cpn/Cpb computed using equation (21) for Au nanomaterials shown by (spherical shape), (nanowire), (thin film). Experimental data [54] are represented by dark circles ( ).

Conclusion
The results for melting temperature, Debye temperature, thermal expansivity, specific heat obtained for different nanomaterials using the improved model formulated are found to present close agreement with the available experimental data. The improved model formulated in the present study by taking into account the variation of lattice volume with the change in size parameter D has been found to yield better agreement, in general, for the nanomaterials under study. The factor (Vn/Vb)2/3 in Eq. (17) has a strong influence on the melting temperature and other thermophysical properties of nanomaterials. In the previous work [21,24-26] on nanomaterials, the lattice volume was assumed to remain constant (Vn=Vb) which is not appropriate.
References
- Takagi MJ (1954) Electron-diffraction study of liquid-solid transition of thin metal films. Phys Soc Japan 9: 359-363.
- Shi FG (1994) Size dependent thermal vibrations and melting in nanocrystals. J Mater Res 9: 1307-1313.
- Zhang Z, Li JC, Jiang Q (2000) Modelling for size-dependent and dimension-dependent melting of nanocrystals. J Phys D: Appl Phys 33: 2653.
- Jackson CL, Mckenna GB (1990) The melting behavior of organic materials confined in porous solids. J Chem Phys 93: 9002-9011.
- Jiang Q, Shi HX, Zhao M (1999) Melting thermodynamics of organic nanocrystals. J Chem Phys 111: 2176-2180.
- Wen Z, Zhao M, Jiang Q (2000) The melting temperature of molecular nanocrystals at the lower bound of the mesoscopic size range. J Phys Condens Matter 12: 8819-8824.
- Goldstein AN, Ether CM, Alivisatos AP (1992) Melting in semiconductor nanocrystals. Science 256: 1425-1427.
- Goldstein AN (1996) The melting of silicon nanocrystals: Submicron thin-film structures derived from nanocrystal precursors. Appl Phys A 62: 33-37.
- Mott NF (1934) The resistance of liquid metals. Proceedings of the Royal Society of London. Series A, Containing Papers of a Mathematical and Physical Character 146: 465-472.
- Wautelet M (1991) Estimation of the variation of the melting temperature with the size of small particles, on the basis of a surface-phonon instability mode. J Phys D: Appl Phys 24: 343.
- Nanda KK, Sahu SN, Behera SN (2002) Liquid-drop model for the size-dependent melting of low-dimensional systems. Phys Rev A 66: 013208 (1-8).
- Guisbers G, Wautelet M (2006) Size, shape and stress effects on the melting temperature of nano-polyhedral grains on a substrate. Nanotechnology 17: 2008-2011.
- Safaei A, Shandiz MA, Sanjabi S, Barber ZH (2008) Modeling the melting temperature of nanoparticles by an analytical approach. J Phys Chem C 112: 99-105.
- Guisbers G (2008) Mechanical and thermal properties of metallic and semiconductive nanostructures. J Phys Chem C 112: 4097-4103.
- Hasegawa M, Hoshino K, Watabe M (1980) A theory of melting in metallic small particles. J Phys F: Metal Phys 10: 619-635.
- Lai SL, Guo JY, Petrova V, Ramanath G, Allen LH (1996) Size-dependent melting properties of small tin particles: nanocalorimetric measurements. Phys Rev Lett 77: 99.
- Jiang Q, Shi HX, Li JC (1999) Finite size effect on glass transition temperatures. Thin Solid Films 354: 283-286.
- Jiang Q, Zhang Z, Li JC (2000) Melting thermodynamics of nanocrystals embedded in a matrix. Acta Mater 48: 4791-4795.
- Zhao M, Zhou XH, Jiang Q (2001) Comparison of different models for melting point change of metallic nanocrystals. J Mater Res 16: 3304-3308.
- Kim HK, Huh SH, Park JW, Jeong JW, Lee GH (2002) The cluster size dependence of thermal stabilities of both molybdenum and tungsten nanoclusters. Chem Phys Lett 354: 165-172.
- Jiang Q, Li JC, Chi BQ (2002) Size-dependent cohesive energy of nanocrystals. Chem Phys Lett 366: 551-554.
- Qi WH, Wang MP (2004) Size and shape dependent melting temperature of metallic nanoparticles. Mater Chem Phys 88: 280-284.
- Lu HM (2009) Size shape and dimensionality dependent melting temperatures of nanocrystals. J Phys Chem C 113: 7598-7602.
- Rawat K, Goyal M (2021) Theoretical analysis of thermophysical properties of nanomaterials. Materials today: Proceedings 43: 1210-1214.
- Goyal M, Gupta BRK (2019) Study of shape, size and temperature-dependent elastic properties of nanomaterials. Mod Phys Lett B 33: 1950310.
- Goyal M, Gupta BRK (2018) Shape and size dependent thermophysical properties of nanocrystals. Chinese J Phys 56: 282-291.
- Chattopadhyay PP, Nambissan PMG, Pabi SK, Manna I (2001) Polymorphic bcc to fcc transformation of nanocrystalline niobium studied by positron annihilation. Phys Rev B 63: 054107.
- Omar MS (2012) Models for mean bonding length, melting point and lattice thermal expansion of nanoparticle materials. Mater Res Bull 47: 3518-3522.
- Abdullah BJ, Omar MS, Jiang Q (2018) Size dependence of the bulk modulus of Si nanocrystals. Sadhana 43: 1-5.
- Linndeman FA (1910) Temperature based on the Lindemann's melting equation. Z Phys 11: 609.
- Chhabra H, Bhatt S, Kumar M (2019) Search of a model for melting temperature and cohesive energy of nanomaterials. Indian J Pure Appl Phys 57: 361-368.
- Arora N, Joshi DP (2017) Band gap dependence of semiconducting nano-wires on cross-sectional shape and size. Indian J Phys 91: 1493-1501.
- Qi WH (2005) Size effect on melting temperature of nanosolids. Physica B 368: 46-50.
- Liang LH, Baowen L (2006) Size dependent thermal conductivity of nanoscale semiconducting systems. Phys Rev B 73: 153303.
- Bhatt S, Kumar M (2017) Effect of size and shape on melting and superheating of free standing and embedded nanoparticles. J Phys Chem Solids 106: 112-117.
- Bhatt S, Kumar R, Kumar M (2017) Specific heat and thermal conductivity of nanomaterials. Mod Phys Lett B 31: 1750011.
- Zhu YF, Lian JS, Jiang Q (2009) Modeling of the melting point, Debye temperature, thermal expansion coefficient, and the specific heat of nanostructured materials. J Phys Chem C 113: 16896-16900.
- Kittel C (2013) Introduction to solid-state physics. (8th edn), Wiley, New York, USA.
- Lu HM, Wen Z, Jiang Q (2006) Nucleus–liquid interfacial energy of elements. Colloids Surf A 278: 160-165.
- http://www.efunda.com/materials/elements/Accessed July 2009
- Hayashi M, Tamura I, Fukano Y, Kanemaki S, Fujio Y (1980) J Phys C 13: 681.
- Childress JR (1991) Lattice softening in nanometer size iron particles. Phys Rev B 44: 11689.
- Luo W, Hu W, Xiao S (2008) Size effect on the thermodynamic properties of silver nanoparticles. J Phys Chem C 112: 2359-2369.
- Skripov VP, Koverda VP, Skokov VN (1981) Size effect on melting of small particles. Phys Stat Solidi (a) 66: 109-118.
- Gülseren O, Ercolessi F,Tosatti E (1995) Phys Rev B 51: 7377.
- Krausch G, Detzel T, Bielefeldt H, Fink R, Luckscheiter B, et al. (1991) Growth and melting behaviour of thin in films on Ge (100). Appl Phys A 53: 324-329.
- Zhang M, Efremov MY, Schiettekatte F, Olson EA, Kwan AT, et al. (200) Size-dependent melting point depression of nanostructures: Nanocalorimetric measurements. Phys Rev B 62: 10548.
- Hou M, El Azzaoui M, Pattyn H, Verheyden J, Koops G, et al. (2000) Growth and lattice dynamics of Co nanoparticles embedded in Ag: a combined molecular-dynamics simulation and Mössbauer study. Phys Rev B 62: 5117.
- Yang CC, Xiao MX, Li W, Jiang Q (2006) Size effects on Debye temperature, Einstein temperature, and volume thermal expansion coefficient of nanocrystals. Solid State Commun 139: 148-152.
- Li HX, Ma MH, Huang JF (2005) Structure and properties of nanometer size materials III. Structures and physical properties of iron nanoparticles. Chin J Chem 23: 693-702.
- Qian LH, Wang SC, Zhao YH, Lu K (2002) Micro strain effect on thermal properties of nanocrystalline Cu. Acta Mater 50: 3425-3434.
- Zhao YH, Lu K (1997) Grain-size dependence of thermal properties of nanocrystalline elemental selenium studied by x-ray diffraction. Phys Rev B 56: 14330.
- Singh M, Lara SO, Tlali S (2017) Effects of size and shape on the specific heat, melting entropy and enthalpy of nanomaterials. J Taibah Univ Sci 11: 922-929.
- Gafner YY, Gafner SL, Zamulin IS, Redel LV, Baidyshev VS (2015) Analysis of the heat capacity of nanoclusters of FCC metals on the example of Al, Ni, Cu, Pd, and Au. Phys Metals Metall 116: 568-575.
© 2023 Singh MP. This is an open access article distributed under the terms of the Creative Commons Attribution License , which permits unrestricted use, distribution, and build upon your work non-commercially.
Editor In Chief


.jpg)


Signup for Newsletter

Quick Links
 Editorial Board Registrations
 Submit your Article
 Refer a Friend
 Advertise With Us
Our Recent Edition

.jpg)


Top Editors


.jpg)


.bmp)
.jpg)
.png)
.jpg)


.jpg)


.png)

.png)


.png)


Financial Support

Sponsors

Latest e-Books

Latest Video

 a Creative Commons Attribution 4.0 International License. Based on a work at www.crimsonpublishers.com.
Best viewed in
a Creative Commons Attribution 4.0 International License. Based on a work at www.crimsonpublishers.com.
Best viewed in