- Submissions

Full Text
Research & Development in Material Science
Rheological Properties and Microstructure of Canola-Based Emulsions Stabilized with Polyoxyethylene Sorbitan Surfactants
Gerson Lopes Teixeira* and Rosemary Hoffmann Ribani
Food Engineering Graduate Program, Federal University of Paraná, Brazil
*Corresponding author: Gerson Lopes Teixeira, Food Engineering Graduate Program, Federal University of Paraná, Curitiba, Paraná, 81531-980, Brazil
Submission: May 01, 2018;Published: May 11, 2018

ISSN: 2576-8840
Volume6 Issue1
Abstract
This work evaluated eight different emulsions produced with canola oil and stabilized using two different polyoxyethylene sorbitan surfactants (Tween® 60 or Tween® 85), by evaluating their microstructure and rheological properties. The results showed that the canola-based emulsion behaved as non-Newtonian fluids with pseudoplastic character (n or nH <0.7). Additionally, the Ostwald-de Waele (OW) and Herschel-Bulkley (HB) models adequately described the rheological behavior of the emulsions (R2 >0.98 for OW, and R2 >0.99 for HB; χ2 <0.001 for both), highlighting that the samples containing Tween® 60 (A, C, E and G) achieved higher values for the consistency coefficient (K <18.5) than the Tween® 85-based samples (B, D, F and H) (K <5.3), agreeing with the apparent viscosity data. Emulsions containing Tween® 60 at all concentrations and stirring rate conditions achieved the lowest droplet sizes (90% droplet size distribution (DSD) up to 4.0μm), higher consistency, and a global appearance similar to that of mayonnaise, while formulations made with Tween® 85 produced emulsions with bigger values for DSD, more fluid-like appearance and larger droplet sizes. In general, canola-based emulsions containing Tween® 60 showed better overall performance in the assays.
Keywords: Tween® 60; Tween® 85; Microemulsion; Viscosity; Pseudoplastic fluid
Introduction
One of the most important physical properties of dispersion samples is the particle size, which influences many other characteristics, being a valuable indicator of quality and performance for products such as suspensions, emulsions, and aerosols [1,2]. For these and many other reasons, it is important to measure and control the particle size distribution of those products. In addition, several imaging techniques and software are available to evaluate the structure of particulate systems, such as emulsions [3]. A wide variety of foods are emulsions: mixtures of two inherently immiscible fluids, one of which is the continuous, while the other is the dispersed phase [4]; thus, it is important to understand their physical, rheological and microscopic properties aiming to choose the best surfactants and process conditions to work with this colloidal system [1]. Additionally, the image processing and evaluation becomes important because it provides significant quantitative data of the micro/nanostructure of the dispersions [5], a key element in product development.
Polysorbates containing 20 units of oxyethylene are hydrophilic non-ionic surfactants which are widely employed as emulsifying agents in oil-in-water emulsions aiming to enhance the quality of the products [1,6]. The canola oil is a good raw material to produce food emulsions due to its health-promoting nutritional properties. It is an good source of oleic acid (50-66%), α-linolenic acid (6-14%) and unsaturated fatty acids [7], and has been successfully applied in vitamin E-enriched nanoemulsions [8].
Thus, this work aimed to study eight different model emulsions produced with canola oil as the oily phase in different proportions using two types of polyoxyethylene sorbitan surfactants in order to investigate the influence of surfactants, stirring speed and oil phase ratio in the rheological properties and droplet size distribution (DSD) of the produced emulsions.
Material and Methods
Canola-based emulsions development
A solution of distilled water containing 1% (w/v) NaCl was the aqueous phase, while the oil phase was composed of canola oil (Cocamar, Maringá, Brazil). Tween® 60 (polyoxyethylene (20) sorbitan monostearate) and Tween® 85 (polyoxyethylene (20) sorbitan trioleate) surfactants purchased from Sigma-Aldrich (St. Louis, USA) were used as surfactants.
In order to produce dispersions with different properties, eight emulsions were prepared according to the conditions presented in Table 1 by using a 24-1 fractional factorial experimental design. Emulsions were prepared in a 250mL beaker by dispersing the surfactant in canola oil at room temperature (23±2 °C), followed by slight manual stirring with a spatula for complete homogenization of the surfactant and subsequent addition of the aqueous phase. The ingredients were then mechanically stirred using a Polytron® PT 3100 D homogenizer (Kinematica AG, Littau, Switzerland) for 5min.
Table 1: Preparation conditions for canola-based emulsions using a 24-1 fractional factorial design (original and coded components).

Type and pH of the emulsions
The type of emulsion was identified by means of electrical conductivity [1] with the help of a Gehaka CG 2500 conductivity meter (São Paulo, Brazil). High conductivity values (>0.1mS/ cm) indicate that water is the continuous phase and the oil is the phase dispersed in an oil-in-water (O/W) emulsion, whereas for a water-in-oil emulsion (W/O), the conductivity is low (few μS/ cm). The pH of the formulations was determined as described by Teixeira et al. [2]. Briefly, each emulsion was dispersed in distilled water (10%w/v) at 25 °C, followed by the direct measurement in a Gehaka PG1800 potentiometer (São Paulo, Brazil). The results correspond to the average of three determinations.
Rheological characterization of canola-based emulsions
The rheological analysis was performed in a Brookfield Viscometer (model DV-II+ Pro) coupled to a thermostatic bath at 25 °C, using SC4-18, SC4-25, and SC4-34 spindles. The experimental data obtained from the flow curves of the emulsions was acquired by the Rheocalc software (v3.1-1) and adjusted according to the rheological models of Ostwald-de Waele (Eq. 1) and Herschel- Bulkley (Eq. 2), to obtain the rheological and statistical parameters:

where τ is the shear stress (Pa), τOH, is the yield stress from HB model (Pa), is the shear rate (s-1), K and KH are the consistency coefficients (Pa.sn), n and nH are the flow behavior indexes (dimensionless).
Microstructure and droplet size distribution
The droplet size distribution (DSD) of the samples was evaluated by optical microscopy analysis, using a Zeiss Axio Observer D1 microscope (Zeiss Vision GmbH, Germany) with 640× magnification. The images captured with the Axio Cam were used to obtain the DSD with the aid of the Axio Vision software (v. 4.8.2) using two micrographs captured by each sample analyzing the entire extent of the image in order to measure 100 drops randomly in each one of them, as described by Teixeira et al. [2].
Statistical analysis
Data were evaluated by analysis of variance (ANOVA) with significance defined as p≤0.05. The results were submitted to the Tukey test at 95% confidence level using Statistica 10.0 software (StatSoft™, Inc.). Graphs were obtained using the Origin 8.6 software (Origin lab Corporation).
Results
Emulsion type and pH
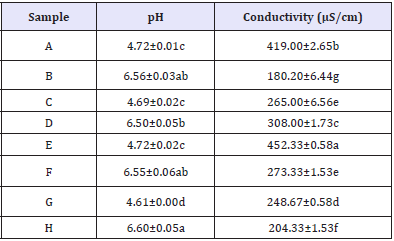
Figure 1 shows the appearance of the eight canola-based emulsion produced. Results for the pH and conductivity analysis are shown in Table 2. Although presenting significant differences (p<0.05), the pH values followed a trend: samples containing Tween® 60 presented values ~4, while those produced with Tween® 85 showed pH values ~6. Through the conductivity tests, the emulsions containing both Tween® 60 and Tween® 85 surfactants presented some statistical difference between their values, but all of them were found to be oil-in-water (O/W), as the conductivity values were higher than 0.1mS/cm (Table 2).
Table 2: pH and conductivity of canola-based emulsions containing 70 or 80% (v/v) oil phase and 3 or 5% (w/v) Tween® 60 or Tween® 85.

A,C,E, and G=samples containing Tween® 60; B,D,F, and H=samples containing Tween® 85. Lowercase letters indicate statistical difference according to Tukey’s test (p<0.05).
Figure 1: Appearance of canola-based emulsions prepared with 3 or 5% (w/v) surfactants Tween® 60 (A, C, E, and G) or Tween® 85 (B, D, F, and H).

Rheological behavior
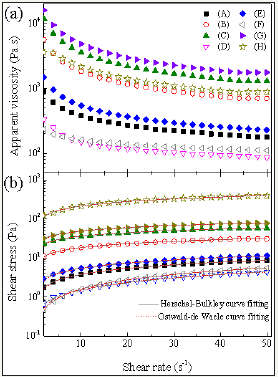
The viscosity and flow curves for the canola-based emulsions are shown in Figure 2. The apparent viscosity of emulsions (Figure 2a) was influenced by the surfactant type and concentration, oil phase and the stirring speed. In addition, for all the formulations, a viscosity decrease with the shear rate can be observed, which is a common behavior for this type of product [2,9]. Sample C (5% Tween® 60) had the highest apparent viscosity values, followed by sample F (3% Tween® 85). As shown in the rheograms (Figure 2b), none of the emulsions exhibited a linear relationship between shear stress and shear rate, that characterizes the behavior of a non-Newtonian fluid.
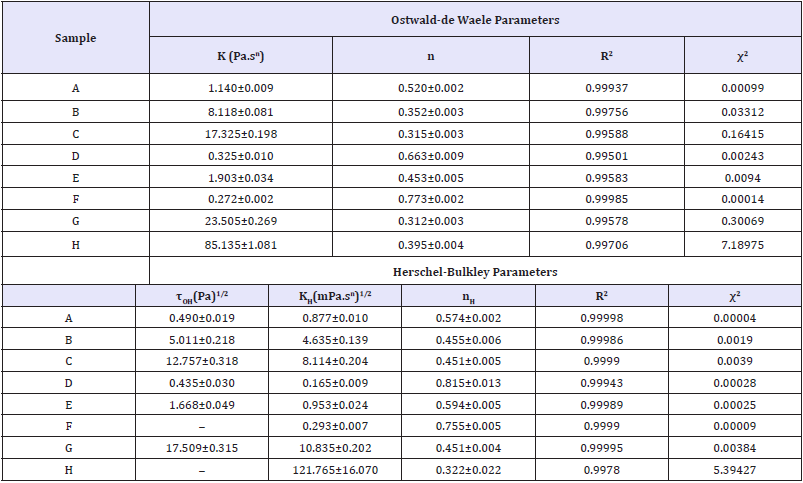
The coefficient of determination (R2) for the rheological models was higher than 0.99, and the chi-square (χ2) values ranged between 0.0004 and 7.1897, therefore, such results showed a good fit of the data to the Ostwald-de Waele (OW) and Herschel- Bulkley (HB) models. According to the OW model, the emulsions with the highest values of K (consistency coefficient) were the samples H(85.1), G(23.5), C(17.3) and B(8.1), as shown in Table 3. It is also observed that there is an interrelation of these values with the apparent viscosity since these samples also presented higher values for this parameter than the other samples (Figure 2a). Furthermore, the analyzed emulsions showed pseudoplastic character (shear-thinning) as the values for the flow behavior index (nH) were lower than 1.0. Despite having high R2 and low χ2 values, samples F and H presented negative yield stress τOH values, which have no physical meaning in the Herschel-Bulkley model. Thus, the Power-Law model is more suitable to evaluate the behavior of those dispersions.
Figure 2:
2a: Viscosity curves adjusted by the Ostwald-de Waele (dashed line) Herschel-Bulkley (solid line) models recorded at 25 °C in canola-based emulsions containing 3% (w/v) Tween® 60 (A,C,E and G).
2b: Flow curves adjusted by the Ostwald-de Waele (dashed line) Herschel-Bulkley (solid line) models recorded at 25 °C in canola-based emulsions containing 5% (w/v) Tween® 85 (B,D,F and H).

Table 3: Ostwald-de Waele and Herschel-Bulkley rheological parameters adjusted for canola-based emulsions prepared with Tween® 60 (A,C,E, and G) or Tween® 85 (B,D,F, and H) and analyzed at 25 °C.

K, KH=Consistency coefficients; n,nH=Flow behavior indices (dimensionless); τ0H=Herschel-Bulkley yield stress; R2=Coefficient of determination; χ2=chi-square.
Microstructure and droplet size distribution
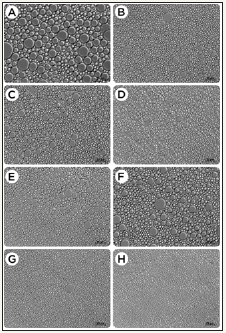
Figure 3 shows the micrographs of each canola-based emulsion evaluated, while Table 4 presents the droplet size distribution (DSD). The studied variables directly impacted the internal microstructure of the evaluated emulsions. Significant differences (p<0.05) between the average droplet size were detected by the Tukey test. Emulsion samples with a higher proportion of surfactant (C,D,G,H) yielded smaller droplets than the other emulsions. As shown in Table 4, the sample C, containing 5% (w/v) Tween® 60, produced under stirring of 8000rpm and 80% oil phase showed the lowest droplet sizes, exhibiting more than 99% of the DSD in sizes <4.0μm, in addition to a greater consistency, and overall appearance similar to that of mayonnaise. Moreover, formulations containing Tween® 85 (B,D,F, and H) also produced emulsions with small droplet sizes (up to 8μm), but with a larger variation in DSD between sizes higher than 4.1μm. It is further noted from Table 4 that emulsion A provided a DSD with almost 50% values greater than 8.1μm, which is reinforced by Figure 3 that shows the higher droplets among all samples. It can be suggested that a 2% increase in the surfactant plus 10% increase in oil phase substantially affects the microstructure of the emulsion, as shown by the sample C.
Figure 3:
Micrographs of canola-based emulsions stabilized with Tween® 60 (A,C,E, and G) or Tween® 85 (B,D,F and H) and recorded at 640×magnification. Scale bars represent 20μm.

Table 4: Droplet size distribution (%) and average droplet size (μm) for canola-based emulsions stabilized with Tween® 60 (A,C,E, and G) or Tween® 85 (B,D,F, and H).

Lowercase letters indicate statistical difference according to Tukey’s test (p<0.05).
Discussion
Monitoring pH values from the emulsions provide information on the chemical stability of the formulation. Decreases in these values may be related to the oxidation of the oil phase with the formation of oxidized chains or the hydrolysis of triglycerides, manifested by formation of free fatty acids [10]. Since the pH of the formulations showed slight variations, it can be inferred that an interaction between the components of the emulsions was not enough to harm their characteristics.
It was verified that the rheological behavior of canola-based emulsions is strongly affected by the droplet size. Faster stirring can yield smaller and more uniform droplets, resulting in more viscous and stable emulsions [1]. Important to note that, due to the complex rheological behavior of many food products, any modification in the product composition may alter its texture perception and compromise food palatability [4]. As an example, emulsions produced with cupuassu fat and Tween® 85 as stabilizer are also reported to show higher droplet sizes with lower stability than those produced with Tween® 60 or Tween® 80 [2]. Enhanced effects produced by the polysorbates (Tween series) may be attributed to its high solubilization capacity, which is assumed to form large interfacial surfactant film between inner and outer phases in the emulsion [11].
Conclusion
The experimental data of this study showed that the concentration of the surfactant (Tween® 60 or Tween® 85) and the oil phase, as well as the stirring speed, are factors that influence positively on the rheological and microscopic properties of canolabased emulsions. Samples containing Tween® 60 showed the best overall results in the tests, although those containing Tween® 85 also provided satisfactory performance. In addition, the rheological behavior of the emulsions was effectively adjusted by the Ostwaldde Waele and Herschel-Bulkley models, showing that canola-based emulsions have non-Newtonian behavior with pseudoplastic character. Among all analyzed emulsions, sample C had the smallest droplet sizes. These results showed that canola is suitable to produce emulsions using polyoxyethylene sorbitan surfactants as stabilizers and that the production conditions can significantly affect their microscopic properties and rheological behavior.
Acknowledgment
This work was supported by the Coordination for the Improvement of Higher Education Personnel-CAPES (Brazil), grant n. 1291783 (CAPES-DS).
References
- Züge LCB, Haminiuk CWI, Maciel GM, Silveira JLM, Scheer ADP (2013) Catastrophic inversion and rheological behavior in soy lecithin and Tween 80 based food emulsions. J Food Eng 116(1): 72-77.
- Teixeira GL, Züge LCB, Silveira JLM, Scheer ADP, Ribani RH (2016) The impact of polyoxyethylene sorbitan surfactants in the microstructure and rheological behaviour of emulsions made with melted fat from cupuassu (Theobroma grandiflorum). J Surfactants Deterg 19(4): 725- 738.
- Jurado E, Bravo V, Camacho F, Vicaria JM, Arteaga AF (2007) Estimation of the distribution of droplet size, interfacial area and volume in emulsions. Colloids Surfaces A Physicochem Eng Asp 295: 91-98.
- Pawlik AK, Norton IT (2014) Bridging benchtop research and industrial processed foods: Structuring of model food emulsions. Food Struct 1(1): 24-38.
- Hukkanen EJ, Braatz RD (2003) Measurement of particle size distribution in suspension polymerization using in situ laser backscattering. Sensors Actuators, B Chem 96: 451-459.
- Pourreza N, Rastegarzadeh S (2004) Kinetic spectrophotometric determination of Tween 80. Talanta 62(1): 87-90.
- Ghazani SM, Llatas GG, Marangoni AG (2014) Micronutrient content of cold-pressed, hot-pressed, solvent extracted and RBD canola oil: Implications for nutrition and quality. Eur J Lipid Sci Technol 116(4): 380-387.
- Mehmood T (2015) Optimization of the canola oil based vitamin E nanoemulsions stabilized by food grade mixed surfactants using response surface methodology. Food Chem 183: 1-7.
- Teixeira GL, Ávila S, Silveira JLM, Ribani M, Ribani RH (2018) Chemical, thermal and rheological properties and stability of sapucaia (Lecythis pisonis) nut oils: A potential source of vegetable oil in industry. J Therm Anal Calorim 131(3): 2105-2121.
- Masmoudi H, Dréau Y Le, Piccerelle P, Kister J (2005) The evaluation of cosmetic and pharmaceutical emulsions aging process using classical techniques and a new method: FTIR. Int J Pharm 289(1-2): 117-131.
- Yutani R, Teraoka R, Kitagawa S (2015) Microemulsion using polyoxyethylene sorbitan trioleate and its usage for skin delivery of resveratrol to protect skin against UV-induced damage. Chem Pharm Bull 63(9): 741-745.
© 2018 Gerson Lopes Teixeira. This is an open access article distributed under the terms of the Creative Commons Attribution License , which permits unrestricted use, distribution, and build upon your work non-commercially.
 a Creative Commons Attribution 4.0 International License. Based on a work at www.crimsonpublishers.com.
Best viewed in


.jpg)


 Editorial Board Registrations
 Submit your Article
 Refer a Friend
 Advertise With Us
.jpg)


.jpg)


.bmp)
.jpg)
.png)
.jpg)


.jpg)


.png)

.png)


.png)


