
- About Us
- Information
-

The Author ensures that the research has been conducted responsibly and ethically with adherence to all relevant regulations. read more..
- For Authors
- For Reviewer
- Manuscript Guidelines
- Membership
- Publication Ethics
-
- Journals
- Reprints
- e-Books
- Videos
- Policies
- Contact Us
 COVID-19
- Submissions


Full Text
Research & Development in Material Science
Portland Cement Mortar Carbonation Assessment by Using Blue Timol Indicator
Esteban Estévez1, Migue Angel Sanjuán2* and Cristina Argiz3
1Department of Cement Chemical Testing, Polytechnic University of Madrid, Spain
2Department of Cement and Mortar, Spanish Institute of Cement and its Applications, Spain
3Senior Lecturer of Chemistry of Building Materials, Polytechnic University of Madrid, Spain
*Corresponding author: Miguel Angel Sanjuán, Department of Cement and Mortar, Spanish Institute of Cement and its Applications (IECA), C/ José Abascal 53, Madrid-28003, Spain
Submission: March 24, 2018;Published: March 28, 2018

ISSN: 2576-8840
Volume5 Issue1
Abstract
This work investigated the performance of Portland cement mortars with regard to the carbonation resistance. Mortars were made with a Portland cement with 62,2% ground granulated blast-furnace slag and cured under water for one, two, three, seven, 14 and 20 days. Normally, testing for natural carbonation is made by using a phenolftalein indicator solution; however, in this study a blue timol indicator was chosen. Carbonation rate after one year of natural exposure increases with decreasing curing time under water. Also, it increases when ground granulated blast-furnace slag content in mortars increase.
Keywords: Carbonation; Ground granulated blast-furnace slag; Portland cement; Blue timol indicator
Introduction
It is well documented in literature the carbonation reaction of calcium hydroxide contained in the Portland cement mortars [1-4]. This reaction proceeds in two steps. During the first step, carbon dioxide is absorbed onto the alkaline pore water on the sample surface. The result is the precipitation of calcite crystals where the controlling factor is the dissolution of carbon dioxide and calcium hydroxide in the pore solution. The second step of carbonation is controlled by the carbon dioxide diffusion through the mortar pore network. Given that, the rate of carbonation is defined by the rate of carbon dioxide uptake by calcium hydroxide among other Portland cement constituents.
Carbonation in Portland cements prevents further carbonation from occurring because the CaCO3 formation causes pore blocking. Nevertheless, blended cement carbonation leads to higher porosities [5,6]. Particularly, ground granulated blast-furnace slag is one of the most frequently used additions in Europe, which are recommended in aggressive environments [7]. However, concretes and mortars made with ground granulated blast-furnace slag have a weak carbonation resistance [8]. Therefore, the knowledge of the carbonation resistance of mortars made with blast-furnace slag will help to design mortars and reinforced concrete structures with an adequate service life.
Experimental
Materials and mortar preparation
One commercial common Portland cement CEM III/B 32.5NLH/ SR according to the European standard EN 197-1:2011 [9] was used in this study. This cement contains 62.2% ground granulated blast-furnace slag. Chemical analyses of SiO2, Al2O3, Fe2O3, CaO, MgO, SO3 and free lime were performed according to the European standard EN 196-2:2014 [10]. Chemical properties are given in Table 1. The testing mortars were prepared according to the European standard EN 196-1:2016 [11]. They were cured under water for zero, one, three, seven, 14 or 28 days. Thereafter, mortars were tested for natural carbonation using a blue timol indicator solution.
Table 1: Chemical compositions of cements determined according to EN 196-2:2014 [10] (%).

*Insoluble residue determined by the Na2CO3 method (European standard EN 196-2:2005).
Natural carbonation testing
Natural carbonation testing was performed exposing the mortars to the natural exterior environment under shelter from rain conditions (CO2 concentration of 0.035±0.005%, a temperature of 20±2 °C and a relative humidity of 65±5%). Measurement was taken at 12 months of natural exposure after the curing period under water of zero, one, three, seven, 14 or 28 days. The depth of carbonation was measured on the freshly sawn surface with the blue timol indicator solution.
Results and Discussion
Figure 1: Example of the carbonation front measured by using the blue timol indicator solution. The easiest and most widely carbonation model used in mortars and concretes is shown in Eq. (1).

Figure 2: Natural carbonation results at 12 months measured by using the blue timol indicator solution.

The depth of carbonation was measured with the blue timol indicator solution and Figure 1 shows an example of the carbonation front measured by using this pH indicator. Natural carbonation results at 12 months of the commercial common Portland cement CEM III/B 32.5 N-LH/SR, according to the European standard EN 197-1:2011 [9,12], are shown in Figure 2. As expected, the influence of the curing period in clear. It is evident that a curing period of seven days is enough to ensure an acceptable carbonation resistance. Consequently, the results obtained after seven, 14 or 28 days of curing under water are quite similar (carbonation depth between 7-8mm).
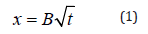
where : B = carbonation coefficient (mm/year0.5)
x = carbonation depth (mm)
t = natural carbonation exposure time (year)
The natural carbonation exposure time is one year, therefore, the carbonation coefficient (mm/year0.5) and carbonation depth (mm) present the same figure but different units.
Conclusion
Based on the experimental results, the following conclusions can be drawn:
1. Portland cement mortar carbonation is influenced by the time of curing.
2. A higher time of curing have to be defined in mortars with higher ground granulated blast-furnace slag content.
3. Seven days curing time is stated as the minimum time for mortars made with cement containing with more than 62% of ground granulated blast-furnace slag.
References
- CPCB (2015) Annual Report 2014-2015.
- Thanh NP, Matsui Y, Fujiwara T (2011) Assessment of plastic waste generation and its potential recycling of household solid waste in Can Tho City, Vietnam. Environmental Monitoring and Assessment 175(1-4): 23-35.
- General Authority of Statistics (2016) Demographic Survey.
- Khan MSM, Kaneesamkandi Z (2013) Biodegradable waste to biogas: renewable energy option for the Kingdom of Saudi Arabia. Int J Innov Appl Stud 4(1): 101-113.
- Dormer A, Finn DP, Ward P, Cullen J (2013) Carbon footprint analysis in plastics manufacturing. Journal of cleaner production 51: 133-141.
© 2018 Miguel Angel Sanjuán. This is an open access article distributed under the terms of the Creative Commons Attribution License , which permits unrestricted use, distribution, and build upon your work non-commercially.
Editor In Chief


.jpg)


Signup for Newsletter

Quick Links
 Editorial Board Registrations
 Submit your Article
 Refer a Friend
 Advertise With Us
Our Recent Edition

.jpg)


Top Editors


.jpg)


.bmp)
.jpg)
.png)
.jpg)


.jpg)


.png)

.png)


.png)


Financial Support

Sponsors

Latest e-Books

Latest Video

 a Creative Commons Attribution 4.0 International License. Based on a work at www.crimsonpublishers.com.
Best viewed in
a Creative Commons Attribution 4.0 International License. Based on a work at www.crimsonpublishers.com.
Best viewed in