
- About Us
- Information
-

The Author ensures that the research has been conducted responsibly and ethically with adherence to all relevant regulations. read more..
- For Authors
- For Reviewer
- Manuscript Guidelines
- Membership
- Publication Ethics
-
- Journals
- Reprints
- e-Books
- Videos
- Policies
- Contact Us
 COVID-19
- Submissions


Full Text
Research & Development in Material Science
Influence of Temperature and Time of Acid Etching on the Surface Morphology of Titanium for Dental Implants
Ariel Assayag, Beatriz Torres, Daniel J Fernandes* and Carlos N Elias
Biomaterials Laboratory, Instituto Militar de Engenharia, Brazil
*Corresponding author: Daniel J Fernandes, Biomaterials Laboratory, Instituto Militar de Engenharia, Rio de Janeiro, Brazil
Submission: December 12, 2017; Published: March 23, 2018

Volume 4 Issue 5 March 2018
Abstract
The surface morphology of dental implants affects the primary stability (mechanical stability), the secondary stability (osseointegration), and the tertiary stability (long-term stability). In this work, the effects of surface etching on commercially pure titanium grade 4 (cp Ti G4) were investigated. The objective was to study the influence of temperature and time of acid etching on surface roughness and morphology. The roughness parameters were measured with 3D optical surface profilers and the surface morphology was analyzed by scanning electron microscopy. The results showed that the roughness parameters Ra, Rsk, Rz, Rms, peak size and valley depth increased as the temperature and time of etching increased. An empirical mathematical model was developed relating the etching variables to the roughness parameters. Based on this mathematical model, one may choose the optimum temperature and time of etching to obtain the best surface roughness parameters for osseointegration.
Keywords: Titanium; Implants surface treatment roughness; Biocompatibility; Osseointegration; Biomaterial
Introduction
Commercially pure titanium (cp Ti) and its alloys are used as biomaterials in medicine and dentistry. In dentistry, cp Ti is used to manufacture permanent dental implants. This application is due the cp Ti osseointegration ability (attachment and adhesion of bone cells to the implant surface). CP Ti osseointegration is associated with the properties of a titanium oxide (TiO2) surface layer, which enables adherence of proteins (fibronectin, osteopontin, sialoprotein) and induces cell differentiation in osteoblasts [1]. Another reason why cp Ti is used in dental implants is that this material does not damage cells, is not rejected by the immunological system and resists to mechanical loadings that occur in the oral environment. Other biomaterials like stainless steel, Cr-Co alloys, alumina, and zirconia induce the formation of fibrous tissue, compromising osseointegration [2].
It is widely recognized that cp Ti dental implant surface roughness is an important parameter for osseointegration [3,4]. Micro and nano roughness are important surface features, since mesenchymal cells adhesion, proliferation and differentiation are sensitive to this implant surface characteristic [5]. Meanwhile osteoblasts involved in osseointegration have better adherence in rough titanium surfaces; cells responsible for soft tissue sealing (fibroblasts) have higher adhesion rates into smooth surfaces [6-8].
Several authors measured the roughness of acid etched, sandblasted and anodized surfaces and analyzed the influence of the roughness parameters on the osseointegration of titanium dental implants [9-11]. They studied the effects of sub-micron topography and microtopography on bone bonding and interfacial stability of endosseous implants. All concluded that it is important to control the surface roughness in order to improve the success rate of dental implants. In the case of acid etching, the time and temperature of the treatment are important parameters.
Considering the lack of information on acid etching of cp Ti surfaces, the purpose of this work was to correlate the roughness parameters with temperature and time of etching. An empirical mathematical model based on multiple regressions was formulated and solved. This model could be of interest for the implant industry.
Materials and Methods
Twenty-nine cp Ti G4 discs were polished and rinsed in water. Of these, 27 discs were etched in an acid mixture at three temperatures (55, 60 and 65 °C) for 55, 65 and 75 min and two remained unetched and were used as controls.
The surface morphology of the titanium discs was observed using a scanning electron microscope FEI Quanta FEG 250 (FEI, Hillsboro, Oregon-USA) equipped with e-Flash Bruker energy dispersive x-ray spectrophotometer (EDS) microprobe (Bruker Corporation, Billerica, Massachusetts, USA).
The roughness parameters were measured in an optical 3D surface profiler New view 7100 (ZYGO Corporation, Middlefield, CT-USA). This instrument let us measure parameters without specimens' contact utilizing a light interference phenomenon. Using a laser as collimated light source, interference patterns are generated by light emitted directly by the source and those reflected by the surface. The apparatus captures phase difference according to specimen irregularity. With obtained data, the equipment software generates a 3D image of the surface, associating it to superficial roughness parameters. This instrument advantage among others is that it's possible to measure roughness without need of physical contact with the surface and allow damage to the material. Another advantage of this perfilometer is the low time needed to acquire data, knowing that it only takes a brief emission of light from the source to conclude measure, which is done in a large area sections with nanometric accuracy. Analysis is concluded in a few seconds.
The following roughness parameters were determined: Ra, Rsk, Rz, Rms, peak size and valley depth. Three samples were investigated for each temperature and time of etching. In each disc, 3 linear measures were performed in 3 areas of 2x2mm. Thus, 9 values for each roughness parameters were obtained.
In order to assess the influence of the etching parameters on surface roughness, an empirical model based on multiple regression was formulated and solver using the MiniTab Express software.
Results
Figure 1: SEM micrographs of surface morphology and 3D profile after different times of etching at 55 °C.

Figure 2: SEM micrographs of surface morphology and 3D profile after different times of etching at 60 °C.

Figure 1-3 shows the surface morphology after different acid treatments. It was observed that as the etching temperature and time increased, the number of microcavities increased. The EDS analysis of the samples surfaces after acid etching showed titanium and oxygen in all groups, which characterize titanium oxide.
The 3D surface profiles after different etching parameters were included in Figure 1-3. A large number of peaks in the surface were observed, which were suitable for adhesion of proteins such as fibronectin. This protein attracts undifferentiated cells and facilitates the adhesion of osteoblasts, a mechanism that is involved in osseointegration.
Table 1-3 show the roughness parameters of the titanium surface after etching at different temperatures and times. The influence of surface treatment on Ra and peak size is displayed in Figure 3. As the figure shows, these parameters increase with temperature and time of etching. The values of Rz and Rms have a similar behavior.
Table 1: Values of Ra, Rsk for different temperatures and times of etching.

Table 2: Values of peak and valley dimensions for different temperatures and times of etching.

Table 3: Values of Rz and Rms for different temperatures and times of etching.

Using the software Minitab, a multiple regression was performed, and the equations showed the relation between the roughness parameters and the etching variables. Each equation shows one of the roughness parameters as a function oftemperature and time of etching.
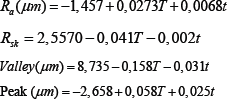
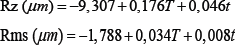
Where T is the temperature in °C and t is the time in min.
Discussion
The present work examined the surface roughness of cp Ti after acid etching because the surface topography is important for short- and long-term success of titanium dental implants. Boyan et al. [10] showed that fibroblasts and epithelial cells adhere more strongly to smooth surfaces, whereas proliferation of osteoblastic cells and collagen synthesis are increased on rough surfaces.
Figure 3: SEM micrographs of surface morphology and 3D profile after different times of etching at 65 °C.

In the present work it was measured roughness parameters Ra, Rms and Rz. These roughness parameters represent different means of the same data: the distance of one coordinate to the average line. Ra is an arithmetic mean and Rms is the root mean square.Largest distances between the average line and the undermost points of sample space are Valley and Peak, respectively. Rz is the absolute mean of the difference between dimensions of the five highest peaks and the five deepest valleys. Rsk is the quantification of symmetry regarding average line. When Rsk have positive signal, there is peaks predominance. When the signal is negative, there is valleys predominance.
The lowest roughness was found after surface treatment at 55 °C for 55 minutes. Roughness data shown in Table 1-3 confirm the surface morphology observed by SEM (Figure 1). The roughness increased with temperature and time of etching. These results corroborate those obtained from Lin & Zhou [11]. The highest value of Ra (0.919 μm) and the deepest valley (4.0μm) were obtained in the samples treated at 65 °C for 75 minutes (Figure 3).
The precise role of surface roughness (Ra, Valley, Peak, Rz) on the early events of osseointegration remain poorly understood. Rougher surfaces measured by Ra have shown better bone apposition and bone-to-implant contact (BIC), firmer bone fixation and faster osseointegration than smooth or machined surfaces [12].
Brugge et al. [13] showed that titanium surface roughness (Ra=0.60-1.64μm) affect the initial interaction of adhesion of osteoblast-like U-2 OS cells. Dental implant manufacturers try to achieve a surface roughness with Ra between 0.8 and 1.2μm, which the best range for protein adhesion. In the present work, only the treatment at 65 °C for 75 minutes was in this range.
The results showed that the peaks size presented small alteration with the acid treatments. This result indicates that the acid solution removes material homogeneously from the entire surface and created valley.
It was observed that Rsk decreased as the temperature and time of etching was increased. This is attributed to a larger removal of material, which is also responsible for deeper valleys. The statistical tools of Minitab used to analyze the experimental results were the calculation of the parameters P-value, S, R-sq, R-sq (adj), R-sq (pred) and the determination of the regression equation. The P-value represents the statistical significance of the experimental parameters. S quantifies the difference between the model and the experimental data. R-sq and R-sq (adj) represent the dependence of the model on the experimental data. R-sq (pred) represents the dependence of a predicted value on the model, substituting a couple of factors. Finally, the regression equations represent a mathematic model that describes the influence of the treatment variables (temperature and time) in roughness parameters.
Based on the P-value, it is observed that all roughness parameters present a statistically significant difference, except for Rsk, for which the etching time has a P-value>%. This means that the etching time does not have a significantly influence on the value of Rsk.
Equations that describe mathematically Ra, Rz and Rms presented statistically meaningful dependence. They show the small S of the models. Models of Rsk, Peak and Valley did not present an R-sq value sufficiently high to be considered a good fit.
When we compare the coefficients of temperature and time in the mathematical regression equation it is possible to observe that the temperature has a stronger influence than the time etching on the surface roughness parameters. The highest ratio between temperature and time coefficient is for Rsk (0.041/0.002). The temperature of the acid exerts an influence 20.5 times the immersion time on the value of Rsk. The smallest ratio between temperature and immersion time was in the equation for Peak, where the temperature coefficient is 2.32 larger than that for the etching time.
In the present work the X-ray diffraction has not been done for crystal phase identification. But Chrcanovic et al. [14] although they did not cite the composition of their acid solution for titanium surface treatment, they used a similar acid etching process and identified the presence of TiH2 on the surface of all samples submitted. Their analyzed samples surface chemical composition showed 20 to 40% of titanium hydride (TiHx, x≤2). Figure 3 shows some cracks induced by acid etching. These cracks are induced by hydrogen brittleness process.
Conclusion
Based in the results of the present work, one may conclude that:
a. Temperature and time of etching have a significant influence on the roughness parameters;
b. The proposed mathematic equations describe correctly the influence of temperature and time of etching on the values of roughness parameters;
c. For the temperature and time intervals used in the present work, etching temperature has a stronger influence on surface roughness than etching time;
d. The experimental results show that it is possible to optimize the surface roughness of Ti cp G4 using acid etching in order to improve osseointegration.
Acknowledgement
We thank Carlos Chagas Foundation for Research Support from the Rio de Janeiro State (FAPERJ) and the National Council of TechnologicalandScientificDevelopmentfromBrazilianGovernment (CNPq) for supporting this study via grants: E-26/201.759/2015, E-26/201.828/2015, E-26/010.001.262/2015 and 168807/20173.
References
- Textor M, Sittig C, Frauchiger V, Tosatt S (2001) Properties and biological significance of natural oxide film on Ti and its alloys. In: Brunette DM, Tengvall P, Textor M, Thompsen P (Eds.), Titanium in medicine. SpringerVerlag, Berlin, Germany, pp. 171-230.
- Elias CN, Meirelles L (2010) Improving osseointegration of dental implants. Expert Review Medical Devices 7(2): 241-256.
- Elias CN (2010) Titanium dental implant surfaces. Revista Matéria 15(2): 138-142.
- Sul YT, Johansson C, Albrektsson T (2006) Which surface properties enhance bone response to implants? Comparison of oxidized magnesium, Ti Unite, and Osseotite implant surfaces. International Journal of Prosthodontics 19(4): 319-328.
- Meirelles L, Melin L, Peltola T, Kjellin P, Kangasniemi I, et al. (2008) Effect of hydroxyapatite and titania nanostructures on early in vivo bone response. Clinical Implant Dentistry and Related Research 10(4): 245254.
- Eriksson C, Lausmaa J, Nygren H (2001) Interactions between human whole blood and modified Ti-O2-surfaces: Influence of surface topography and titanium oxide thickness on leukocyte adhesion and activation. Biomaterials 22(14): 1987-1996.
- Atsuta I, Ayukawa Y, Kondo R, Oshiro W, Matsuura Y, et al. (2016) Soft tissue sealing around dental implants based on histological interpretation. Journal of Prosthodontic Reasearch 60(1): 3-11.
- Rompen E, Domken O, Degidi M, Pontes AEF, Piattelli A (2006) The effect of material characteristics, of surface topography and of implant components and connections on soft tissue integration: a literature review. Clinical Oral Implant Research 17 Suppl 2: 55-67.
- Anil S, Anand PS, Alghamdi H, Jansen JA (2011) Dental implant surface enhancement and osseointegration. In: Ilser Turkyilmaz (Ed.), Implant Dentistry-A Rapidly Evolving Practice, In Tech, pp. 83-108.
- Boyan B, Dean D, Lohmann C, Cochran D, Sylvia V, et al. (2001) The titanium-bone cell interface in vitro: The role of the surface in promoting osteointegration. In: Brunette DM, Tengvall P, Textor M, Thomsen P (Eds,) Titanium in medicine. Springer-Verlag 561-585.
- Lin X, Zhou L, Li S, Lu H, Ding X (2014) Behavior of acid etching on titanium: topography, hydrophility and hydrogen Concentration. Biomedical Materials 9(1): 015002.
- Wennerberg A, Albrektsson T (2010) On implant surfaces: a review of current knowledge and opinions. The International Journal of Oral & Maxillofacial Implants 25(1): 63-74.
- Ter Brugge PJ, Dieudonne S, Jansen JA (200) Initial interaction of U2OS cells with noncoated and calcium phosphate coated titanium substrate. Journal Biomedical Materials Research 61(3): 399-407.
- Chrcanovic BR, Martins MD (2014) Study of the influence of acid etching treatments on the superficial characteristics of Ti. Materials Research. 17(2): 373-380.
© 2018 Ariel Assayag, et al. This is an open access article distributed under the terms of the Creative Commons Attribution License , which permits unrestricted use, distribution, and build upon your work non-commercially.
Editor In Chief


.jpg)


Signup for Newsletter

Quick Links
 Editorial Board Registrations
 Submit your Article
 Refer a Friend
 Advertise With Us
Our Recent Edition

.jpg)


Top Editors


.jpg)


.bmp)
.jpg)
.png)
.jpg)


.jpg)


.png)

.png)


.png)


Financial Support

Sponsors

Latest e-Books

Latest Video

 a Creative Commons Attribution 4.0 International License. Based on a work at www.crimsonpublishers.com.
Best viewed in
a Creative Commons Attribution 4.0 International License. Based on a work at www.crimsonpublishers.com.
Best viewed in