- Submissions

Full Text
Research & Development in Material Science
Impact of Alumina Trihydrate and Silica on Mechanical, Thermal and Electrical Properties of Silicone Rubber Composites for High Voltage Insulations
Hidayatullah Khan1*, Muhammad Amin2, Ayaz Ahmad1 and Muhammad Yasin3
1Department of Electrical Engineering, COMSATS Institute of Information Technology, Pakistan
2Department of Electrical Engineering, Ghulam Ishaq Khan Institute of Engineering Sciences and Technology, Pakistan
3Department of Electrical Engineering, National University of Sciences and Technology, Pakistan
*Corresponding author: Hidayatullah Khan, Department of Electrical Engineering, COMSATS Institute of Information Technology, Wah Cantt, Punjab 47040, Pakistan
Submission: November 07, 2017; Published: December 01, 2017

ISSN : 2576-8840Volume2 Issue3
Abstract
In recent years, silicone rubber (SiR) based composites have been widely investigated for outdoor applications due to its promising insulating properties. However, mechanical, thermal and tracking properties of pure silicone rubber are very low, which restrains its application for long-term performance. In this research work, the influence of micro-sized alumina-tri-hydrate (ATH) and micro/nano-sized silica (SiO2) fillers on mechanical, thermal and electrical properties of room temperature vulcanized (RTV) SiR has been studied. SiR-blends with varying amounts of ATH and SiO2 particles were prepared, by following blending in a two roll mixing mill, compression moulding and post curing processes sequentially. In order to evaluate relative tracking and erosion resistance of SiR-blends, inclined plane test (IPT) was conducted in accordance with ASTM-D-2303 standard procedure. Surface temperature distribution was recorded using Fluke-Ti25 infrared (IR) camera during IPT experiments. Thermogravimetric analysis (TGA) was carried out to analyze thermal stability of ATH/SiO2 filled SiR Composites. Surface morphology, tensile strength, percent elongation at break (%EAB), hardness, erosion, tracking resistance and thermal properties were also investigated and discussed. Results showed that the mechanical, thermal and tracking/erosion performance of SiR-blends improves by the incorporation of ATH/silica particles, which is governed by filler type, size and wt% in polymer matrix.
Keywords: ATH; IPT; Characterization; SiR; SiO2
Introduction
Since 1970s, silicone rubber has been used for outdoor insulation [1]. Due to light weight, unique hydrophobicity, better pollution/contamination performance, easy installation and excellent insulation properties (resistivity>1012 Ohms), SiR composite insulators are broadly employed in High Voltage (HV) transmission and distribution [2]. However, these polymeric materials are affected by various types of environmental and electrical stresses which limit its use as HV insulants [3,4]. Heavy rain, ultraviolet radiation (UV), pollution, dry band arcing, corona discharge, temperature, chemicals, cyclic loads and the moisture penetration plays a significant role in SiR degradation [5]. In addition, the tracking and erosion of polymer insulants due to the dry band arcing is the other main problem which is not yet fully addressed [6]. During service, if the localized surface temperature due to dry-band arcing becomes greater than the insulants safe limit, chemical reaction may takes place, which can lead to material tracking and erosion [7].
In order to enhance mechanical, thermal and tracking properties of pure SiR insulants, making these promising candidates for HV outdoor applications, inorganic particles incorporation in the base material attained focused attention of the researchers. Improvement in the physical and electrical properties, due to incorporation of micro and nano sized particles motivated researchers to try different types as well as sizes of fillers, so as to optimize its performance as insulants [8-11]. Furthermore, inorganic particles build the barrier to avoid surface tracking and hinder the insulator surface erosion as a result of heat produced during dry-band arcing, thus preventing the material degradation [12]. Previously, Fe2O3 [13], Al2O3 [14], carbon black, titanium dioxide, magnesium oxide, calcium carbonate and ZnO etc. were dispersed in SiR matrix and investigated [15-17]. However, these fillers are costly and susceptible to acid attack. ATH and natural silica have also been frequently incorporated into SiR matrix to tweak mechanical, thermal, tracking and erosion resistance [7,18,19] This reinforcement is the function of filler size, shape and dispersion as well as molecular interactions [20].
Recently, synthesis, design, thermal degradation and erosion resistance of SiR composites was reported in number of studies [11,21-29]. Du et al. [21] reported that material degradation depends on leakage current magnitude and arc mobility. Likewise, Ansorge et al. [22] found that at high temperature (350 °C for pure SiR), thermal degradation of SiR composites is due to de-polymerization and formation of low molecular weight (LMW) components, which varies with pollution density and polymer functional groups. According to Meyer et al. [23] the Particle size, shape and particle-polymer bond potential are the utmost significant features of inorganic fillers to improve the polymer characteristics (electrical, mechanical and thermal).Furthermore, the authors of [24], investigated the impact of particle size, its surface modification and tracking resistances. In other work Du et al. [25] studied the influence of thermal conductivity on dc resistance to erosion of SiR/BN nano-composites. They inferred that with the increase in particle concentration from 0 to 7wt% thermal conductivity enhances, thereby reducing the weight loss and erosion. Likewise, the authors of [26], examined the effect of barium titanate (BaTiO3) on surface degradation and tracking resistance of room temperature vulcanized (RTV)-SiR composites. Isaias et al. [11], investigated the inclined plane tests on ATH and silica filled composites with SiR and EPDM to evaluate the effect of inorganic particles on erosion/tracking resistance of SiR and EPDM composites. According to Refat et al. [27], the dry-band arcing and erosion of SiR can be suppressed by incorporating ATH and silica particles in the DC-IPT using wavelet based multi resolution analysis of leakage current. Likewise, it is studied that particles networked dispersion in polymer matrix can improve the composites properties [28].
This work is the continuation of our previous work in which we investigated the impact of silica particles on mechanical, thermal and electrical properties of EPDM, Epoxy and SiR composites [29]. However, AC-IPT based analysis of ATH and silica particles filled SiR Composites has not been thoroughly investigated before to the best of our knowledge. Investigated SiR composite insulants showed high tracking and erosion resistance as well as enhanced mechanical and thermal properties, indicating great potential for electronic and electrical engineering applications, such as high voltage transmission and substation insulation. Samples of SiR mixed with micro-sized ATH, micro-sized SiO2, micro-sized (ATH+SiO2) and (micro-sized ATH+nano-sized SiO2) particles with different wt% ATH/SiO2 were prepared and investigated using IPT analysis in this study. The performance metrics studied includes: tensile strength, %elongation at break, hardness, weight loss with temperature and erosion/ tracking resistance properties of SiR novel blends. The synergetic impact of micro-ATH and micro/nano- sized-SiO2 fillers and their wt% on the overall performance of SiR blends are discussed.
Experimental
Materials
In this work the base material, RTV-SiR (70% Poly-di-methyle- siloxane(PDMS and 30% vinyle) with density 1.15g.cm-3 was supplied by Wacker Chemie Germany. And the micro-ATH, micro- SiO2 and nano-SiO2 fillers were produced by Huber Engineering materials, US-silica and Sigma-Aldrich, respectively. In addition, different physical properties of ATH and Silica particles are tabulated in Table 1. Moreover, various auxiliary chemicals like sulpher, ZnO, stearic-acid etc, were commercially available and purchased from local market. Furthermore, the chemical structures of ATH, SiO2 and SiR are shown in Figure 1 respectively.
Figure 1: Chemical structure of (a) SiR, (b) SiO2, and (c) ATH.
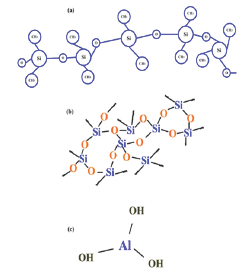
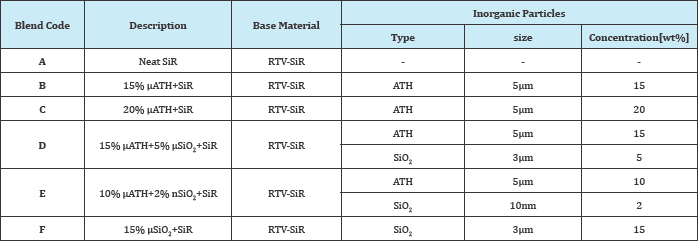
Table 1: Prepared Particles specifications.

Blends preparation
Preparation of RTV-SiR composites were performed in a high shear blender (HSM-100LSK) via simple blending followed by hot-compression moulding and post curing technique. Blending of SiR and inorganic-particles (ATH/SiO2) with known quantity of activator and accelerators was carried out in a two roll mixing mill using ASTM-D 1418-10a standard procedure [30]. During mixing the mixer speed, mixing duration and temperature were kept as 50rpm, 20 minutes and 150 °C, respectively. Thereafter, the amalgamated mixture was poured into pre-heated steel mold (circular shape, 3.5mm thick and 85mm dia), following by compression molding in hydraulic press at 20MPa for 30 minutes.ZnO, Tetra-Methyle-Thiuram-Disulphide (TMDTD), stearic-acid and Mercapto-Benzo-Thiazole (MBT) were used as auxiliary additives. Moreover, further details about blends preparation can be seen from our previous studies [29,31,32]. Chemical composition of doped and un-doped SiR samples are summarized in Table 2.
Table 2: samples chemical composition.
Blends characterization
Microstructural characterization: To develop polymer composites with optimized properties, the uniform dispersion of filler particles in polymer matrix is a critical dilemma. In this work a Hitachi-S4700 (USA), scanning electron microscope (SEM) was used to image the blends cross-sectional morphology. Moreover, before microstructural studies all blends were coated with gold to control the charging effects. All micrographs of square-shape samples (size ~10x10mm2) were recorded at a magnification of ~1000x.
Mechanical characterization: Mechanical properties such as Tensile Strength (TS) and %-Elongation at break (%EAB) were measured using universal testing machine (Instron-4465) with a 25mm/min cross head speed at room temperature according to ASTM D-412 [33]. Samples used were dumped shaped as per standard requirements. The Tensile strength and elongation at break can be calculated using the following equations [34].
TS (MPa) = P / A (1)
EAB (% strain) = E / L x 100 (2)
Where, P, A, E and L represents the applied load, cross sectional area, strain at failure and gauge length, respectively.
Shore A Duo (Durotech) equipment was used to measure hardness as per ASTM-D2240 standard [35]. All hardness tests were performed on square shaped samples (50x50x3.5mm) and average of three blends of same composition is reported.
Thermal characterization: Percentage weight loss and thermal stability of prepared blends was performed using a thermal analyzer (Shimadzu-TGA-50H Japan) at 20 °C/min heating rate in temperature range 0 °C-850 °C. All tests were conducted on 20mg samples in air ambiance by fixing the sample between two temperature controllable flat plates to provide uniform heat flow. The 10%, 50% and final residual weight temperature were measured under steady state condition for each sample.
Electrical characterization:
a. Inclined plane test (IPT) setup for tracking/erosion analysis
Figure 2: IPT Test Setup.
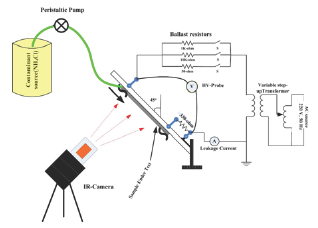
Various accelerated tests were employed to predict the performance and life of SiR-blends housing on HV transmission and distribution insulators. To evaluate the capacity of SiR composites to resist surface tracking and erosion, ASTM-D 2303 Inclined Plane Tracking (IPT) and erosion test is employed [36]. Figure 2, shows the test setup of IPT test with variable AC voltage source as per standard requirements. Each sample of size 65x25x3.5mm was energized from 220V, 50Hz AC voltage source with 70kVA/10kV variable transformer. In this test-setup, the composite samples were mounted at an angle of 45 °C with respect to horizontal line along with contamination (NH4CL with concentration of 1g/ dm3 of distilled water) flow rate of 0.20ml/minute. The sample under test was observed after each passing hour, if the sample under test did not track, then the applied voltage was increased by 250V. In subsequent stages, the same procedure is followed until a continuous tracking of 25mm deep on insulator surface or leakage current of more than 60mA for 2s is observed [37]. Further, if the sample did not track in 6 hours, the test is stopped as required by the ASTM D2303 standard. In addition, measurement of the surface temperature distribution was recorded by Fluke-Ti25 infrared (IR) camera at equal interval of time, whereas leakage current (LC) was measured using Fluke-digital multi-meter between sample and ground terminal. As proposed by standard, before and after testing, all the specimens were cleaned with distilled water and alcohol (isopropyl) and weighted. The percent eroded mass was calculated using following equation [38].
% eroded mass = [(final mass - initial mass)/ initial mass] x 100 (3)
Results and Discussion
Morphology results
Figure 3: SEM of cross section of SiR blends.
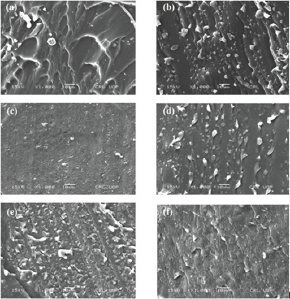
The filler particles distribution, geometry, size and concentration in the polymer matrices have greatly influenced the mechanical, thermal and electrical properties of resultant composites [3,17,39,40]. Figure 3(e-f) presents, the SEM micrographs (on cross-section surface) of ATH/SiO2 filled silicone rubber blends. From all micrographs no major dents and cracks were seen on surface of all blends. Moreover, among unfilled and filled SiR blends significant difference can be seen. Compared to SEM micrographs of blend-B and C, the neat SiR blend (Figure 3a) and filled SiR blends (Figure 3d-f) showed large agglomerates and in homogeneities. Furthermore, the 15% ATH blend (Figure 3b) and 20%ATH blend (Figure 3c) with silicone rubber showed higher filler homogeneity and reduced filler agglomerations. Additionally, from SEM images it is obvious that each blend exhibited dissimilar micrographs with different phase difference among particles and base material. Consequently, each sample will exhibit different behavior in mechanical, thermal and electrical analysis. Hence, based on microstructural results, it can be inferred that the overall performance of micro-ATH filled SiR composited would be higher than that of the SiR hybrid (ATH+SiO2 co-filled) composites.
Mechanical Results
Figure 4: Mechanical results: (a) Tensile strength and % change of SiR-blends, (b) Elongation at break and % change of SiR-blends, (c) Hardness and % change of SiR-blends.
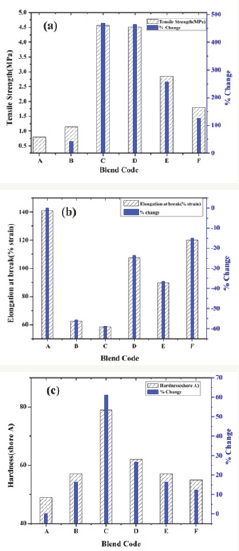
Mechanical properties like average tensile strength, % elongation at break and hardness of SiR-blends are compared in Figure 4(a-c). It can be seen that blending of ATH and SiO2 particles with SiR can result in enhanced mechanical features. The improved tensile strength of ATH/SiO2 and ATH-SiO2-cofilled SiR-blends are presented in Figure 4a. This improvement is 42.5% for blend-B, 470% for blend-C, 463% for blend-D, 256.25% for blend-E and 125% for blend-F. Among all blends, only blend-C showed higher tensile strength of~4.56 MPa as depicted in Figure 4a, which may be due to higher cross-linking (intense Hydrogen-bond between -OH groups of base rubber and filler surface groups) among SiR matrix and ATH particles. Another reason is may be the smaller free volume as well as particle uniform dispersion in polymer matrix which restricts chain mobility and consequently improves tensile property.
Likewise elongation at break (which act as insulants degradation indicator) of all prepared blends was decreased with the addition of both ATH and silica particles in different wt% as summarized and compared in Figure 4b. This decrease in EAB is 55.60% for blend-B, 58.65% for blend-C, 23.68% for blend-D, 36.4% for blend-E and 14.9% for blend-F. Maximum EAB was exhibited by blend-C as shown in Figure 4b. This decreasing trend in EAB of SiR blends is attributed to smaller inter-particle distances, strong bond energy and enhanced cross-linking, which restrain chain scission and molecular instabilities.
Similarly all SiR-blends showed improvement in hardness with the addition of ATH/SiO2 particles in different wt%. This hardness improvement is 16.32% for blend-B, 61.22% for blend-C, 26.5% for blend-D, 16.32% for blend-E and 12.24 % for Blend-F as shown in Figure 4c. From Figure 4c, it is obvious that higher hardness was exhibited by blend-C (~79, shore A) compared to neat and all other SiR samples. This enhancement is attributed to particles small size, uniform dispersion, higher molecular interactions and improved cross-linking among particles and base matrix. Hence generally all SiR-blends showed improved mechanical properties, but blend-C (20%o|±ATH) exhibited excellent mechanical properties.
TGA Studies
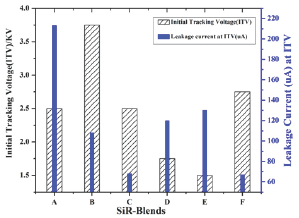
Figure 5: Initial Tracking voltage and leakage current of SiR-blends.
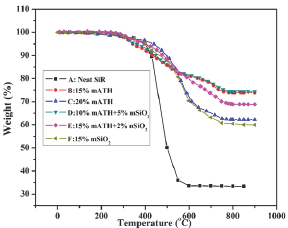
To understand the impact of ATH and SiO2 particles on thermal performance of SiR-blends, TGA was conducted as shown in Figure 5. From TGA curves (Figure 6), it is obvious that some samples exhibit superior performance and some have degraded behavior than neat SiR for given temperature range (from 0 °C to 850 °C). Thermal stability of SiR is increased for blend-B and blend-D, whereas blend E, C and F showed degraded performance than neat SiR. For instance, at 850 °C, the final residual wt left for blend A, B, C, D, E and F are 69.24%, 73.92%, 62.19%, 74.31%, 68.81% and 59.98%, respectively (Figure 6). Among all composites, blend-D exhibited highest residuary mass (74.31%), whereas lowest mass was found for blend-F (59.98%). This variation in mass loss and final residuary is due to the material decomposition, chain scission, evaporation of volatile species, moisture and gas particles. Blends thermal degradation may be due to CH3-groups oxidation, de-polymerization, increased molecular interactions between SiR matrix and ATH/SiO2 particles at elevated temperature and covalent bonds amalgamation (H-bond). Consequently, reduction in cross-linking as well as Vander wall forces can be exhibited by SiR blends at higher temperatures. Hence from TGA analysis, we infer that hybrid-particles (ATH+SiO2) in certain proportion have significant impact on SiR thermal characteristics as validated by blend-D composition [39,40].
Figure 6: TGA curves of SiR-blends.
Electrical properties
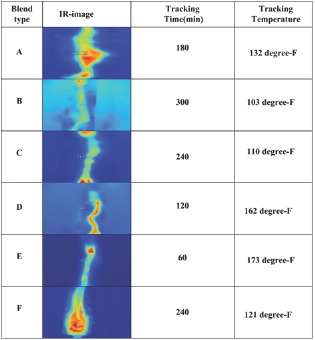
Tracking/Erosion analysis results: The initial tracking voltage (ITV) and corresponding leakage current (LC) obtained for polymer samples are figured as function of SiR-blends as shown in Figure 5. It can be noted that ITV is independent of particles concentration (wt. %) and depends on energy dissipation in SiR- blends [41]. From Figure 6, it can be seen that ITV and LC varies in discrete proportion to ATH/SiO2 filled SiR-blends. Its measured values are 2.5kV, 3.75kV, 2.56kV, 1.75kV, 1.5kV and 2.75kV for blends A, B, C, D, E and F, respectively. Among all the investigated samples maximum ITV is exhibited by blend-B compared to other SiR-blends. During test, execution chalking and hydrophobicity variation was also noticed in direct proportion with the applied voltage and test execution time on the top surface of SiR-blends. In addition, the Amonium-chloride (NH4CL) contaminant during IPT test, bridges the top and bottom electrodes, which causes surface conductivity and joule-heating effect. As a consequence, the dry-band-arcing (DBA) is formed as soon as the input voltage exceeded than the sample breakdown voltage, as validated by the blends-thermographs (Figure 7). During arcing period the generated heat is conducted from arc to specimen surface, which yields caloric/thermal deterioration and transforms samples nature from hydrophobic to hydrophilic as demonstrated in Figure 7. These thermographs of SiR-blends were recorded during IPT to investigate surface tracking, thermal profile and hydophobicity variation with time. From IR images, it is obvious that DBA varies along sample surface with time, which eventually increases surface as well as surroundings temperature through diffusion of heat. Amongst all IR images of fabricated blends, it is inferred that upon gradual increase in voltage with time, minimum time-to-track was exhibited by blend-E (in 60 minutes), whereas maximum time-to- track was noticed for blend-B (in 300 minutes). From IR images, the red and bright spots denote higher temperature whereas, blueish spot indicates lower temperature
Figure 7: TGA curves of SiR-blends.
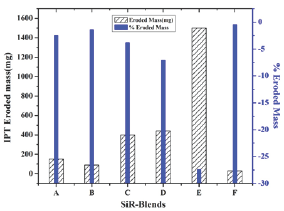
Moreover, in consequence of continuous arcing, enough energy can be transferred to the sample surface, which accelerates material decomposition as well as erosion as depicted in Figure 8. Herein, it can be seen that SiR-blends mass loss varies with filler type and concentration, which is 2.5% for blend A, 1.43% for blend B, 3.81% for blend C, 7.1% for blend D, 27.4% for blend E, and 0.5% for blend F. Among all investigated samples, maximum erosion takes place in blend E (~1500mg), whereas minimum mass loss was found in blend-F (~31mg) as shown in Figure 8. The SiR-blends with ATH (B, C, D, E) showed higher mass loss compared to SiR-SiO2 blends. It is attributed to variation in bond energies among ATH/SiO2 and SiR matrix. In addition, the heat generated during arcing and its conduction from tracked region to surrounding environment also influences the erosion of the polymeric blends, which varies for silica as well as ATH samples as validated by infrared (IR) thermographs. Furthermore, while performing erosion/tracking test, gradual decrease in sample hydrophobicity with time was noticed for all blends, but rapid hydrophobicity loss was found for blend-E as indicated by IR images. This hydrophobicity loss may be due to evaporation and diffusion of low molecular weight (LMW) particles from bulk of material to outer surface.
Figure 8: IPT eroded mass and % eroded mass of SiR-blends.
Correlation between electrical and mechanical properties: Hydrophobicity, hardness, tensile strength, dielectric strength, erosion and tracking resistance are the material physical properties. These properties vary even among identical polymer samples due to internal defects, filler type/concentrations and molecular conformations [28]. In literature there is no direct mathematical relationship between mechanical and electrical properties. However, on the basis of literature it can be correlated as follows.
The dielectric breakdown (i.e. the maximum voltage that an insulation material can sustain) property of any insulating material depends upon the intensity of applied electric field (voltage), which can be calculated using the following formula [29,30].
Dielectric strength (kV/mm)=Breakdown voltage (kV)/Sample thickness (mm) (4)
Likewise Swanson et al. [31] correlated the dielectric strength with volume/surface resistivity, relative permittivity and loss tangent according to the following formulas.
Dielectric strength (kV/mm) = A + [B*Log (ρv/(ζr*tanφ))] (5)
Where 'ρv' is the volume resistivity, 'ζr'is the relative permittivity and'tanφ’ is the loss tangent.
Volume resistivity (pv) = [1/(nxμ*e)] (6)
Where, 'n' is the number of charge carriers, V is the charge mobility and 'e’ is the particle charge
It can be seen from Eq. (6), that there is an inverse relationship between volume resistivity and charge mobility. Now as soon as the applied electric field (applied voltage) across the polymer samples increases, the corona discharge generates ionic particles and energetic electrons, ultraviolet, ozone etc. Consequently these particles will cause the degradation of macromolecular chains into low weight molecules (LWM) due to chemical bonds breaking [32,33]. Hence, with the increase in surface discharges due to applied voltage, the increased crosslinking process prevents the low weight molecules to transfer from bulk of the material to surface, which led to a reduction in hydrophobicity and mechanical stability [34]. This reduction in surface hydrophobicity due to electrical and non-electrical stresses could speed up the surface deterioration and physical defects (pores and flaws), thereby reducing surface/volume resistivities. As a consequent, it induces leakage current (LC) and dry band arc discharges on SiR Specimens [35]. This LC gives us good indications about mechanical and surface degradation process, because there is a direct relationship between LC and surface hydrophobicity (resistivity) as was observed during tracking/erosion investigations (section 3.3.1) of SiR blends.
In addition, the electrical (i.e. arcing, corona discharge, leakage current) and environmental stresses (i.e. Heat, UV-radiation, wind, biological degradation, snow, acid rain) have significant effect on insulation mechanical, thermal and electrical properties [36,37]. As the electrical stress occurs on insulator surface, it leads to the degradation of electrical characteristics, which is due to the loss of low molecular weight components and volatile particles. Likewise, the environmental stresses such as UV, Heat, snow, acid rain and biological factors de-polymerizes polymer insulants and scission of Si-O-Si chains. Consequently, loss of elasticity, erosion and surface roughness takes place which leads to reduction in mechanical stability. Hence it can be inferred that due to electrical and environmental stresses there is a direct relationship between electrical and mechanical properties as validated by IPT test and IR images. Because during IPT operation gradual decrease in hydrophobicity (resistance to water absorption and flow) followed by increase in LC was observed. As soon as sample lost their surface resistivity, tracking was occurred followed by erosion and weak mechanical performance [38-41].
Conclusion
In summary, the RTV-SiR composites filled with micro- ATH, micro- and nano-sized silica particles were prepared and investigated for surface morphology, mechanical, thermal, tracking and erosion properties. The amalgamation of micro/nano particles into SiR base matrix imparted enhanced mechanical, thermal and electrical properties. The major conclusions are summarised as follows.
a. Mechanically: Compared to all other SiR composites, the blend-Cshowed higher tensile strength (~4.56MPa), reduced elongation at break (~58.3% strain) and improved hardness (~79).
b. Thermally: The hybrid blend-D exhibited excellent thermal stability by leaving higher residual mass (74.3%) at 850 °C than that of other SiR blends. In addition, at 850 °C the neat SiR sample showed inferior thermal stability by leaving lower residual mass (33%).
c. Electrically: The enhancement in tracking and erosion resistance was found both for ATH and silica filled blends. However, comparison to the ATH/SiO2 filled SiR composites, the maximum tracking resistance was demonstrated by blend-B~3.75kV. Likewise, the maximum erosion resistance (lower eroded mass) was computed for blend-F (31mg), which is too lower than all SiR specimens.
Hence from silicone rubber novel blends, it is inferred that micro-ATH blends showed enhanced mechanical and tracking performance, while hybrid blend (D) and SiO2-filled blend (F) exhibited higher thermal stability and erosion resistance, respectively. These characterization results will satisfy the applications of SiR insulants in the field of electronic and electrical engineering.
References
- Ramirez, Cherney EA, Jarayam (2012) Comparison of the erosion resistance of silicone rubber and EPDM composites filled with micro silica and ATH. IEEE Transactions on Dielectrics and Electrical Insulation 19(1): 218-224.
- Song W, Shen WW, Zhang GJ, Song BP, Lang Y, et al. (2015) Aging characterization of high temperature vulcanized silicone rubber housing material used for outdoor insulation. IEEE Transactions on Dielectrics and Electrical Insulation 22(2): 961-969.
- Moghadam MK, Morshedian J, Ehsani M, Laine RM, Kuang LY, et al. (2014) Effects of Ph12SQ on the thermal stability and mechanical properties of high temperature vulcanized (HTV) silicone rubber. IEEE Transactions on Dielectrics and Electrical Insulation 21(2): 244-252.
- Wei JZ, Min DZ, Kang WL, Hui YZ, Chen G (2014) Effect of micro-Si3N4- nano-Al2O3 co-filled particles on thermal conductivity, dielectric and mechanical properties of silicone rubber composites. IEEE Transactions on Dielectrics and Electrical Insulation 21(4): 1989-1996.
- Yanfeng G, Jiafu W, Xidong L, Zhipeng Y, Yingyan L, et al. (2014) Investigation on permeation properties of liquids into HTV silicone rubber materials. IEEE Transactions on Dielectrics and Electrical Insulation 21(6): 2428-2437.
- Gorur R, Cherney E, Hackam R (1987) Performance of polymeric insulating materials in salt-fog. IEEE Transactions on Dielectrics and Electrical Insulation 2(2): 486-492.
- Venkatesulu B, Thomas MJ (2010) Erosion resistance of alumina-filled silicone rubber nanocomposites. IEEE Transactions on Dielectrics and Electrical Insulation 17(2): 615-624.
- Burditt N (1991) Mineral fillers in polymers. A special review. In: Griffiths J (Ed.), 947671: 8.
- Zhao T, Bernstorf RA (1998) Ageing tests of polymeric housing materials for non-ceramic insulators. IEEE Electrical Insulation Magazine 14(2): 26-33.
- Ansorge S, Schmuck F, Aitken S, Papailiou K (2010) Improved performance of silicone rubbers for the use in composite insulators. CIGRE, Paris, France.
- Ramirez, Cherney EA, Jarayam S (2012) Comparison of the erosion resistance of silicone rubber and EPDM composites filled with micro silica and ATH. IEEE Transactions on Dielectrics and Electrical Insulation 19(1): 218-224.
- Vas JV, Venkatesulu B, Thomas MJ (2012) Tracking and erosion of silicone rubber nanocomposites under DC voltages of both polarities. IEEE Transactions on Dielectrics and Electrical Insulation 19(1): 91-98.
- Dickstein W, Siemens R, Hadziioannou E (1990) Dynamic mechanical and thermogravimetric analyses of the effect of ferric oxide on the thermaloxidative degradation of silicone rubber. Thermochimica Acta 166: 137-145.
- Meyer LH, Cherney EA, Jayaram SH (2004) The role of inorganic fillers in silicone rubber for outdoor insulation alumina tri-hydrate or silica. IEEE Electrical Insulation Magazine 20(4): 13-21.
- Wang X, Nelson JK, Schadler LS, Hillborg H (2010) Mechanisms leading to nonlinear electrical response of a nano p-SiC/silicone rubber composite. IEEE Transactions on Dielectrics and Electrical Insulation 17(6): 16871696.
- Zha JW, Zhu YH, Li WK, Bai J, Dang ZM (2012) Low dielectric permittivity and high thermal conductivity silicone rubber composites with micro- nano-sized particles. Applied Physics Letters 101(6): 62905.
- Zha JW, Dang ZM, Li WK, Zhu YH, Chen G (2014) Effect of micro-Si3N4- nano-Al2O3 co-filled particles on thermal conductivity, dielectric and mechanical properties of silicone rubber composites. IEEE Transactions on Dielectrics and Electrical Insulation 21(4): 1989-1996.
- Prabu RR, Usa S, Udayakumar K, Khan AM, Majeed SSM (2007) Electrical insulation characteristics of silicone and EPDM polymeric blends. IEEE Transactions on Dielectrics and Electrical Insulation 14(5): 1207-1214.
- Iida K, Hackam R (2005) Effect of low molecular weight fluid on the surface free energy of an alloy of EPDM/SIR. ISEIM pp. 352-355.
- Cherney EA (2013) Nanodielectrics applications-today and tomorrow. IEEE Electrical Insulation Magazine 29(6): 59-65.
- Du BX, Xu H (2014) Effects of thermal conductivity on dc resistance to erosion of silicone rubber/BN nanocomposites. IEEE Transactions on Dielectrics and Electrical Insulation 21(2): 511-518.
- Ansorge S, Schmuck F, Papailiou KO (2015) Impact of different fillers and filler treatments on the erosion suppression mechanism of silicone rubber for use as outdoor insulation material. IEEE Transactions on Dielectrics and Electrical Insulation 22(2): 979-988.
- Meyer LH, Jayaram SH, Cherney EA (2005) A novel technique to evaluate the erosion resistance of silicone rubber composites for high voltage outdoor insulation using infrared laser erosion. IEEE Transactions on Dielectrics and Electrical Insulation 12(6): 1201-1208.
- Schmidt LE, Kornmann X, Krivda A, Hillborg H (2010) Tracking and erosion resistance of high temperature vulcanizing ATH-free silicone rubber. IEEE Transactions on Dielectrics and Electrical Insulation 17(2): 533-540.
- Du B, Xu H (2014) Effects of thermal conductivity on dc resistance to erosion of silicone rubber/BN nanocomposites. IEEE Transactions on Dielectrics and Electrical Insulation 21(2): 511-518.
- Kumar R, Gupta N (2015) Tracking and surface degradation of barium titanate filled silicone rubber nanocomposites. CEIDP 495-498.
- Ghunem RA, Jayaram SH, Cherney EA (2015) Suppression of silicone rubber erosion by alumina trihydrate and silica fillers from dry-band arcing under DC. IEEE Transactions on Dielectrics and Electrical Insulation 22(1): 14-20.
- ; Zhou W, Wang C, Ai T, Wu K, Zhao F, et al. (2009) A novel fiber-reinforced polyethylene composite with added silicon nitride particles for enhanced thermal conductivity. Composites Part A: Applied Science and Manufacturing 40(6-7): 830-836.
- Khan H, Amin M, Alia M, Iqbal M, Yasin M (2017) Effect of micro/nano- SiO2 on mechanical, thermal and electrical properties of silicone rubber, epoxy and epdm composites for 2 outdoor electrical insulations. Turk J Elec Eng & Comp Sci 25: 1426-1435.
- (2010) Standard practice for rubber and rubber lattices Nomenclature. ASTM International, ASTM D 1418-10a, ed. West Conshohocken, USA, p.
- Khan H, Amin M, Ahmad A (2017) Multistress accelerated aging and tracking/erosion-resistance investigation of high voltage polymeric insulators. Arabian Journal for Science and Engineering 42(12): 51015120.
- Khan H, Amin M, Ahmad A, Yasin M (2017) Erosion/tracking resistance investigation of micro/nano-SiO2 filled RTV-SiR composites for outdoor High Voltage insulations. 14th IBCAST, pp. 15-19.
- (2015) Standard test methods for vulcanized rubber and thermoplastic elastomers-tension. ASTM International, ASTM D 412-15a, ed. West Conshohocken, USA, p. 14.
- Ahmed SSNK, Raza NZ, Shirin K (2012) Cure characteristics mechanical and swelling properties of marble sludge filled EPDM modified choloprene rubber blends. Advances in material physics and chemistry 2: 90-97.
- (2010) Standard test method for rubber property-Durometer Hardness. ASTM International, ASTM D 2240-10, ed. West Conshohocken, USA, p.
- (2004) Standard test method for liquid contaminant, inclined plane tracking and erosion of insulating materials. ASTM International, ASTM-D2303, ed. West Conshohocken, USA, p. 11.
- Kumagai S, Yoshimura N (1999) Influence of single and multiple environmental stresses on tracking and erosion of RTV silicone rubber. IEEE Transactions on Dielectrics and Electrical Insulation 6(2): 211-225.
- Ghunem RA, Jayaram SH, Cherney EA (2014) Investigation into the eroding dry-band arcing of filled silicone rubber under DC using wavelet- based multiresolution analysis. IEEE Transactions on Dielectrics and Electrical Insulation 21(2): 713-720.
- Ismail NN, Ansarifar A, Song M (2014) Effect of hybrid reinforcement based on precipitated silica and montmorillonite nanofillers on the mechanical properties of a silicone rubber. Polymer Engineering & Science 54(8): 1909-1921.
- Rahmat M, Hubert P (2011) Carbon nanotube-polymer interactions in nanocomposites: a review. Composites Science and Technology 72(1): 72-84.
- Ghunem RA, Jayaram SH, Cherney EA (2013) Erosion of silicone rubber composites in the AC and DC inclined plane tests. IEEE Transactions on Dielectrics and Electrical Insulation 20(1): 229-236.
© 2017 Hidayatullah Khan, et al. This is an open access article distributed under the terms of the Creative Commons Attribution License , which permits unrestricted use, distribution, and build upon your work non-commercially.
 a Creative Commons Attribution 4.0 International License. Based on a work at www.crimsonpublishers.com.
Best viewed in


.jpg)


 Editorial Board Registrations
 Submit your Article
 Refer a Friend
 Advertise With Us
.jpg)


.jpg)


.bmp)
.jpg)
.png)
.jpg)


.jpg)


.png)

.png)


.png)


