- Submissions

Full Text
Research & Development in Material Science
Thermal Analysis of Oil Pipeline Coatings
Mumtaz Mirza M1*, Elansezhian Rasu1 and Anjali Desilva2
1Department of Mechanical & Industrial Engineering, Caledonian College of Engineering, Oman
2School of Engineering & Built Environment, Glasgow Caledonian University, UK
*Corresponding author: Mumtaz Mirza M, Department of Mechanical & Industrial Engineering, Caledonian College of Engineering, Seeb, CPO 111, Oman
Submission: September 10, 2017; Published: October 17, 2017

ISSN : 2576-8840Volume1 Issue4
Abstract
The research paper focuses on oil pipe lines used in desert region of Oman that is exposed to very high ambient temperature affects the coating properties resulted in brittleness in coatings. The impact of high ambient temperature is analyzed through heat transfer rate and thermal stress. Two coatings are considered, commercially available fusion bonded epoxy (FBE) coating and experimentally developed electroless nickel phosphorous (EN-P) composite alloy coating. Simulation is done under three ambient conditions, morning at 308K, mid-day at 328K and evening when temperature was around 313K along with crude oil temperature of 343K. Thermal analysis demonstrates that at high ambient temperature EN-P composite alloy coating has low heat transfer rate as compared to FBE coating and its thermal efficiency was around 96% against uncoated pipe and around 69.4% less as compared to FBE coating. The lower the heat flow, the more effective the insulation and it improves the stability of the coating. On the other hand, as the heat flow increases, the insulation is more pronounce to thermal expansion due to high thermal stress behavior. In this scenario, EN-P composite alloy coating is more sensitive as compare to FBE coatings and thus it becomes more pronounce towards stress corrosion cracking (SSC). The impact of thermal stress has significant effect on structural strength and stability, potentially causing cracks or breaks within certain components. Such failures compromise the overall design of the structure, which can lead to possible weakening and deformation at high ambient temperature.
Keywords: High ambient temperature; Thermal analysis; FBE coating; EN-P composite alloy coating; Thermal stress; Heat transfer rate; Stress corrosion cracking
Introduction
Figure 1: Bath tub model; life cycle of SSC growth in pipelines [1].
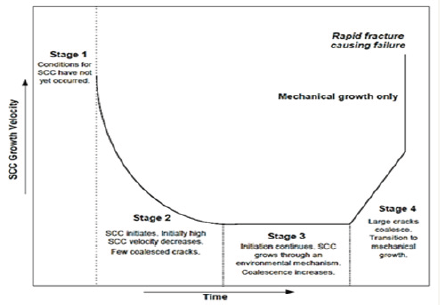
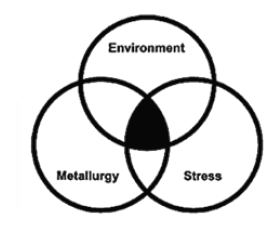
The oil pipe lines in Oman are unprotected to high ambient temperature that disturbs the coating properties. Losses original properties and oxidation would take place on the outer surface of the pipe lines. Results in corrosion that develops on pipe line surface. Moreover, insufficient coating performance also contributes to stress corrosion cracking (SSC) that develops due to stress generation and form cracks on the surface [1]. Life cycle of SSC is shown in Figure 1 in three stages. First stage is development of favorable conditions to SCC followed by the crack “initiation” stage. These cracks then continue to grow and merge, while additional crack initiation also occurs in stage 3. Finally, in stage 4, large cracks amalgamate and failure occurs. Same is explained in Figure 2 like tensile stress higher then threshold stress; material vulnerable to SSC and cracking environment [2].
Figure 2: Conditions for SSC [2].
At present, the steel pipes used in Oman oil industry are made of low alloy steel ASTM A106B [3] varies from 305mm to 1219mm. Oil pipelines used in Oman are coated with two types of FBE coatings applied on the external and the internal surface of pipelines [4,5]. The external surface is coated with two layers FBE system as shown in Figure 3 in which the FBE coating material is coated above the base during manufacturing process. The exposed coat of FBE is applied during the melt stage of the first coating [6]. Threelayer external pipe-coating system utilizes FBE as the primary corrosion coating. The sandwich coating is made of polyolefin. An intermediate adhesive layer of modified polyolefin bonds the epoxy to the polyolefin. The top coat is unmodified polyolefin which is compatible with the intermediate polyolefin as shown in Figure 3. A three-layer coating is a good selection, if the operating temperature is above 110 0C. 3 LPE coating as shown in Figure 4 comprises of:
Figure 3: Two layers of FBE coating [6].
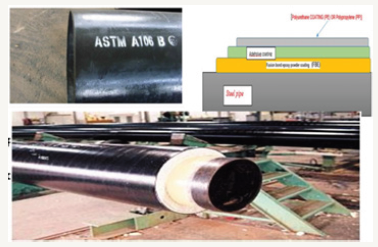
Figure 4: Three layers of FBE coating [6].

a. Anti-corrosion coating: 350mm (14mil) nominal FBE
b. Insulation: 50mm minimum polyurethane foam
c. Outer jacket: 2.5mm (100mil) minimum PE tape and extruded PE
The internal surface of pipelines is also coated with FBE coating with the thickness of above four hundred microns. The main advantage of FBE coating on the inside surface not only provides protection against corrosion, but it will also help in smooth flow of oil.
Electro less Nickel Phosphorous (EN-P) coating is a technique of depositing a noble metal (from its salt solution) on a catalytic active surface of a less noble metal by employing a suitable reducing agent (RA) without using electrical energy. The added RA causes the reduction of the metallic ions to metal, which eventually gets plated over the catalytically activated surface giving a highly uniform, but thin coating. Thus [7]:
Metal Ions + RA → Metal + Oxidized products
The mechanism of the EN-P deposition reactions takes place in the hypophosphite bath. In EN plating, the metal source is a soluble Nickel salt which is in terms of NiCl2. During redox reaction, the Ni ion becomes Ni metal and the Cl2 is wasted as salt solution. In the reaction, RA is Sodium Hypophosphite NaPO2H2 is the sodium salt that contributes Phosphorous better against corrosion in the medium range [8]. Nano additives from the oxide group added in the bath at its best concentration value, it improves the mechanical and physical properties of the EN-P coating. The Nano additives sits in the molecular gap of the coating thus attempts to stop the infiltration of the corrosion.
Methodology
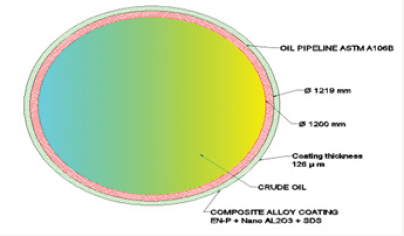
The simulation paper focuses on the performance of EN-P composite alloy coating based on thermal transit analysis in comparison with FBE coating by keeping the thermal input configuration same. The simulation uses ANSYS APDL 18.1 as computational software for analysis. Keeping in view the software limitations, an appropriate coating thickness of 10mm is considered on ASTM A106B substrate. The comparative results focus on two analyses (Figure 5):
Figure 5: Cross sectional view of oil pipeline simulated.
a. Heat transfer rate at three different temperatures
b. Thermal stress at three different temperatures.
Based on the inputs, a fair comparison between the EN-P coating and the FBE coating at three different ambient temperatures with average relative humidity of 60 to 65% and wind speed of 3 to 5m/s is analyzed [9]. Moreover, the crude oil temperature is considered as 20 °C at the inlet and 70 °C in the full section of the pipeline. The conditions are shown in Table 1.
Table 1: Temperature inputs and total heat generation calculated.

Crude oil properties
Table 2: Measured density data (10-3 x Kg m-3) for crude oil samples at different locations [11].

Refer Table 2 [10] physical properties of five samples from five different locations in Oman are considered [11] to undermine the simulation process. The sample properties are from Erad, Oman Export, Receive line, Mabruk and Zal-41. It is observed that the lightest crude oil is from Zal 41 (lightest crude) and heaviest crude oil is from Erad (heaviest crude). Full flow of crude oil is assumed inside the oil pipe through forced pumping with transient behavior of oil flow.
Oil pipeline material
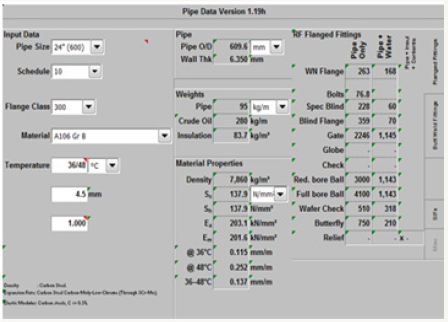
ASTM A106 B low alloy steel is selected for simulation that has been used in Oman oil industry. Pipe line size of 609.6 mm is considered with different properties as shown in Figure 6 [12].
Figure 6: Pipeline information received through courtesy of CC energy development
EN-P composite alloy coating properties
Density of EN-P (EN-P +NanoAl2O3+SDS) composite alloy coating
Weight of coating against 20x20x0.126mm3=50.4mm3 (volume).
Weight of coating=2.98gms
Density of composite coated material=2.98/50.40=0.0592gms/ mm3
Thermal conductivity of the coated sample
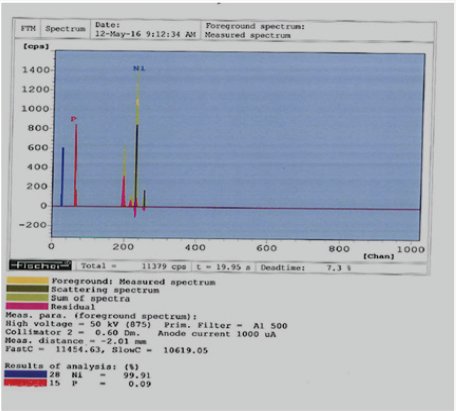
To identify the thermal conductivity of the coated sample, refer Figure 7 through X-ray diffraction,
Figure 7: XRD of EN-P composite alloy coating.
The percentage of various elements of the coating stands as follows:
a. Nickel-99.91 %
b. Phosphorous-0.09 %
Nano Al2O3 sits in the gap of Nickel structure; its presence does not have much impact as indicated in the XRD results. From the above analysis and for simulation purpose, summarizing physical properties shown in Table 3 [13-17]:
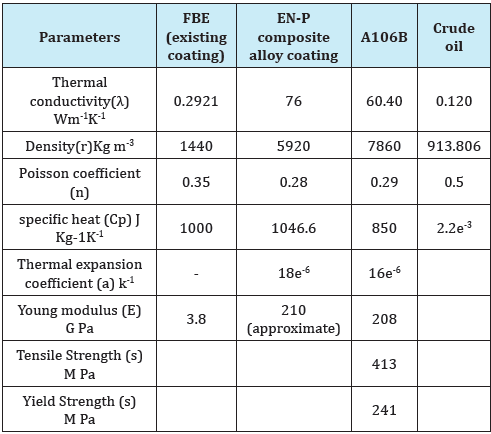
Table 3: Physical properties of the coated samples/crude oil.
Pipe line support
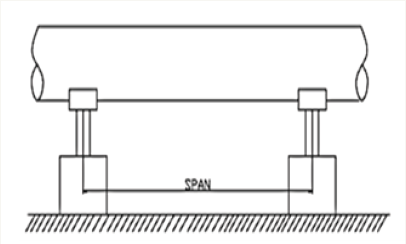
Pipe line supports are meant to hold pipelines to avoid piping stresses and leakage at the joints. Supports for piping must be considered not only to avoid sag in the pipeline within the desired limits, but also to avoid excessive bending stresses. To calculate the maximum span of length for the pipeline considered for simulation Figure 8 [17] bending stress formula with deflection is used.
Figure 8: Straight pipe resting on two supports [18].
Calculations
Maximum bending stress (N/m2)
Sb=(0.0624 w L2 + 0.1248 wc L) D/I
Maximum deflection (m)
y = 5wL4 + 8wcL3/384 EI
Where
w = Uniform distributed weight in N/m
wc = Concentrated weight on pipeline in N
L = Span length in m
D = Outside diameter of oil pipe
E = Modulus of elasticity of pipe material in N/m2.
I = Moment of inertia of pipe in m4.
Maximum bending stress of pipe can be taken as 30% of allowable stress [18].
The calculated deflection value should be less than L/600 to confirm the calculated span of length against safe deflection [19].
Calculations
Total weight=Dead weight+Load weight
Now Dead weight
Dead weight=Weight of pipe+weight of crude oil+weight of insulation (inside and outside surface of pipe)
Weight of pipe ASTM A106B [20] = 89Kg/m = 872.79N/m
Weight of crude oil [20] (Erad at 20 °C)=5901N/m
Weight of FBE insulation- internal and external against 600μm [19] = 7.7 x 10⁻³N/m
Dead Weight = 872.79+5901+7.7x 10-3=6773.79N/m
Load weight
As per ASME B31.4 2012 for liquid pipelines against pipeline diameter of 914.4mm with thickness of 8mm for ASTM A106 B and 6mm for FBE, Pi=4M Pa.
Convert into F = Pi x Area of cross section=4x106x(0.894)2xπ/4
F = 2.5M N/m
Allowable shear stress for ASTM A106B=137.89MPa [18]
Maximum bending stress can be taken as 30% of allowable shear stress [16]
Therefore Sb=0.3x137.89=41.36M Pa
Moment of inertia for oil pipe [21]
I=1.174x10⁻⁴ m4
Since the pipe is not considered to carry flanges it will not considered to carry wc.
Put all the values in maximum bending stress equation Sb
Considered outside diameter of oil pipe=920.4mm
Therefore L=3.54m≈4m
Now maximum deflection will be
y = 5 w L4/384 EI
Put all the values we get
y = 9.45x10⁻⁴m ≈ 0.945mm
With L/600=4/600=6.66mm
With deflection value of 0.945mm is less than 6.66mm; therefore deflection of pipeline is safe against 4m length of pipe line in between supports.
Computational analysis assumptions
ANSYS 18.1 APDL is used to simulate the oil pipeline using transit state thermal analysis. The ANSYS framework and methodologies for thermal analysis in transient flow is done with following task:
For pipeline
Outer Radius = 0.305m (Figure 6)
Inner Radius = 0.298m
For EN-P / FBE coating
Outer Radius = 0.315m (Figure 6)
Inner Radius = 0.305m
Based on the ANSYS APDL 18.1 requirement for thermal analysis, the pipeline considered is dependent on the dimensional inputs reflected and the properties for the ASTM A106 grade B pipe line values are taken from Table 3. Keeping in view the software limitations, a coating thickness of 10 mm with physical properties as discussed in section 2-3 are considered. The input values like thermal conductivity, specific heat, thermal expansion coefficient, Young modulus and poisons ratio values are considered from Table 3.
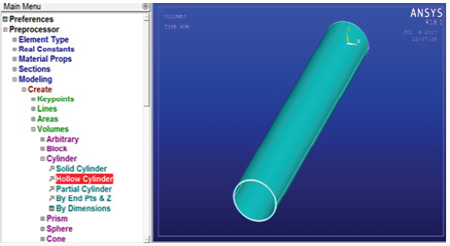
Based on the assumptions a pipe length of 4m is considered as shown in Figure 9.
Figure 9: Hollow pipe line with EN-P coating.
Meshing
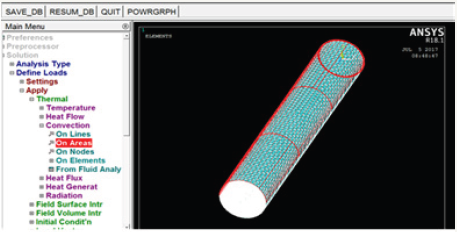
Using meshing attributes and mesh tool of the software fine mesh is developed on the hollow pipe as shown in Figure 10.
Figure 10: Meshing of the hollow pipe.

Heat Transfer Rate Evaluation
Inputs for heat transfer evaluation
Preferences: Thermal Analysis with transient condition
Preprocess: Element type - Solid (brick 8 node 278)
Units: SI, meters
Material properties: Material model based on thermal conductivity Wm-1K-1, Specific heat J Kg-1K-1 and density kgm-3 (Table 3).
Meshing: Fine mesh based on 100mm extruded length of the hollow pipe (due to software limitations).
Thermal load: Inside pipe surface temperature starts at 20 0C (293K), in the middle 70 0C (343K) (Table 1).
Pipe dimensions considered: 0.293m internal diameter, 0.305m outer diameter, EN-P insulation thickness internal diameter 0.305m, external diameter 0.325m (Figure 6).
Temperature input considerations: Three different ambient temperature zones along with crude oil temperature as indicated in Table 3.
Output for heat transfer evaluation
Output considerations: Heat transfer rate against EN-P coating and for FBE coating for three different temperature zones are calculated and compared. Based on heat transfer rate thermal performance efficiency of the two coatings is calculated.
Preprocessor: Modeling a hollow pipe of ASTM A106 B was developed over it EN-P coating was generated with fine mesh of size 4 and 3.
Solution:
Analysis type > transient;
Define load > Apply > temperature (inside pipe 293K at the start and 343K overall length);
Define load > Apply > convection > outside temperature ambient 328 K. (Figure 11)
Figure 11: Convection properties of the hollow pipe.
Solution for EN-P Coating (Figure 13-19)
Morning temperature zone: Based on the simulation at morning temperature zone (Figure 11 & 12) can easily present how the heat will flow from inside the crude oil temperature to outside temperature of 40 °C. Figure 12 shows that how the surface temperature reaches 343K and balances the inside temperature of the crude oil. Heat generated at morning zone=117.09Wm-2.
Figure 12: Thermal variation at morning time.
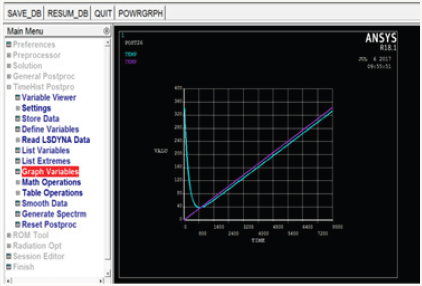
Figure 13: Total heat generation at morning time. Heat generated at morning zone=117.09Wm-2.
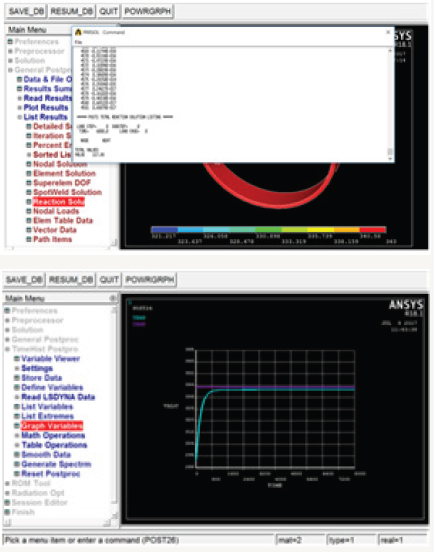
Figure 14: Total heat generated in Wm-2 during mid-day. Heat generated at morning zone=16.509Wm-2.
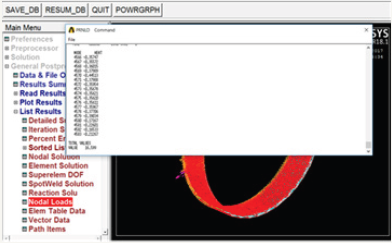
Figure 15: Total heat generated in Wm-2 at evening time. Heat generated at morning zone=62.361 Wm-2

Figure 16: Total Heat generated for FBE coating at morning time. Total heat generation=128.89Wm-2.
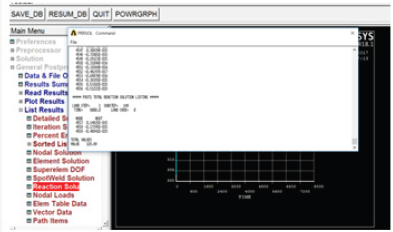
Figure 17: Total Heat generated for FBE coating at mid-day time. Heat generated at mid-day zone=58.407Wm-2.

Mid-day temperature zone: Heat generated at mid-day zone=16.509Wm-2.
Evening temperature zone: Heat generated at morning zone=62.361Wm-2.
Thermal performance efficiency of the coating
Thermal performance efficiency of the coating can be calculated using following formula [22].
ηth ≡ Thermal performance efficiency of the coating;
Figure 18: Total heat generated in Wm-2 at evening time. Heat generated at evening zone=67.09 Wm-2.
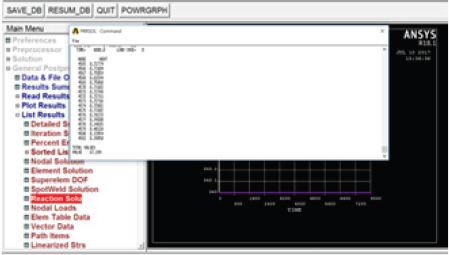
Figure 19: Total Heat generated without insulation. Total heat generated without insulation=408.17Wm-2.
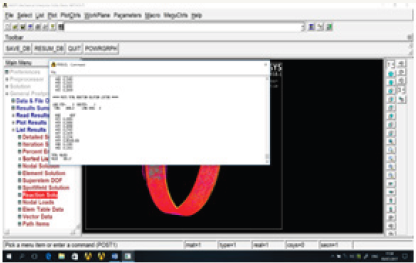
Table 4: Thermal performance of the coatings.

ηth = (Uncoated pipe heat flow- coating heat flow)÷Uncoated pipe heat flow.
Table 4 and consider uncoated pipe heat flow as 408.17W as shown in Figure 20.
Figure 20: Comparative performance of EN-P/FBE coatings.
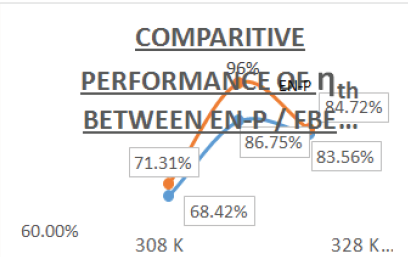
Thermal performance efficiency coating for EN-P coating can be estimated against uncoated pipe and FBE coated pipe for three temperature zones (Table 4, Figure 20).
Thermal Stress Evaluation
Inputs for thermal stress evaluation
Preferences: Thermal Analysis with transient condition
Preprocess: Element type - Solid brick (8 node 77)
Element behavior-Axisymmetric -based on Von Misses criteria.
Units: SI, meters.
Material properties: Material model based on thermal conductivity Wm-1K-1, Specific heat J Kg-1K-1, density kg m-3, young’s modulus in Pa and Poisson’s ratio (Table 3).]
Meshing: Fine mesh based on 100mm extruded length of the hollow pipe (due to software limitations).
Thermal load: Inside pipe surface temperature- at the start 20 °C (293K), in the middle 70 °C (343K) refer Table 4.
Pipe dimensions considered: 0.293m internal diameter, 0.305m outer diameter, EN-P insulation thickness internal diameter 0.305m, external diameter 0.325m (Figure 6).
Temperature input considerations: Three different ambient temperature zones on the insulated surface are considered in simulation with reference to the Figure 9. Similarly, for oil pipe inside temperature are considered refer Figure 6, Erad Oman pumping station crude oil values.
Solution
Based on heat transfer rate input and linking the *.rth file with the structural analysis, thermal stress on the EN-P/FBE coated surface can be analyzed. Out of the three temperature zones the most vulnerable coated surface is at mid-day temperature zone of 55 °C results are presented as under (Figure 21-23).
EN-P/FBE coated samples: Thermal stress at mid-day for EN-P coating (328K ambient temperature).
Max thermal stress generated for EN-P coating at node number 379 is 0.2222 E009.
Figure 21: Thermal stress at mid-day temperature zone for EN-P coating. Max thermal stress generated for EN-P coating at node number 379 is 0.2222 E009.
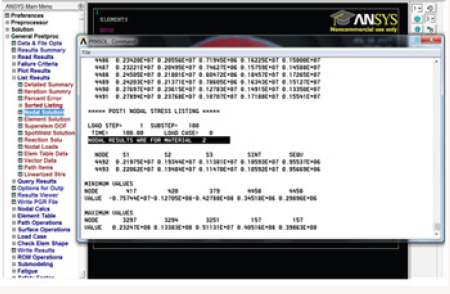
Figure 22: Thermal stress at mid-day temperature zone for FBE coating. Max thermal stress generated for FBE coating at node number 3297 is 0.2324 E08.
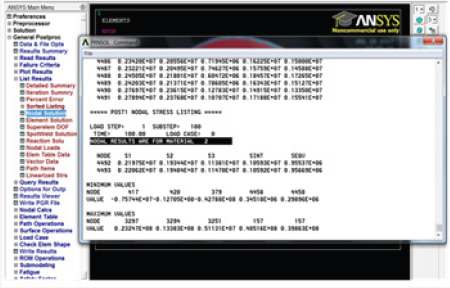
Figure 23: Thermal stress at mid-day temperature zone for uncoated coating. Max thermal stress generated for uncoated pipe at node number 262 is 0.2927 E08.

Max thermal stress generated for FBE coating at node number 3297 is 0.2324 E08.
Max thermal stress generated for uncoated pipe at node number 262 is 0.2927 E08.
Comparative performance of Thermal stress: To have comparative performance of EN-P/FBE coating at 328K mid- day temperature.
Conclusion
(Table 4 & 5), following results can be drawn:
a. Simulation was done in three steps, first under EN-P coating with substrate ASTM A106 B low alloy steel. Second with FBE coating with same substrate and lastly substrate only. All the three conditions simulated against with three types of ambient conditions i.e. morning when temperature was around 308K, mid-day when temperature was around 328K and evening when temperature was around 313K. Besides this, the crude oil temperature considered at the inlet was around 293K and later it reached around 343K.
Table 5: Comparative performance of thermal stress on coatings.

b. Two types of thermal behaviors were studied mainly heat transfer rate from the substrate to the coating and later thermal stress for each case. EN-P coating has low heat transfer rate as compared to other coatings and its coated thermal efficiency was around 96% against uncoated pipe and around 69.4% less as compared to FBE coating. The lower the heat flow, the more effective the insulation and therefore improves the stability of the coating. However, on the other hand, as the heat flow increases the insulation is more pronounce to thermal expansion.
c. Coating works as solid material experiences an increase in temperature, the volume of the structure is ultimately impacted by increasing a phenomenon known as thermal expansion. This process, results from heat’s ability to increase a material’s kinetic energy. Within solids, molecules are typically located near one another, contributing to the defined shape of the structure. As the temperature rises, molecules begin to vibrate at a more rapid speed and push away from one another. This increased separation between the individual atoms causes the solid to expand, thus increasing the volume of the structure. With this volumetric enlargement, the elements of a solid undergo greater levels of stress.
d. Thermal stresses can have a significant effect on a structure’s strength and stability, potentially causing cracks or breaks within certain components. Such failures compromise the overall design of the structure, which can lead to possible weakening and deformation.
e. Thermal stress in case of EN-P coating is more pronounced than FBE or uncoated surface. Based on Von Misses criteria, thermal stress at a node has more value than other nodes. The variation in stress condition from maximum to minimum at a node for EN-P coating is around 189M Pa which is appreciably quite high as compared to FBE coating that is around 22.9M Pa and for uncoated that is around 28.15M Pa. Through simulation, it proves that stress corrosion cracking (SSC) is more pronounce towards EN-P coating as compare to FBE coating.
f. Due to limited capabilities of the software some limitations on the dimensions are taken care off. However, while considering the EN-P coating physical properties, Ni alloy physical properties are assumed to be considered because of the reason 99.14% of Nickel is available in the EN-P+ NanoAl2O3+surfactant confirmed under XRD test (Figure 7).
Acknowledgement
The authors would like to oblige Glasgow Caledonian University U.K., Caledonian College of Engineering Oman, Sultan Qaboos University Oman and Indian Institute of technology Madras India for providing laboratory facilities, technical advice and suggestions and financial assistance under staff development program of Caledonian College of Engineering Oman.
References
- Parkins RN (1987) Current Topics in Corrosion: Factors Influencing Stress Corrosion Crack Growth Kinetics. Corrosion 43(3): 130-139.
- Michael Baker (2004) Understanding Stress Corrosion Cracking in pipe lines.
- Popoola L, Grema A, Latinwo G, Gutti B, Balogun A (2013) Corrosion problems during oil and gas production and its mitigation. Int J Ind Chem 4(1): 35.
- Crude oil properties are collected from CC energy development, Farah Station. Muscat, Oman.
- Kehr JA, Enos DG FBE, a Foundation for Pipeline Corrosion Coatings.
- Muscat May Weather (2016) Accu Weather Forecast for Masqat Oman.
- Jain & Jain (2009) Engineering Chemistry. (15th edn), Dhanpat Rai Publishing Company, Delhi, India.
- Weil R, Parker K The Properties of Electroless Nickel.
- Rahman SMM (2014) Velocity Profiles for Flow of Omani Crude Oils and Other Liquids. SQU J Sci 19(1): 87-94.
- Scotchkote TM (2013) Fusion Bonded Epoxy Coating.
- Kundua S, Kalyan S (2014) The engineering properties of Electroless Nickel coatings. Procedia Engineering 97: 1698-1706.
- Nickel-Properties, Fabrication and Applications of Commercially Pure Nickel.
- Zhou G, Ding H, Zhang Y (2008) Structure and Mechanical Properties of Ni-P-Nano Al2O3 Composite Coatings Synthesized by Electroless Plating, J Iron Steel Res Int 15(1): 65-69.
- Vakharia DP, Farooq M (2009) Determination of maximum span between pipe supports using maximum bending stress theory. Int J Recent Trends Eng 1(2).
- Dhinakaran R, Elansezhian R, Lalitha AA (2013) Effect of nano additives with surfactant on the surface characteristics of electroless nickel coating on magnesium-based composites reinforced with MWCNT. Advances in Tribology 2013 (2013): Article ID 315965.
- Shalaby HM, Lowther M, Al-Hashem, Al-Besharah J (1996) Industrial Corrosion and Corrosion Control Technology. 2nd Arab Corrosion Conf, pp. 16-17.
- The Engineering Science of Oil Pipelines. Sci media Cent Canada.
- Sorensen PA, Kiil S (2009) Anticorrosive coatings: a review. J Coatings Technol Res 6(2): 135-176.
- Yuan K (2013) Thermal and Mechanical Behaviors of High Temperature Coatings.
- ASTM A106 Pipe Specifications American Piping Products (2017) American Piping Products Inc., USA.
- PDO (2014) Petroleum Development Oman, magazine Almanhal.
- Kundu S, Das SK, Sahoo P (2014) Properties of electroless nickel at elevated temperature-a review. Procedia Eng 97: 1698-1706.
© 2017 Mumtaz Mirza M, et al. This is an open access article distributed under the terms of the Creative Commons Attribution License , which permits unrestricted use, distribution, and build upon your work non-commercially.
 a Creative Commons Attribution 4.0 International License. Based on a work at www.crimsonpublishers.com.
Best viewed in


.jpg)


 Editorial Board Registrations
 Submit your Article
 Refer a Friend
 Advertise With Us
.jpg)


.jpg)


.bmp)
.jpg)
.png)
.jpg)


.jpg)


.png)

.png)


.png)


