
- About Us
- Information
-

The Author ensures that the research has been conducted responsibly and ethically with adherence to all relevant regulations. read more..
- For Authors
- For Reviewer
- Manuscript Guidelines
- Membership
- Publication Ethics
-
- Journals
- Reprints
- e-Books
- Videos
- Policies
- Contact Us
 COVID-19
- Submissions


Full Text
Polymer Science: Peer Review Journal
Effect of Polystyrene Molecular Weight on PVDF/PS Morphology and Properties
Ali Akbar Yousefi* and Masud Salavati
Department of Plastic Engineering, Faculty of Polymer Processing, Iran Polymer and Petrochemical Institute, Iran
*Corresponding author:Ali Akbar Yousefi, Department of Plastic Engineering, Faculty of Polymer Processing, Iran Polymer and Petrochemical Institute, P O Box 14965-115, Tehran, Iran
Submission: May 15, 2024;Published: July 24, 2024
ISSN: 2770-6613 Volume5 Issue4
Abstract
Addition of 4 different polystyrenes (PS) with various molecular weights to PVDF matrix has been studied. Morphology of samples were studied by Scanning Electron Microscopy (SEM) and crystallinity of samples were tested using FTIR. Melt viscosity and mechanical behavior were examined using rheometric and tensile was applied to study mechanical properties. All mechanical properties except Young’s modulus deteriorated in composites for low compatibility between them. SEM micrographs revealed a dispersed shape for the minor phase of no regular geometrical shape. FTIR spectra showed increase in β phase crystals upon addition of PS up to 39% compared to that of the neat PVDF. The rheological behavior was rather unusual and showed PS with mediocre storage and loss modulus has higher β phase crystal content compared to highest storage and loss modulus PS.
Keywords:Polyvinylidene fluoride; Polystyrene; Blend; Morphology; Rheology; Mechanical properties
Introduction
Poly (Vinylidene Fluoride) (PVDF) is a semi–crystalline thermoplastic fluoropolymer with a wide range of applications, due to its unique properties such as chemical, heat, oxidation, and UV stabilities. PVDF exhibits five distinct crystalline phases (α, β, γ, δ and ε phase), with the α being non-polar and β phase being a need for the polymeric material’s piezo, pyro-, and ferroelectric characteristics [1-8]. Regarding applications in sensors and actuators, the piezoelectric effect of the β phase domain is appealing. It is critical to eliminate the use of lead and to encourage weight reduction when substituting elements like lead zirconate titanate in order to monitor the health of composite structures and produce smart materials, among other applications [9].
The non-polar PVDF α phase contain largest portion of crystals in common PVDF through market. Additional process steps, such as high-pressure treatment, annealing, ultra-rapid cooling, mechanical stretching of PVDF, electrospinning, or crystallization from solution, are needed to obtain PVDF with significant fractions of β phase material. Furthermore, adding fillers to the PVDF melt or solution promotes the creation of the β phase [10-16]. Similarly, it has been shown that formation of PVDF domains in β phase is favored in the presence of a second polymer in a composite or block copolymer [17]. Various crystallization processes from the solvent or from the melt were reported to enhance the β phase fraction of PVDF in composites with, for example, PMMA or PS. Because PVDF and PMMA have significant intermolecular interactions, PMMA and PVDF are macroscopically miscible in the melt over the whole composition range [2,18]. Since PVDF and PMMA establish hydrogen bonds, PMMA and PVDF are macroscopically miscible in the melt over the whole composition range. The interactions between the CF2 and CH2 of PVDF and PMMA, respectively, are expressed by the Flory-Huggins parameter of χ12=0.125 and are strong interactions. However, in PVDF and PS have of χ12=0.01 which is lower than that of PMMA and by Flory-Huggin’s interpretation must have better interactions than of PMMA [19,20].
There were cases that explored the use of PVDF/PS membrane for various applications, they concluded use of PS in PVDF matrix can improve porosity, surface hydrophilicity, hydration capacity and protein and bacterial absorption [21-24]. Cao et al. [25] studied the effect of hybrid fillers (multiwalled carbon nanotubes/silicon carbide MWCNT/SiC) and their localization on PVDF/PS composites. They concluded adding hybrid fillers would reduce size of PVDF phase significantly and increase electrical resistivity of composite. Consequently, by carefully locating the fillers in a desired phase, it is feasible to lower the percolation threshold and create composites with high thermal conductivity that are electrically insulating [25]. Zhao et al. [26] investigated the localization of Carbon Black (CB) in PVDF/PS composite and its effect on dielectric properties of the composite. The composite prepared using an internal mixer in 190 °C and 150rpm for different time spans. In localization of CB in PVDF in PVDF/PS, dielectric constant was higher than that of localization of PS in same composite and the dielectric constant of ternary mixture was in middle of those dielectric constants of localization of CB in PS and CB in PVDF [26].
Shao et al. used ternary mixture of High-Density Polyethylene (HDPE) /PVDF/PS prepared by melt mixing and studied changes in their morphology. They observed, there are three phases to stable morphology as a function of mixing time, a significant number of PS was initially encapsulated by HDPE, which can be attributed to the low interfacial tension between PS and HDPE. Next, the entire number of PS migrated to the interface of PVDF and HDPE, which may have been caused by the high shear stress. Finally, a portion of PS migrated to HDPE phase, and that is the stable morphology [27]. Sultana et al. [27] investigated electromagnetic interference shielding effectiveness (EMI SE) of MWCNT/PS/PVDF nanocomposite with different process methods and compositions. This work finds that, because EMI SE scales linearly with complex permittivity, complex permittivity is the critical element to produce larger EMI SE in mix nanocomposites. In terms of electrical characteristics, it has been found that PVDF/MWCNT nanocomposite is superior to PS/MWCNT. However, we are able to produce 70:30 PS/PVDF/MWCNT mix nanocomposites at a significantly reduced cost employing a unique processing method (premixing MWCNT in PS). Composite nanocomposite’s increased EMI SE is ascribed to multiple scattering caused by selective localization and improved MWCNT dispersion in one phase [28]. Liu et al. [28] observed the changes in dielectric and morphology of barium titanate BT/ graphene nanoplatelets GNP/PS/PVDF composites. Consequently, the macro layer structure and spatial continuous structure are built utilizing the GNP-formed micro electric container structure in the matrix. The dielectric characteristics are enhanced, and a good prediction of the dielectric constant is also obtained, thanks to the synergistic action of conductive filler and dielectric 42 filler [29].
Golzari et al. [30] investigated adding a second polymer by creating block co-polymers, In order to determine the sort of crystalline phase that formed, block copolymers of Polyvinylidene Fluoride (PVDF) with either styrene or Methyl Methacrylate (MMA) were created and examined. Iodine transfer polymerization was used to create PVDF with iodine end groups (PVDF-I), either in an emulsion or in solution with supercritical CO2. The results of the experiments that follow clearly demonstrate that, in the case of block copolymers, the initial crystalline phase of PVDF-I is transformed into the crystalline phase. Only phase material was found for ratios of the VDF block length to the MMA block length ranging from 1.4 to 5 [30]. It is evident that distinct crystalline and super-molecular structures may be observed in PVDF/PMMA mixes, depending on the content, crystallization period, and temperature. By using X-ray diffraction and infrared spectroscopy, it has been shown that blending with PMMA occasionally causes the crystalline p modification to partially crystallize. The relative quantity of this modification grows as the PMMA level rises. Alpha and beta modifications must both be present in equal proportions in blends with 20 weight percent PMMA, while the beta modification may predominate at higher PMMA content levels [31].
In this work we study of the molecular weight of PS on crystallinity and rheological behavior of PVDF/PS composites and study morphological changes with PS content in addition to mechanical properties of aforementioned composites.
Experimental
Materials
PS 1028, PS 1038, PS 1047 and PS 1077 with MFI of 2.4, 3.1, 4.2 and 7g/10min at 200 °C and 5kg load was provided kindly by Petro Paak PVDF, Hylar 460 was purchased from Solvay (South Korea) with density of 1.75g/cm3 and Hardness of 80 shore D.
Sample preparation
PVDF and PS were weighted and blend ed into an internal mixer for 10min at 60rpm and 230 °C then they were formed into desired shaped via compression molding using (Mini test press, Toshiko, Japan). The nomenclature of composites is shown in Table 1.
Table 1:Nomenclature of blends.

FTIR spectroscopy
A Bruker FT-IR spectrophotometer (Equinox model, Germany) in ATR mode was employed to obtain IR spectrum of films and to calculated beta crystal content of the samples.
Scanning Electron Microscopy (SEM)
The Vega model scanning electron microscope, produced by Teskan in the Czech Republic, was utilized in this study to examine the microstructure of polypropylene and the nanocomposites made from it. This particular type of microscope can apply up to 30Kv of voltage, which is utilized to accelerate the electron and increase its energy. The samples were initially shattered in liquid nitrogen for this test.
Tensile test
At a temperature of 230 degrees Celsius, a press machine was used to create dumbbell samples. A SANTAM machine with an extensometer was used to assess the stress versus strain test at room temperature. 13mm was the gauge length, while 5mm/min was the tension speed. Each dumbbell is 25 and 2mm in length and breadth, respectively and has a 1mm thickness. It was carried out in accordance with ASTM D638.
Rheometry
The Polymer and Petrochemical Research Institute’s Dynamic Rheometric System (RMS), model 501 MCR by Paraphysical, was used to analysis the materials’ rheological behavior and viscoelastic characteristics. The figure shows an illustration of this gadget. At 140 °C, all measurements were made. Parallel plates with a 25mm diameter were employed in these experiments, and in each test, the gap between the two plates was 1mm. The linear viscoelastic area of the molten polymer, which was measured by measuring the linear region in the melt elastic modulus test against varied strain, was used for rheological experiments. The tests can be repeated in this location since the imposed strain is low enough to have no impact on the material’s rheological behavior.
Gel permeation chromatography (GPC)
GPC chromatogram of the virgin polymers was obtained using an Agilent-1100 series chromatograph at room temperature. A 1wt % solution of polymer was made in Tetrahydrofuran (THF) and tested at 1ml/min flow rate.
Result and Discussion
Gel permeation chromatography (GPC)
GPC results are shown in Table 2 and later would be used to interpret crystallinity and mechanical results.
Table 2:GPC results for different polystyrenes.

Mechanical properties
Mechanical properties are shown in Table 3 and Figure 1 shows SEM images of samples with 20% polystyrene and various melt index inside a PVDF matrix. To etch the dispersed phase, in this case polystyrene, from the continuous phase, all the samples were first etched in toluene solvent. Every sample often exhibited matrix droplet behavior. whereas samples PVPS 38-20 and PVPS 77-20 have larger droplets, samples PVPS 28-20 and PVPS 47-20 have smaller droplets. Finally, sample 20-77 has a more uniform morphology than sample 20-38 and the matrix forms smaller droplets, it is in agreement with their molecular weight and expected. Regarding the tension at the breaking point, the samples PVPS 28-20 and PVPS 47-20, which contained smaller droplets in the matrix, had a tension of 4%, whereas the tension of the samples PVPS 38-20 and PVPS 77-20, which have a more non-uniform morphology. They had 6 and 5% respectively. The modulus of the samples also shows a behavior similar to the tensile strength at the point of failure. The difference of modulus of the samples with smaller droplets in the matrix is higher than that of the samples containing larger droplets. The modulus of samples PVPS 28- 20 and PVPS 47-20 is 12.8 and 12.11MPa, respectively, and the modulus of samples 20-38 and 20- 77 is 8.66 and 9.38MPa, respectively. The smaller the droplet size, the higher the contact surface between the droplet and the matrix, and as a result, the mechanical properties are higher.
Table 3:Mechanical properties of the blends.

Figure 1:a) PVPS 28-20 b) PVPS 38-20 c) PVPS 47-20 d) PVPS 77-20.

Figure 2:a) PVPS 28-20 b) PVPS 28-30 c) PVPS 28-40 d) PVPS 28-50 blends.

Figure 2 is related to the SEM micrographs of samples containing 28wt% styrene with different percentages of 20, 30, 40 and 50 in the PVDF matrix. As in the previous step, all the samples were first etched by toluene solvent to separate the dispersed phase of polystyrene from the continuous phase. According to the pictures, the most uniform morphology with the smallest size of scattered droplets is observed in the 20% sample. As the percentage of polystyrene increases, the homogeneity of the morphology decreases and the size of the droplets increases, and in the 40% sample, the morphology gradually changes from the matrix drop to two continuous phases or very large droplets are formed. The reason for this is that these two polymers are immiscible and form a weak interface with each other [29]. To strengthen this interfacial region, it is better to use a compatibilizer.
The tensile properties of the considered polymer composites are given in Table 3. The highest tensile strength is related to the 0% sample, whose value is 21.86MPa. As the percentage of polystyrene in the mixture increases, the tensile strength decreases. The tensile strength of the sample containing 50% polystyrene with a 38% decrease reaches to 13.63MPa. As mentioned in the morphology section, the mixture of these two immiscible polymers is not compatible with each other and as a result, the tensile strength will decrease with increase in the percentage of dispersed phase. This is also true for the tension at the breaking point and the highest tension belongs to the 20% sample with a 4% increase in length. After that, the sample containing 30% polystyrene shows a length increase of 2.95% and finally, the samples with 40% and 50% polystyrene in the PVDF matrix have a length increase of 1.34% and 1.37% respectively. The addition of different nanoparticles to the PS and PVDF matrix has been mentioned in the references to reduce elongation to tear [32,33].
According to the obtained results, the modulus of the samples does not show much dependence on the composition of the percentage of styrene in the mixture and is in the range of 12 to 12.8GPa. Since the modulus of pure polystyrene is 34.8 and the modulus of pure PVDF is 11.86, as the amount of polystyrene in the samples increases, the modulus of the samples should also increase. However, due to the small compatibility between the two phases, this does not happen, and the modulus remains almost constant [34,35]. the rest of samples followed the same patterns and shown same behavior with increasing styrene content.
Crystallinity
Table 1, the degree of crystallinity of alpha and beta phases in samples containing PVDF is shown. The amount of beta type crystals is calculated from formula 1 [36].
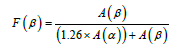
In the above formula, A(α) shows the absorption rate at the peak of 763cm-1, A(β) shows the absorption rate at 840cm-1, and F(β) shows the percentage of beta crystal (Table 4). Figure 3 show the ATR spectroscopy spectrum for different samples. In these images, the alpha peaks cm-1 (531, 614, 763,796 and 976) and the beta peaks cm-1 (511 and 840) are in Figure [37].
Table 4:β phase crystal content of prepared samples.

Figure 3:FTIR graphs of PS 1028 with PVDF and neat PVDF.

The peaks in this range are used to determine the relative percentage of crystalline phases. As it was mentioned before, the amount of beta phase is effective in determining the piezoelectric behavior of the polymer and increasing the amount of beta phase increases the piezoelectric behavior of the material. But it is never mentioned in the references that there is a direct relationship between these two. But the mechanical process of stretching the samples turns the alpha phase into beta, and this change is well visible in the infrared spectra [38-40].
Rheological properties
Table 5 shows power-law parameters and crossover point and slope of storage modulus in plateau region
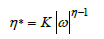
In this formula K and η are power-law constant and ω is frequency.
Table 5:Flow parameters of the blends.

By checking (Figure 4), it is possible to check the mixed viscosity and storage modulus for sample 1028. In this diagram, by adding polystyrene to PVDF, it causes the chains to slide, and the chains rotate more easily on each other, and ultimately reduces the friction between the PVDF chains. As a result, the modulus of the chain and composite should be reduced because of softening in the PVDF chains [41-43]. It can be seen in (Figure 4) that the polymer composites follow the same process. The samples with polystyrene 1028 have the best performance in storage and mixed modulus, and then 1047 performs better among the polystyrenes. This is in agreement with their molecular weight.
Figure 4:Storage and loss modulus of PVDF with PS 1028 composites with different percentage.

Conclusion
In this research work, by adding PS to PVDF with various molecular weight, the piezoelectric properties were measured in relation to the Rheology and β phase crystals of the PVDF. In this research, the samples were mixed and prepared in an internal mixer at a temperature of 230 °C and 60rpm for 15 minutes. The Young’s modulus did not change significantly in the PS/PVDF composite samples, but the tensile strength and elongation at break were clearly reduced, which indicated the incompatibility of the two polymers, and this did not change significantly with the change in molecular weight, although in the weight Lower molecular weight showed better mechanical properties.
In the crystallization study of the prepared sample, the best performance in the formation of the beta phase and the percentage of the beta phase belonged to the mixture containing PS 1047, which has a lower molecular weight than PS1028, which can indicate the slowing down of the chain movement in very high molecular weights. In the rheological studies, Power-law constant in PVPS 28-20 is the closest to pure PVDF, but overall, this number has decreased in all composites. After the mentioned mixture, the lowest Power-law constants belong to PVPS 47-20 and PVPS 47-30 which have shown highest crystallinity between samples prepared which shows higher viscosity to some degree helps creation of β phase crystals.
References
- Kostov GK, Sauguet L, Ameduri B, Kaspar H, Zipplies T, et al. (2010) Radical copolymerization of vinylidene fluoride with 1‐bromo‐2, 2‐difluoroethylene. Journal of Polymer Science Part A: Polymer Chemistry 48(18): 3964-3976.
- Ameduri B (2009) From vinylidene fluoride (VDF) to the applications of VDF- containing polymers and copolymers: Recent developments and future trends. Chemical Reviews 109(12): 6632-6686.
- Taguet A, Ameduri B, Boutevin B (2005) Crosslinking of vinylidene fluoride-containing fluoropolymers. Crosslinking in Materials Science 184: 127-211.
- Scheirs J (1997) Modern fluoropolymers: High performance polymers for diverse applications. Polymer Science & Technology General.
- Lang SB, Muensit S (2006) Review of some lesser-known applications of piezoelectric and pyroelectric polymers. Applied Physics A 85(2): 125-134.
- Wang S, Qi L (2018) Design, synthesis and processing of PVDF‐based dielectric polymers. IET Nanodielectrics 1(2): 80-91.
- Ameduri B, Sawada H (Eds.), (2016) Fluorinated polymers: volume 1: synthesis, properties, processing and simulation. Royal Society of Chemistry, UK.
- Martins P, Lopes AC, Lanceros-Mendez S (2014) Electroactive phases of poly (vinylidene fluoride): Determination, processing and applications. Progress in Polymer Science 39(4): 683-706.
- Lederle F, Cathrin H, Beuermann S (2020) Inducing β phase crystallinity of PVDF homopolymer, composites and block copolymers by anti-solvent crystallization. Journal of Fluorine Chemistry 234: 109522.
- Doll WW, Lando JB (1970) The polymorphism of poly (vinylidene fluoride) IV. The structure of high-pressure-crystallized poly (vinylidene fluoride). Journal of Macromolecular Science, Part B 4(4): 889-896.
- Hattori T, Masashi K, Hiroji O (1996) Improved piezoelectricity in thick lamellar β‐form crystals of poly (vinylidene fluoride) crystallized under high pressure. Journal of Applied Physics 79(4): 2016-2022.
- Pan H, Bing N, Ruihua L, Chun L, Jie Z, et al. (2012) Polar phase formation in poly (vinylidene fluoride) induced by melt annealing. Journal of Polymer Science Part B: Polymer Physics 50(20): 1433-1437.
- Gradys A, Sajkiewicz P, Adamovsky S, Minakov A, Schick C (2007) Crystallization of poly (vinylidene fluoride) during ultra-fast cooling. Thermochimica Acta 461(1-2): 153-157.
- Yang D, Chen Y (1987) β-phase formation of poly (vinylidene fluoride) from the melt induced by quenching. Journal of Materials Science Letters 6(5): 599-603.
- Eugenia B, Türk M, Beuermann S (2009) Effect of polymer properties on poly (vinylidene fluoride) particles produced by rapid expansion of CO2+ polymer mixtures. The Journal of Supercritical Fluids 48(1): 48-55.
- Wolff S, Jirasek F, Beuermann S, Türk M (2015) Crystal phase transformation of α into β phase poly (vinylidene fluoride) via particle formation caused by rapid expansion of supercritical solutions. RSC advances 5(82): 66644-66649.
- Hari Singh N (1995) Ferroelectric polymers: chemistry: physics, and applications. CRC Press, USA.
- Sylvie P, Avignon-Poquillon L, Levesque G (2002) Calorimetric study of fluorinated methacrylic and vinyl polymer composites: part 2: correlation between miscibility, chemical structure and χ12 interaction parameter in binary systems. Polymer 43(11): 3295-3302.
- Eugene H, Tagami Y (1996) Theory of the interface between immiscible polymers. J Polym Sci Part B: Polym Phys 34(12): 1947-1952.
- Bo L, Lamnawar K, Maazouz A, Zhang H (2016) Revealing the dynamic heterogeneity of PMMA/PVDF composites: from microscopic dynamics to macroscopic properties. Soft Matter 12: 3252-3264.
- Venault A, Yi-Hung L, Jia-Ru W, Hui-Shan Y, Chang Y, et al. (2014) Low-biofouling membranes prepared by liquid-induced phase separation of the PVDF/polystyrene-b-poly (ethylene glycol) methacrylate composite. Journal of Membrane Science 450: 340-350.
- Guang-Ming Q, Li-Ping Z, Bao-Ku Z, You-Yi X, Guang-Liang Q (2008) Grafting of styrene/maleic anhydride copolymer onto PVDF membrane by supercritical carbon dioxide: Preparation, characterization and biocompatibility. The Journal of Supercritical Fluids 45(3): 374-383.
- Shobana KHM, Suresh Kumar K, Radha S, Mohan D (2012) Preparation and characterization of PVDF/PS composite ultrafiltration membranes. Scholarly Journal of Engineering Research 1(3): 37-44.
- Roshani R, Fatemeh A, Peyravi M, Jahanshahi M (2018) Highly permeable PVDF membrane with PS/ZnO nanocomposite incorporated for distillation process. RSC advances 8(42): 23499-23515.
- Cao J, Zhao J, Zhao X, You F, Yu H, et al. (2013) High thermal conductivity and high electrical resistivity of poly (vinylidene fluoride)/polystyrene composites by controlling the localization of hybrid fillers. Composites Science and Technology 89: 142-148.
- Xiaodong Z, Zhao J, Cao J, Wang X, Chen M, et al. (2013) Tuning the dielectric properties of polystyrene/poly (vinylidene fluoride) composites by selectively localizing carbon black nanoparticles. The Journal of Physical Chemistry B 117(8): 2505-2515.
- Sultana SM, Shital Patangrao P, Kamkar M, Sundararaj U (2020) Tailoring MWCNT dispersion, composite morphology and EMI shielding properties by sequential mixing strategy in immiscible PS/PVDF composites. Journal of Electronic Materials 49(3): 1588-1600.
- Liu J, Mingting Z, Lizhu G, Chunfeng W, Lei S, et al. (2021) Preparation of BT/GNP/PS/PVDF composites with controllable phase structure and dielectric properties. Polymer Testing 100: 107236.
- El Achaby M, Arrakhiz FZ, Vaudreuil S, Essassi EM, Qaiss A (2012) Piezoelectric β-polymorph formation and properties enhancement in graphene oxide-PVDF nanocomposite films. Applied Surface Science 258(19): 7668-7677.
- Golzari N, Adams J, Beuermann S (2017) Inducing β phase crystallinity in block copolymers of vinylidene fluoride with methyl methacrylate or styrene. Polymers 9(8): 306.
- Tashiro K, Nalwa HS (1995) Ferroelectric polymers. Marcel Dekker Inc, pp. 233-259.
- Rostampour A, Sharif M, Mouji N (2017) Synergetic effects of graphene oxide and clay on the microstructure and properties of HIPS/graphene oxide/clay nanocomposites. Polymer-Plastics Technology and Engineering 56(2): 171-183.
- Cao Y, Zhang J, Feng J, Wu P (2011) Compatibilization of immiscible polymer composites using graphene oxide sheets. ACS Nano 5(7): 5920-5927.
- Yang J, Feng C, Dai J, Zhang N, Huang T, et al. (2013) Compatibilization of immiscible nylon 6/poly (vinylidene fluoride) composites using graphene oxides. Polymer International 62(7): 1085-1093.
- Ye S, Cao Y, Feng J, Wu P (2013) Temperature-dependent compatibilizing effect of graphene oxide as a compatibilizer for immiscible polymer composites. RSC Advances 3(21): 7987-7995.
- Ali Akbar Y (2011) Influence of polymer blending on crystalline structure of polyvinylidene fluoride. J Iran Polym Sci and Tech 20(2): 109-121.
- Li Y, Zhang G, Song S, Xu H, Pan M, et al. (2017) How chain intermixing dictates the polymorphism of PVDF in poly (vinylidene fluoride)/polymethylmethacrylate binary system during recrystallization: A comparative study on core-shell particles and latex blend. Polymers 9(9): 448.
- Lauchlan L, Rabolt JF (1986) Polarized Raman measurements of structural anisotropy in uniaxially oriented poly (vinylidene fluoride)(Form I). Macromolecules 19(4): 1049-1054.
- Khomami B, McHugh AJ (1988) Processing-property interactions in poly (vinylidene fluoride). I. An analysis of melt stress history in an extensional flow geometry. Journal of applied polymer science 36(4): 859-876.
- Khomami B, McHugh AJ (1988) Processing-property interactions in poly (vinylidene fluoride). II. Morphology and property characterization of extruded films. Journal of Applied Polymer Science 36(4): 877-889.
- Salimi A (2012) Characterization of nano scale adhesion at solid surface of oxidized PP wax/PP blends. International Journal of Adhesion and Adhesives 33: 61-66.
- Souza AMC, Demarquette NR (2002) Influence of composition on the linear viscoelastic behavior and morphology of PP/HDPE composites. Polymer 43(4): 1313-1321.
- James EM (2007) Physical Properties of Polymers Handbook, pp. 445-452.
© 2024 Ali Akbar Yousefi. This is an open access article distributed under the terms of the Creative Commons Attribution License , which permits unrestricted use, distribution, and build upon your work non-commercially.
Editor In Chief


.jpg)


Signup for Newsletter

Quick Links
 Editorial Board Registrations
 Submit your Article
 Refer a Friend
 Advertise With Us
Our Recent Edition

.jpg)


Top Editors


.jpg)


.bmp)
.jpg)
.png)
.jpg)


.jpg)


.png)

.png)


.png)


Financial Support

Sponsors

Latest e-Books

Latest Video

 a Creative Commons Attribution 4.0 International License. Based on a work at www.crimsonpublishers.com.
Best viewed in
a Creative Commons Attribution 4.0 International License. Based on a work at www.crimsonpublishers.com.
Best viewed in