
- About Us
- Information
-

The Author ensures that the research has been conducted responsibly and ethically with adherence to all relevant regulations. read more..
- For Authors
- For Reviewer
- Manuscript Guidelines
- Membership
- Publication Ethics
-
- Journals
- Reprints
- e-Books
- Videos
- Policies
- Contact Us
 COVID-19
- Submissions


Full Text
Peer Review Journal of Solar & Photoenergy Systems
Quantitative Evaluation of the Infrastructure for the Conversion of 1.2 Billion Vehicles to Green Hydrogen
Alfred Rufer*
EPFL Swiss Federal Institute of Technology in Lausanne, Switzerland
*Corresponding author: Alfred Rufer, EPFL Swiss Federal Institute of Technology in Lausanne, Switzerland
Submission: December 25, 2023;Published: January 22, 2024
Volume2 Issue4 January 22, 2024
Abstract
The conversion of the world vehicle park to Green Hydrogen appears as an interesting possibility to suppress one of the most important source of CO2 emissions in the actual problematic situation of the climate change. Green Hydrogen propulsion supposes an electric drive system powered from a fuel cell, itself fed from a hydrogen reservoir. The green nature of the used hydrogen means not hydrogen produced from fossil resources, but a production of this hydrogen based on water electrolysis where the electric power comes from renewable sources as photovoltaics or wind. Such an interesting system, however, must be evaluated from the quantitative point of view, considering the basic infrastructure needed. The considered amounts of energy at different levels of comparison are evaluated, as the power amount to be installed for the yearly production of the consumed quantity of hydrogen. The paper evaluates also the needed quantity of water consumed by the electrolysers. Finally, the infrastructure of the needed PV power plant is estimated, in its design, but also in the problematic of its establishment meaning the needed time to produce the amount of PV panels by a realistic PV industry.
Introduction
In the context of the problematic situation of the global warming, different solutions are proposed for the reduction of the CO2 emissions of automotive transportation means. Individual personal vehicles are concerned as also public transportation or even freight transport on road. Till today the automotive industry has followed the fast evolution of the battery technology regarding the acceptable energy density and can produce full electric vehicle solutions with a sufficient possible range. This solution, however, is confronted with the difficulty to charge the batteries with a high power level, corresponding to a high range-flowrate [1]. Fast charging processes, even if the battery cooling has done significant progresses, are indisputably bound to limited efficiency [2]. A highly interesting solution for zero-emissions vehicles is the Hydrogen propulsion system based on an electric motorization fed from a fuel cell, itself powered from a pressured hydrogen tank [3]. The question addressed in this study is the quantitative implications of a hypothetic conversion process where most of the autonomous vehicles world-wide would be transformed into green-hydrogen powered ones. The analysis begins with an evaluation of the different amounts of energy at different levels of the powering chain, in comparison to classical Diesel-powered ICE’s. Then, the calculation goes further for the evaluation of the needed amount of hydrogen for an equivalent powering of the same vehicle fleet.
The production of this amount of hydrogen through electrolysers is then evaluated, also the amount of the needed mass of water to be electrolyzed. The electric power source, namely an equivalent ultra-large photovoltaic plant in his global surface is analysed. The interesting question of producing the powering infrastructure is addressed in an evaluation of the needed time to produce the PV panels by a realistic producing industry. Figure 1 shows the two systems which are compared, namely a propulsion chain using Diesel ICE (Internal Combustion Engine) and a fuel-cell hydrogen powered vehicle. The first line shows the elements of the ICE system with the annual energy needed at the wheels En_ann_wheels and the corresponding energy in the form of the consumed fuel annually En_ann. On the second line, the fuel-cell/hydrogen solution is represented. From the same value of the annual wheel energy as was calculated for the Diesel version, the amount of hydrogen energy is indicated En_ann_H2, as the corresponding mass of hydrogen M_ann_H2. Regarding the needs of the fuel-cell system, the mass of water and the quantity of electrical energy are indicated. To simplify the evaluation, the energy efficiency of the power electronic converters are not considered explicitly, but are integrated in the efficiencies of the electrolyser and of the fuel cell.
Figure 1:Comparison of systems Fuel-Cell versus Diesel ICE.

Yearly Needs of Energy in the World for the Autonomous Vehicles
In references [4,5], it is stated that for a conversion of 1.2 billion vehicles to green hydrogen, only 4 times the actual annual production (50 Million of tons) of hydrogen would be needed (200 Million of tons). The first evaluation made in this paper tries to verify this affirmation by comparing the consumption of such vehicles with conventional Diesel ICE vehicles.
Yearly consumption of diesel fuel in the world
As was indicated in the introduction, the world-wide fleet of vehicles is estimated to 1.2 billion units. For the estimation of the related fuel consumption, a travel distance of 15’000km per year and per vehicle is considered, with for each unit a consumption of 8 l/100km.
On the base of this data, the volume of annually consumed fuel is estimated as
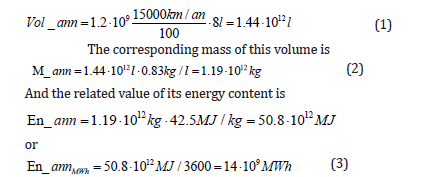
This energy consumed by all the vehicles is defined at the level of the fuel tank. One can estimate the real propulsion energy which is defined at the level of the wheels.

where the factor of 0.15 is the value of the « tank-to-wheels » efficiency of a vehicle driven by an Internal Combustion Engine (ICE) according to Table 1 [6].
Table 1:Efficiency of a vehicle driven by an ICE or by an electric drive [5].

Equivalent energy and mass of hydrogen
For a propulsion system converted to fuel-cell and hydrogen, the demand of energy and the corresponding mass of the gas can be evaluated by a back calculation from the estimated value « at the wheels » calculated through rel. (4). The amount of hydrogen needed at the entry of the fuel-cell is obtained with a value of the efficiency of the new propulsion system of 0.36. This value comprises the electric motor, the power electronics converter, the standby and driveline losses (η=0.72, see Table 1) and the fuel-cell itself (η=0.5) as represented in Figure 2. The energy equivalent value of the annually consumed hydrogen is calculated through (5)
Figure 2:

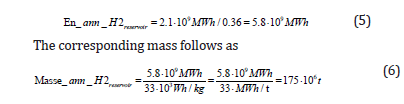
This value confirms the indicated amount of 4 times the today’s consumption of 50 Million tons of hydrogen. The difference can be assimilated to a different number of yearly covered kilometrage and to the fuel consumption of the considered cars.
Electrical Energy and Infrastructure
Electrical energy needed for the electrolysis
The amount of electrical energy needed for the electrolysis of the water to produce the amount of hydrogen is calculated with a global efficiency of η=0.45. This value comprises the electrolyser itself (η=0.5), and the installation for the compression to a high pressure of 700 bar (η=0.9). Included is also the efficiency of the power electronics converter used for the control of the current in the electrolyser and for the optimisation of the operating point of the solar panels (MPPT, Maximum Power Point Tracking). Again, the annual energy quantity is evaluated as it was for the previous quantities.

This energy should be produced by a hypothetic gigantic photovoltaïc power plant, or by several large size plants spread over the world. The goal of the present calculation being to set in evidence the quantitative aspect of the substitution process globally. An equivalent size of such an infrastructure is calculated in the following section.
Floor space required for the electric power production
The estimation of the required floor space of the PV infrastructure is done on the base of a yield value per hectare. The example of the large PV plant of Agua Caliente in the United Stated of America gives the value of
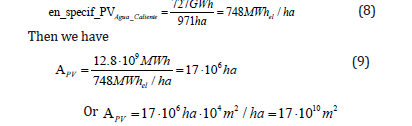
This surface corresponds to a square area of an edge equal to

Such a surface is represented for comparison in red on the map given in Figure 3.
Figure 3:Compared surface of a PV infrastructure needed to power the water electrolysis for the production of 188 million of tons of hydrogen yearly.

Mass of water needed for the electrolysis
The quantity of water consumed by the electrolysis is another important parameter of the alternative process of the hydrogen propulsion. This quantity can be evaluated using a factor of the mass ratio obtained by considering the respective atomic masses of the oxygen and of the hydrogen. The values of the atomic masses are inserted into the equation of the chemical transformation of the water into oxygen and hydrogen, namely
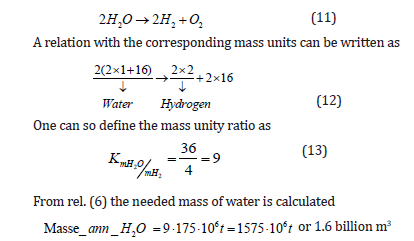
The question of available water in such an amount is addressed, and the solution could be found by desalination of sea water.
Industrial Production of the Needed PV Panels
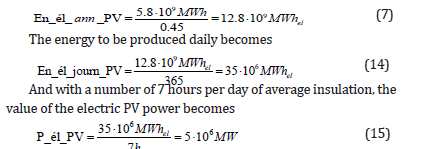
Another challenge of the conversion of the world’s fleet of vehicles to hydrogen is the industrial production of the equipment needed. The production time for the needed PV panels is evaluated in this section, on the base of the value of the power to be installed. This value of power is estimated in considering the uniform repartition over the world and over the seasons of the solar irradiation. It is of evidence that this assumption will give a nonaccurate result, but the order of magnitude can be established. Regarding the PV earnings over the day, a uniform value of the earnings is considered, with an average value of 7 hours per day.
The needed annual electric energy to be produced by the PV panels has been calculated in rel. (7). From this value, the average power is estimated through the day energy and the irradiation hours.
The annual PV energy was calculated in (7)
For a more realistic estimation of the value of power to be installed, a calculation with several different references is possible. Table 2 shows 5 different references of PV installations in different countries and along different latitudes. The indicated ratios vary between 0.98GWh/MW and 2.5GWh/MW [7-9]. For an estimation in the context of the present study, a value of 2GWh/MW is chosen.
Table 2:Energy-to-power ratio of different PV installations.

With the calculated amount of yearly needed electrical energy in rel. 7, and with an hypothetic ratio of 2GWh/MW the power to be installed becomes

The question is now what time would be necessary to produce the PV panels necessary for the power given by rel. (16).
The base of the estimation will be the information on the today’s production of PV panels by the 10 major manufacturers in the world (status 2021). The values of the delivered total power of the modules are indicated in Table 3, together with the company name and the country of origin. This table shows the fast growing of the PV panel production between 2017 and 2021. The rate of growing is supposed to be maintained in the next years, but only a part of the PV panel production can be dedicated to the hypothetic conversion to hydrogen. The production time is then estimated on the base of the year production of 2021.
Table 3:Power of the panels delivered by the 10 main manufacturers.

An estimation of the production time is made in rel (17) which would also correspond to the minimum value of the time to realize a conversion of the world automotive park to a carbon free hydrogen propulsion.

To the production of the PV panels, the production of the electrolysers is another challenge, together with the production of the associated power electronic converters. Further the pressure of the hydrogen gas must be elevated to a high value of 700bar, and this represents another industrial challenge. Not only compression stages but also high-pressure reservoirs should be produced.
Conclusion
The conversion of the world’s fleet of vehicles (1.2 billion) to green hydrogen propulsion is an immense challenge. Such a conversion would mean that around 175 millions of tons of hydrogen should be produced yearly. To produce this amount of hydrogen, a hypothetic ultra-large PV power plant is to be installed. To reach the annual average of this production, the PV power plant to be installed represents an equivalent surface of a square of 412km of edge. The time to produce such an infrastructure is further estimated. Based on the annually produced power of PV panels by the ten most important producers, the production time is estimated to be more than 25 years.
References
- Hõimoja H, Vasiladiotis M, Grioni S, Capezzali M, Rufer A, Püttgen HB (2012) Toward ultrafast charging solutions of electric vehicles, CIGRE 2012, Paris.
- Rufer Alfred (2018) Energy storage-systems and components, CRC Press, Florida, USA.
- Naylor SM, Pickert V, Atkinson DJ (2006) Fuel cell drive train systems -- Driving cycle evaluation of potential topologies,2006 IEEE Vehicle Power and Propulsion Conference, Windsor, UK
- The Future of Hydrogen Seizing today’s opportunities, Report prepared by the IEA for the G20, Japan.
- Pierre-Alexandre Sallier (2019) Hydrogen car: What if this time it was different? Le Matin Dimanche.
- Devin Serpa, Tank-to-wheel efficiency, After Oil EV.
- Solar energy in Italy. Wikipedia.
- Solar hot water project.
- Solar power plant.
© 2024 Alfred Rufer. This is an open access article distributed under the terms of the Creative Commons Attribution License , which permits unrestricted use, distribution, and build upon your work non-commercially.
Editor In Chief


.jpg)


Signup for Newsletter

Quick Links
 Editorial Board Registrations
 Submit your Article
 Refer a Friend
 Advertise With Us
Our Recent Edition

.jpg)


Top Editors


.jpg)


.bmp)
.jpg)
.png)
.jpg)


.jpg)


.png)

.png)


.png)


Financial Support

Sponsors

Latest e-Books

Latest Video

 a Creative Commons Attribution 4.0 International License. Based on a work at www.crimsonpublishers.com.
Best viewed in
a Creative Commons Attribution 4.0 International License. Based on a work at www.crimsonpublishers.com.
Best viewed in