
- About Us
- Information
-

The Author ensures that the research has been conducted responsibly and ethically with adherence to all relevant regulations. read more..
- For Authors
- For Reviewer
- Manuscript Guidelines
- Membership
- Publication Ethics
-
- Journals
- Reprints
- e-Books
- Videos
- Policies
- Contact Us
 COVID-19
- Submissions


Full Text
Peer Review Journal of Solar & Photoenergy Systems
Theoretical Variations of the Thermal Performance of Solar DHW Systems in Libya
Malek Al Abani*
Institute of Heat Engineering, Warsaw University of Technology, Poland
*Corresponding author: Malek Al Abani, Institute of Heat Engineering, Faculty of Power and Aeronautical Engineering, Warsaw University of Technology, Warsaw, Poland
Submission: June 11, 2021;Published: August 06, 2021

Volume1 Issue5 August, 2021
Abstract
Due to the political conflicts and civil war that has happened in the last 10 years, Libya nowadays facing power cuts for large hours throughout the day, General Electrical Company of Libya GECOL is failing to satisfy the electricity demand. The country’s infrastructure has been damaged and the blockade of the oil refineries weaken the economy. In the meantime, the installation of fossil fuel burning centralized power plants is big challenge. For that, it is no longer possible to postpone the use of alternative energy sources rather than fossil fuel.
Since nearly 90% of the demand in Libya for DHW is covered by electric heating systems, this paper attempts to investigate the use of a solar water heating system in order to alleviate the load on the General Electricity Company. To accomplish this, a detailed TRNSYS simulation of various solar hot water systems was configured, the simulations were performed for a 250L load in a Libyan single-family house. In addition, different combinations of thermal collector /PV/ Thermal storage, were applied on a different system configuration of a typical dwelling in the Western Libyan city of Tripoli. Technical and economical investigation were carried out to contrast between various system combinations. In all three cases a collector array size varied from 3 m2 to 6.96 m2 based on available collectors and PV modules. Annual solar fractions for Thermosyphon, solar thermal, and PV/T systems were 97%, 96%, and 93% respectively.
On top of its social and environmental-friendly advantages, the PVT system is found to be more economical when adopted as a solution as compared to thermal solar collector option, when the electrical energy was used to offset the energy from the auxiliary heater in the storage tank, the annual PV/T solar fraction increased from 93% to 99% during the winter and in the summer season, the solar fraction of the PV/T system was above 100%, indicating more energy than was needed to meet the hot water load was provided from solar sources. The excess electrical energy could be used to meet part of the electricity demand in the house.
The operating cost of each system reflects its performance; confirming that the PV/T operating cost is the lowest of the simulated systems. The difference in operating cost was predicted for the Thermosyphon and Solar thermal systems due the different size in collector area. Specifically, for the 3 m2 Thermosyphon, 4.64 m2 solar thermal and 6.96 m2 PV/T systems, the annual operating costs were $19.7, $21.8, and $1.6. The payback time for thermosyphon system was 2.6 years and is lower compared to those calculated for solar thermal and PV/T systems 8.3 and 9.5 respectively; this is because of its high efficiency and design which eliminate the oversizing of the system and extra electrical components.
Keywords:Electricity shortage; DHW system; Libya; Solar generation; TRNSYS simulation; Primary energy saving PES
Opinion
The shortage of energy supply has become one of the most common issues around the world. The problem has been driven by the growth in living standards and economic development. In buildings sector, energy is used for different purpose such as heating, cooling, ventilation, etc. Buildings sector has a major share among the other sectors in the final energy consumption. Space heating is the most important end-use in the residential sector (68%). The share of space heating represents 60-80% of the total energy consumption. Water heating ranks second with a quite stable share (13%). Electrical appliances are having a greater importance and represent today the 12% (Figure 1). Cooking and lighting represent 5%, 2% of the total consumption [1].
Figure 1:Energy consumption in building sector.

In developing countries, the situation is even worse, water heating energy consumption in Libya represent 30% of the total residential demand [2-5]. Libya is experiencing rapid growth in demand for electricity and potable water. Currently, according to studies, the demand for electricity in Libya will exceed 115 gigawatts by 2030 unless alternative energy is produced and the application of systems to conserve energy sources the country will struggle to cover all its energy need.
The total demand for raw fuel for energy, industry, transport and water will increase by 1,600 one million six hundred thousand barrels per day in 2010 to the equivalent of 3 million barrels per day by 2030 [5]. Due to the political conflicts and civil war that has happened in the last 10 years, Libya nowadays facing power cuts for large hours throughout the day, General Electrical Company of Libya GECOL is failing to satisfy the electricity demand. The country’s infrastructure has been damaged and the blockade of the oil refineries weaken the economy. In the meantime, the installation of fossil fuel burning centralized power plants is big challenge. For that, it is no longer possible to postpone the use of alternative energy sources rather than fossil fuel.
According to the Renewable Energy Authority of Libya, the average brightness of solar energy is about 3200 hours per year. In the same time, the country receives considerable amount of solar radiation every year, about 2200kWh/m2/year. The average daily sunshine duration is about 9 hours. With a high level of solar radiation around 6kWh/m2/day (Figure 2).
Figure 2:Sunshine duration and solar radiation, diffuse radiation-tripoli.

Bearing the previous facts in mind, Libya is an example of a country that is uniquely placed to succeed in developing and supporting renewable energy production. By adopting this strategy Libya could utilize this alternative energy resources to enhance some of its load requirements. which can be contributing to alleviate the problem.
Various available solutions to exploit the energy of the sun, Solar energy collectors are special kinds of heat exchangers that transform solar radiation energy to internal energy of the transport medium. The main component of any solar application is the collector. which absorbs the incoming solar radiation and converts it into heat then transfers the heat to a fluid (air, water, or oil) circulating through the collector. The solar energy collected transfers directly to the domestic hot water or space conditioning equipment via the circulating fluid or to an energy storage tank, from which it can be use at night or on cloudy days.
Solar thermal collectors can be equipped with Photovoltaic module and known as hybrid solar collectors, PV/T collectors convert solar radiation into thermal and electrical energy. PVT collectors combine of PV solar cells, used to convert sunlight into electricity and a solar thermal collector, which transfers the unused heat from the PV module to a heat transfer fluid. By combining, these two technologies overall efficiency can reach a higher than solar photovoltaic or solar thermal alone.
Methodology
The aim of this study is to determine if such systems are viable. In order to achieve the objectives of this study, A comparative analysis of Thermosyphon, solar thermal and PV/T domestic hot water systems was conducted using TRNSYS 18. Parameters such as hot water load and collector area were varied in order to compare their effects on the performance.
The study encompasses energy consumption and solar fraction as performance figures. The meteorological data used from Meteonorm software. Meteonorm is a complete, worldwide climatological database. This software enables data generation for any location in the world. This data can be synthesized in a file compatible with TRNSYS software. The user behaviour factors including hot water load pattern, end user water temperature and total hot water consumption are derived from on-site measurements conducted in previous research in Libyan houses [1,6]. All parameters, considered in this study, are selected based on the optimum sizing for Libyan family.
Domestic Hot Water Profile in Libyan Single- Family Houses
A profile of the domestic hot water load consumption (HWLP) in Libyan single-family houses was created. The profile consists of different draw-offs during the day. This represents the hourly profile described by Widén et al. [3] but scaled to the latest data on the Libyan average hot water consumption of 60 litres per person per day at 45 °C (Table 1). The Typical HWLP for Libyan family illustrated in (Figure 3)
Table 1: Hot water daily demand for a family of four persons in litres per person.

Figure 3:Typical hot water load pattern of Libyan families.

The hot water is assumed to be heated up to 60 °C. The energy demand, D, required for the generation of sanitary hot water can be obtained if the volumetric consumption, V, is known for the required time period. Also required are the temperatures of the cold water supplied by mains, Tm, and the water distributed to load, Tl. Then [7-10],
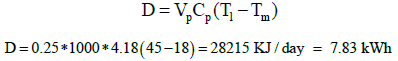
The annual domestic hot water consumption in these houses can be estimated 7.83*365 = 2857.9 kWh/year.
Storage tank: A small (100 to 120 Litres) storage tank is usually sufficient for one to two people. A medium (300 Litres) storage tank works well for three to four people. For active solar water-heating systems, the size of the solar storage tank increases with the size of the collector, typically 50 litres per square meter of collector. This helps to prevent the system from overheating when there is no demand for hot water.
Collector orientation: Collector orientation is important in achieving maximum performance from a solar energy system. In the northern hemisphere, the optimum orientation for a solar collector is to the south. However, recent studies have shown that,depending on the location and collector tilt, the collector can face up to 900 east or west of true south without significantly decreasing its performance. All collectors’ models were oriented to the south [11-15].
Collector tilt: Most solar collectors used in residential applications are flat panels that can be mounted on a roof or on the ground. Typically, they are fixed in a tilted position which correlated to the latitude of the location. This allows the collector to best exposure the sun. These collectors can absorb both the direct beams from the sun and reflected that comes through a cloud or the ground [16-19].
The optimum tilt angle of the collector is equal to the latitude of the location, with angle variations of 100 to 150 more or less, depending on the application [19]. If the application is solar cooling, then the optimum angle is latitude -100 so that the sun will be perpendicular to the collector during summertime, when the energy will be mostly required. If the application is space heating, then the optimal angle is latitude +100; whereas for annual hot water production, it is latitude +50, to have relatively better performance during wintertime, when hot water is mostly required.
Regulations of water heating systems and legionella growth/
Legionella bacteria grow between 20 °C and 50 °C with
maximum growth between 32 °C and 42 °C and it dies above 60 °C
after a period of exposure [13]. Hence, according to the literature
review, the system should be well protected against a dangerous
level of legionella growth:
A. Auxiliary heater set point kept at 60 °C.
B. Hot water temperature available at the higher than 50 °C.
All systems were designed in a way that these requirements are met.
System model: The system models differ from simple connections to more advanced configurations and controls. However, the complexity of the system never increased to a level that would be technically difficult to build in practice. Also, avoid design configurations that would cause any high rise in the investment cost that it would be hardly recouped by the increase in energy savings. Each system model was built by using different component simulation models (TRNSYS types).
For this study, the simulations were run for year-long periods based on weather data imported from Typical Meteorological Year (TMY) data files provided with TRNSYS. Specifications for the PV modules were taken from TrinaSolar’s 60-CELL RESIDENTIAL DD05A.08 module (Trina Solar Ltd) [9], and the solar thermal collector specifications were taken from VITOSOL 200-FM flat plate solar thermal collector manufactured by Viessman (Viessmann Manufacturing Company Inc) [10]. For an effective comparison, the various properties of these panels were combined for the PV/T design. That was achieved by combining the properties of the PV and solar thermal collectors into one TRNSYS module.
The results of the simulation, in terms of the electrical and thermal performance, will be indicted by using different system components Online Plotter Type 65 (Table 2), Printer Type 25 and Quantity Integrator Type 24 (Table 3).
Table 2: Trnsys model used types.

Table 3: System parameters.

Thermosyphon Configuration: A typical thermosyphon system is shown in (Figure 4), heat potable water or transfer fluid and use natural convection to transport it from the collector to storage. With the increase of the temperature the density of the water drops and thermosyphoning effect occurs. Therefore, by the action of solar radiation absorbed, the water in the collector is heated and expands, becoming less dense, and rises through the collector into the top of the storage tank. There it is replaced by cooler water that has sunk to the bottom of the tank, from which it flows down the collector. The phenomena continues as long as the sun is shining. Since the circulating force is just a small density difference, larger than normal pipe sizes must be used to minimize pipe friction. Connecting lines must be insulated well to prevent any heat loss and sloped to prevent formation of air pockets, which would cause stop of the circulation (Figure 4).
Figure 4:Schematic diagram of a thermosiphon solar water heater in TRNSYS.

Solar thermal DHW system: A common design for a Solar Domestic Hot Water (SDHW) system uses a flat plate solar thermal collector to absorb solar radiation and convert it to thermal energy. The heat is then transferred to a hot water tank via a heat exchanger. A back up heater is integrated into the tank to provide necessary heat during times of low solar availability (Figure 5).
Figure 5:Schematic diagram of a solar thermal DHW system in TRNSYS.

The auxiliary heater located at the top portion of the tank, to create stratification. Stratification is a process in which cold water near the bottom of a tank is heated (by a solar collector) and reenters the tank at a higher position. This forms a temperature difference between the top of the tank and the bottom of the tank. For the same average temperature as a mixed tank, a hotter top and colder bottom exists. The result increases solar collector efficiency as the coldest water is sent to the collectors to be heated, and the hottest water is drawn off the top of the tank when needed to meet a load (Figure 6).
Figure 6:Schematic diagram of a solar thermal DHW system in TRNSYS.

PV/T DHW System: A hybrid method of gathering solar energy uses Photovoltaic/Thermal collectors, which combine the PV cells with the absorber plate and heat extraction of a solar thermal collector. The electrical power input to Type 48 is monitored to investigate if the produced electricity is sufficient to be directed to the circulation pump and the auxiliary power unit to supply constant hot water from the tank.
Analysis
The annual solar fraction takes into account the energy to produce the domestic hot water required by the load including losses and necessary energy to run the pump as well as the saved energy by the collectors.
The annual solar fraction used as primary method of comparison. Solar fraction is defined as:
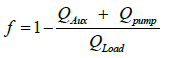
Measure the energy generated, required, and delivered by each system in kWh.
Solar component comparisons using electrical/thermal/total efficiency and Primary Energy Savings (PES) efficiency, these values were recommended by the IEA Task 35 to properly evaluate performance of PV/T systems (Table 4).
Table 4:Performance evaluation equations.

Where ηPV is the efficiency of PV cells, ηth is the efficiency of thermal components, and ηPower is the efficiency of local power plants. Task 35 indicates this value is 36% for non-listed countries [8].
The stationary collector efficiency is expressed as the thermal output of the collector Qgain divided by the irradiance Gt on the collector pane Ac
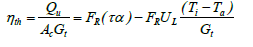
Were,
ηth : Collector efficiency. Qu : Thermal energy collected. Ac :
Collector absorber area (m2).
Gt : Total solar irradiance on the plane of the panel (W/m2). FR
: Collector heat removal factor.
τα : Tau-alpha product of the collector. UL : Collector loss
transfer coefficient (W/m2K).
Ti : Fluid inlet temperature (°C). Cp: Specific heat of the collector
fluid (J/kgK).
•m
: Mass flow rate of the collector fluid (kg/s). Ta : Ambient
air temperature (°C).
When the system includes photovoltaic cells, photovoltaic efficiency defined as:
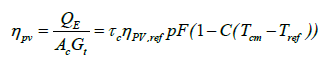
QE : Electrical output of the cells (W) τc : Transmissivity of the glass covers ηPV,ref : Photovoltaic efficiency at Tref Tcm : Mean PV temperature (°C) C : Temperature coefficient of PV cells based on power (K-1) APV : PV area (m2) Tref : Reference temperature for cell efficiency (°C). pF : PV packing factor (pF=APV/Ac)
Economic Analysis
Operating cost
The operation cost for each system calculated by multiplying the summation of auxiliary heat energy and pump energy by the residential electricity rate. In Libya energy prices are subsidized, in which fuel and electricity prices are from the lowest in the world. The current base price of domestic electricity and diesel fuel is 0.02LD/kWh (∼0.12 €/kWh) and 0.15LD per litter (∼0.09 €/L) respectively [11].
Payback time
The payback time is defined in many ways. The most common way is the time needed for the cumulative fuel savings to equal to the total initial investment, i.e., it is the time required to get back the money spent to erect the solar system from the fuel savings incurred as a result of the employment of the system. This can be obtained in two methods (with or without discounting the fuel savings).
In this paper fuel savings are not discounted was considered:
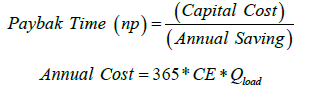
Where:
CE Total Cost.
np Payback Time in years
The total cost of each system was estimated, for thermosyphon DHW system the total cost estimated to be 1000€, for solar thermal collector system we will refer to VITOSOL.DHW SOLAR PACK [14]. A solar package for heating DHW with solar energy, with a dual mode DHW tank, Solar-Divicon, solar control unit, solar collectors and solar components. Vitocell 100-W, type CVSA Floor standing steel DHW tank (260L) with Ceraprotect enamel coating and one indirect coil for heating by solar and one electric heating element. The total cost of the system with solar collector mounting kits for the roof is approximately 3370€ [14].
In the case of PV/T Off-Grid system we should add to the previous estimation an inverter to convert the direct current DC generated by the PV to an alternative current AC, battery bank and charge controller (Regulator) (Table 5).
Table 5:

Result and Discussion
The aim of using SDHW systems is to have a large portion of the hot water load met by the solar components. The PV/T system was configured to provide the best performance based on combined thermal and electrical energy. The results of this analysis differed; with some of the performance criteria favouring the thermosyphon and solar thermal systems while others favour the PV/T system. This was expected for the efficiency calculations, since the solar thermal (only) collectors typically collect more thermal energy than the PV/T collector. However, the PES efficiencies, values and operating costs, both monthly and annual, favoured the PV/T system.
Figure 7:Total energy efficiency.

The simulation was conducted for Tripoli climate in an effort to compare the performance of the three systems studied. In all three cases a collector array size varied from 3m2 to 6.96m2 based on available collectors and PV modules. Annual solar fractions for Thermosyphon, solar thermal, and PV/T systems were 97%, 96%, and 93% respectively (Figure 7). The solar fraction for the PV-T system was notably lower than the other two. This was primarily due to the lower efficiency of the PV array 14%. However, when the electrical energy was used to offset the energy from the auxiliary heater, the annual PV/T solar fraction increased from 93% to 99%.
The solar thermal system outperformed the other designs in total efficiency. However, the PES efficiency of the PV/T collector surpassed that of the solar thermal collector by approximately 12% (Figure 8). The average, maximum, and minimum of these values are provided in Table 6.
Figure 8:Total energy efficiency.

Table 6:Average Energy Efficiency and PES Efficiency values.

When comparing energy provided directly to the hot water tank, it was expected that the PV/T solar fraction would be lower than that of the solar thermal system since the available thermal energy was reduced by the presence of the PV panels (93% compared to 97%) that converted a portion of the incident solar irradiance to electricity rather that heat. In this case, electrical energy provided by the PV/T system is not included in this calculation.
However, when the electrical energy was used to offset the energy from the auxiliary heater, the annual PV/T solar fraction increased and in the summer, the solar fraction of the PV/T system was above 100%, indicating more energy than was needed to meet the hot water load was provided from solar sources. The excess electrical energy could be used to meet part of the electricity demand in the house. Table 4 provides the energy outputs of the systems (Table 7).
Table 7:

The operating cost of each system reflects its performance; confirming that the PV/T operating cost is the lowest of the simulated systems. The difference in operating cost was predicted for the Thermosyphon and Solar thermal systems due the different size in collector area. Specifically, for the 3m2 Thermosyphon, 4.64m2 solar thermal and 6.96m2 PV/T systems, the annual operating costs were $19.7, $21.8, and $1.6.
The payback time for thermosyphon system was 2.6 years and is lower compared to those calculated for solar thermal and PV/T systems 8.3 and 9.5 respectively; this is because of its high efficiency and design which eliminate the oversizing of the system and extra electrical components.
Conclusion
the electrical power grid infrastructure is suffering from several military incursions, missiles and vandalism. That limite the grid’s ability to reliably deliver power and led to recur blackouts and leaving households without electricity for long hours every day. As this electricity crisis does not seem to have an immediate resolution, it is no longer possible to postpone the use of alternative energy sources rather than fossil fuel.
Due to the proven potential of solar energy in Libya, this paper has discussed theoretically different solar water heating systems in Libyan single-family house using the TRNSYS software. A Thermosyphon, solar thermal, and PV/T system were modelled using built-in components in TRNSYS. Actual solar components were simulated to find the system with highest performance. When comparing systems with different collector areas, The PV/T 6.96m2 system gives the highest solar fraction and PES efficiency when the electrical energy was used to offset the energy from the auxiliary heater, comparing to the Thermosyphon 3m2 and Solar Thermal with 4.64m2 collector area. While maintaining a similar energy output, the PV/T has almost no operation costs 1.6 $/year comparing to other systems and more reliable to deliver energy during electricity shortage and blackouts.
Due to the quality of the water in Libya Thermosyphon has limitation of use. As the system is open, extremely hard or acidic water can cause scale deposits that clog or corrode the absorber fluid passages. From the results above the PV/T system can be used to produce domestic hot water and can meet part of daily electrical demand of the household. The system gives high solar fraction and PES efficiency, while maintaining a similar energy output to that of the solar thermal system. The PV/T operation costs are also the lowest of any system. Furthermore, the PV/T options come with security of supply, cleaner environmental footprint, and a greater societal benefit. The latter can be achieved not only from the continuous clean energy supply, but also by maintaining people’s comfort via avoiding the noise accompanying gas-guzzling diesel generators in densely populated townships in eastern and western Libya.
References
- (2013) European Commission. Energy Consumption by End-Use.
- Abdunnabi M, Dadesh K, Mrehel R, Shamekh N (2016) Effect of full implementation of domestic solar water heaters on the electricity peak load in Libya. JSESD 5(2): 33-43.
- Widén J, Lundh M, Vassileva I, Dahlquist E, Ellegård K, et al. (2009) Constructing load profiles for household electricity and hot water from time-use data-modelling approach and validation. Energy Build 41(7): 753-768.
- Frank E, Haller M, Herkel S, Ruschenburg J (2010) Systematic classification of combined solar thermal and heat pump systems. Proceedings of the Euro Sun International Conference on Solar Heating, Cooling and Buildings, Austria, pp. 1-8.
- Sustainable Energy in Libya and Future Generations. The Centre of Solar Energy Research and Studies, Libya.
- Solar Water Heaters Field Project Final Report. Centre for Solar Energy Research and Studies, Libya.
- Thermal Energy Systems Specialists.TESSLibs16: Component Libraries for the TRNSYS Simulation Environment. USA.
- https://task35.iea-shc.org/publications
- https://www.trinasolar.com/us/resources/downloads#TSM-DD06M.05(II)
- https://www.viessmann.de/de/wohngebaeude/solarthermie/flachkollektoren/vitosol-200-fm.html
- Mohamed A, Elbreki AM, Mohamed Shaaban (2020) Revitalizing operational reliability of the electrical energy system in Libya: Feasibility analysis of solar generation in local communities. Journal of Cleaner Production 279(10).
- WHO, Legionella and the prevention of legionellosis.
- Vitosol 200-F+Vitocell 400L Viessmann package.
- JA Duffie, WA Beckman (2013) Solar engineering of thermal processes.
- Beckman WA, Broman L, Fiksel A, Klein SA, Lindberg E, et al. (1994) TRNSYS the most complete solar energy system modeling and simulation software. Renew Energy 5(1-4): 486-488.
- Florschuetz LW (1976) Extension of the Hottel-Whillier-Bliss model to the analysis of combined photovoltaic/thermal flat plate collectors. Sol Energy 22(4): 361-366.
- Zondag HA (2008) Flat-plate PV-Thermal collectors and systems: A review. Renew Sustain Energy Rev 12(4): 891-959.
- Kalogirou SA (2003) The potential of solar industrial process heat applications. Appl Energy 76(4): 337-361.
- Kalogirou SA (2004) Solar thermal collectors and applications. Prog Energy Combust Sci 30(3): 231-295.
© 2021 Malek Al Abani. This is an open access article distributed under the terms of the Creative Commons Attribution License , which permits unrestricted use, distribution, and build upon your work non-commercially.
Editor In Chief


.jpg)


Signup for Newsletter

Quick Links
 Editorial Board Registrations
 Submit your Article
 Refer a Friend
 Advertise With Us
Our Recent Edition

.jpg)


Top Editors


.jpg)


.bmp)
.jpg)
.png)
.jpg)


.jpg)


.png)

.png)


.png)


Financial Support

Sponsors

Latest e-Books

Latest Video

 a Creative Commons Attribution 4.0 International License. Based on a work at www.crimsonpublishers.com.
Best viewed in
a Creative Commons Attribution 4.0 International License. Based on a work at www.crimsonpublishers.com.
Best viewed in