
- About Us
- Information
-

The Author ensures that the research has been conducted responsibly and ethically with adherence to all relevant regulations. read more..
- For Authors
- For Reviewer
- Manuscript Guidelines
- Membership
- Publication Ethics
-
- Journals
- Reprints
- e-Books
- Videos
- Policies
- Contact Us
 COVID-19
- Submissions


Full Text
Peer Review Journal of Solar & Photoenergy Systems
Instantaneous Shadow Estimation in Stationary-Horizontal PV Solar Fields
Suliman M Ahmad, Mukhtar A Irhouma, Khaled A Amer*, Massuod A Fakher, Abdallah Salem, Salah Aldeen S Altahbao and Elsadic Salim
Department of Mechanical & Industrial Engineering, Libya
*Corresponding author: Khaled A Amer, Department of Mechanical & Industrial Engineering, Faculty of Engineering Science and Technology, Libya
Submission: January 29, 2021;Published: March 15, 2021

Volume1 Issue4 March, 2021
Abstract
A general mathematical formula for shadow in horizontal solar fields is derived. Where the shadow occurs on the rows of the solar field due to the falling shadow of one row onto the next row. Shadow dimensions depend on the spacing between the rows, row length and width, azimuth and tilt angles of the solar collectors, field latitude angle and the time. Hourly year-round behaviour of the shadow are discussed related to the design parameters of the solar field. From the obtained results the following conclusions may be drawn: The shadowing area increases as moving north in the northern hemisphere. For time (day and hour), shadow is closely related to the solar altitude angle, the higher angle the smaller shadow. The distance separating the rows plays crucial role in shadow analysis, increasing distance separating the rows leads to fast decreases the shading. However, optimization of the distance separating the rows is a multi-objective optimization problem involves energetic-economic analysis. In general, increasing the tilt angle leads to an increase in shading. However, the optimum tilt angle is restricted by captured maximum solar radiation on the collector’s surface.
Keywords: PV solar field; Shadow; Design parameters
Introduction
Depletion, fluctuation of fossil fuels prices and the environmental damage caused by
traditional fired fossil-fuels electrical power plants, forced to finding alternative sources
of electricity generation and that must be environmentally friendly and sustainable [1,2].
Moreover, overpopulation and industrial development led to increase the energy demand,
therefore, the energy will be main problem of the world through the coming decades [3], only
if we found alternative solution to this problem, such as the wide exploitation of renewable
energy which dispersed all over the world. Libya and other countries in MENA are suffering
from the shortage in electrical power supplies. In Libya the energy deficit the electricity
reaches to blackouts for long hours during summer 2020, it recorded for the period of 25 July
to 7 September about 57.2% [4]. This situation forced peoples to use small gasoline/diesel
electrical generators which in turn will lead to deterioration of the local fragile environmental
situation of the country [5]. In the near future and for all the MENA regions, encouraging the
widespread usage of the renewable energies at the grassroots levels could represent may be
the unique solution to this problem [6-8].
Solar energy potential and applications have been studied by many researchers in Libya
[9-14]. According to Solargis database (http://www.solargis.com), for the Capital city-
Tripoli (32°52’01”N, 13°11’00”E) the total annual Direct Normal Irradiance (DNI) is about
1,919kWh/m2, Global Horizontal Irradiance (Hh) is about 1,946kWh/m2, and Annual solar
radiance incident on a tilted surface (Ht) is about 2,151kWh/m2. Accordingly, many local
studies denoted that the solar energy contribution can be reach 12% of total consumed energy
in year 2020, that can be achieved by utilization of passive/active solar heating systems [12].
Nassar et al highlighted the technical and economical feasibility of PV solar systems in Libya
[10-17].
Heating and shading are the main causative in the degradation of the production capacity
of the solar fields, this attenuation in the PV efficiency reach up to 6% and 4% respectively [4].
Resort to cooling the PV panels to avoid over-heating [18-21]. While it is impossible to avoid
the shadow but a good design can be minimized the losses, and the question remains always
economically.
In PV solar fields, solar panels arrays are deployed in many
rows, all but the first row experiences a degradation in the output
power, due to shadow even when large distance is provided between
rows. In solar fields the shading of rows by previous ones is likely
to occur during sometimes of the day, especially near sunrise and
sunset hours.
The design of a solar field requires predicting of energy losses
due to the shaded PV panels. Shadow analysis still finds great
interest from engineers and researchers, due to its impact on the
performance of solar fields. The shading is dependent on all design
parameters, such as: distance between the rows, dimensions,
azimuth and tilt angles, the time, and the location. The shadow
effect of fixed mode flat-plate solar harvesters has previously
been investigated and interesting results has been reported in
literatures. Shadow analysis and its effect in PV solar fields began
early in the seventies of the 20th century [22] and has not lost its
relevance to this day [23-25]. Furthermore, the shade affects the
intensity of solar radiation if the distance between the rows is
shaded, as it presented in many studies regarding to solar radiation
in solar fields [26-29].
The purpose of this paper is to estimate the instantaneous shadow profile on rows and distance separating the rows of a stationary - horizontal PV solar field. This paper is further organized as follows: Section 2 presents the mathematical modelling of the shadow which analyses the PV solar field design parameters and their effect on the shadow behaviour. While the obtained results are demonstrated in section 3. The study concluded in section 4, in where, some conclusions outlined from the present study. Finally, the study is finishing with a list of references that used in the research.
Shadow Modelling
Shadow study is important in solar fields, where the shadow
falling on the surface of the collectors reduces the amount of
production capacity of the solar field. The shadow is represented
mathematically by several researchers [22-25]. However, the
mathematical model that was derived in this study can be used to
calculate the shading area at anytime and anywhere in the PV solar
field.
In general, in PV solar fields all solar collectors are installed at
the same tilt and azimuth angle (S,Ψ), and rows separating by the
same distance for all rows (V). It was found that, the shading area is
a function of three categories [30]:
Location: latitude angle (L);
Time: day and hour represented by soar altitude angle (∝) and solar azimuth angle (∅);
Design: the length and width of the row (Lc × Wc), tilt and azimuth angles of the rows (S,Ψ) and distance separating the rows (V).
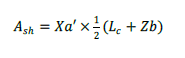
Figure 1 illustrates the coordinate of the shadow area for the case of shadow occurs on the PV solar field rows. The shadow is considered as a rectangle with corners (a-b-b'-a'). While, Figure 2 demonstrates the coordinates of the shadow area when shadow occurs on the distance separating the rows, which considered as a trapezoidal. Therefore, in the Cartesian coordinates the limits of the shadow are as follows:
Figure 1: Geometry of shadow that occurs on the rows.

Figure 2:Geometry of shadow that occurs on the distance separating the rows.

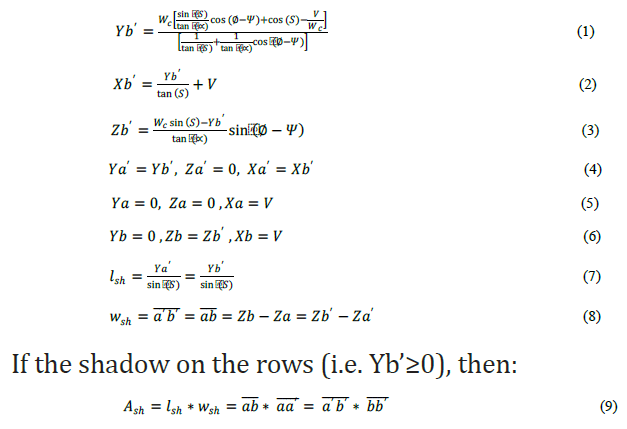
If the shadow on distance separating the row (i.e. Yb’ or Ya’<0), which considered as a trapezoidal then:
 (10)
(10)
Result and Discussion
A comprehensive MS-Excel sheet was prepared in order to study the effect of all parameters on shadow behavior, such as: solar angles. The input data are: the latitude angle, and the solar field design parameters, including: tilt and azimuth surface angles, length and height of the rows, and the distance separating the rows, (Lc,Wc,S,ψ,V). Specimens of the obtained results are presented in this research, from which, a better understanding the shadow effect on the PV solar fields and some conclusions can be drawn.
In general the maximum value of Xa' that is (V+WccosS) and the minimum value is -∞ and that happens when the sun is located behind the rows. However, the maximum value of Ya' that is (WcsinS) and the minimum value is also -∞ and that happens when the solar altitude angle ∝=90°. This situation is happening at locations between the Equator and Tropic of Cancer for the northern hemisphere and vice versa of the southern hemisphere.
In order to better understanding the shadow behavior, 11 figures were depicted. Figures 3-14 present the shadow coordinates Xa' and Ya' for locations at latitude L=20°, 30°, 40°and 50°. The design parameters: tilt angle (S) is varying as (S=0°,20°,40°,60°and 90°), the azimuth angle is south facing and constant (ψ=0°), the length and the height of the row are constants (Lc=100m, Wc=10m), and the distance separating the rows is varying for V=Wc to 2Wc (i.e, V=10,15,20m). The values of the azimuth and tilt angles of the row are chosen according to recommendations of several researches regarding to optimum tilt angles of solar collectors (S=L) [30-33].
Figure 3:The shadow coordinates Xa' and Ya' for a location at latitude L=20°. The design parameters S=20°, ψ=0°, Lc=100m, Wc=10m and V=10m.

Figure 4:The shadow coordinates Xa' and Ya' for a location at latitude L=20°. The design parameters S=20°, ψ=0°, Lc=100m, Wc=10m and V=15m.

Figure 5:The shadow coordinates Xa' and Ya' for a location at latitude L=20°. The design parameters S=20°, ψ=0°, Lc=100m, Wc=10m and V=20m.

Figure 6:The shadow coordinates Xa' and Ya' for a location at latitude L=20°. The design parameters S=30°, ψ=0°, Lc=100m, Wc=10m and V=10m.

Figure 7:The shadow coordinates Xa' and Ya' for a location at latitude L=30°. The design parameters S=30°, ψ=0°, Lc=100m, Wc=10m and V=10m.

Figure 8:The shadow coordinates Xa' and Ya' for a location at latitude L=40°. The design parameters S=30°, ψ=0°, Lc=100m, Wc=10m and V=10m.

Figure 9:The shadow coordinates Xa' and Ya' for a location at latitude L=50°. The design parameters S=30°, ψ=0°, Lc=100m, Wc=10m and V=10m.

Figure 10:The shadow coordinates Xa' and Ya' for a location at latitude L=30°. The design parameters S=0°, ψ=0°, Lc=100m, Wc=10m and V=10m.

Figure 11:The shadow coordinates Xa' and Ya' for a location at latitude L=30°. The design parameters S=20°, ψ=0°, Lc=100m, Wc=10m and V=10m.

Figure 12:The shadow coordinates Xa' and Ya' for a location at latitude L=30°. The design parameters S=40°, ψ=0°, Lc=100m, Wc=10m and V=10m.

Figure 13:The shadow coordinates Xa' and Ya' for a location at latitude L=30°. The design parameters S=60°, ψ=0°, Lc=100m, Wc=10m and V=10m.

Figure 14:The shadow coordinates Xa' and Ya' for a location at latitude L=30°. The design parameters S≅90°, ψ=0°, Lc=100m, Wc=10m and V=10m.

Figures 3-5 present the shadow coordinates Xa' and Ya' for locations at latitude L=20°, the design parameters S=20°, ψ=0°, Lc=100m, Wc=10m and the distance separating the rows is a parameter which varying for V=Wc to 2Wc (i.e., V=10,15,20m).
The effect of the distance separating the rows V is clearly depicted in Figures 3- 5 in where the increasing in V leads to decreasing in Xa' and Ya' and this means that decreasing in the shading area on both the rows and the distance separating the rows. Consequently, an increase in power productivity is expected from the solar field. However, increasing the distance separating the rows will result in an increase in the capital cost of the PV solar field, and therefore, additional economic calculations must be made to find the optimum distance.
The effect of the solar field location on the shadow is demonstrated in Figures 6-9. In where, the azimuth angle, tilt angle, distance separating the rows, length and height of the rows remain constant and the latitude angle varying from 20 to 50 degrees. The above figures show that the shadow is get longer as moving to the north. And this is due to relationship between the latitude angle and the solar altitude angle (α), where the value of α is decreasing as we head north. In turn, the lower α increases the shade length.
The effect of the tilt angle of the solar field’s rows on the shadow is illustrated in Figures 10-14. In where, the latitude angle, the azimuth angle, the distance separating the rows, the length and height of the rows remain constants and the row’s tilt angle varying from 0º to 90º.
It is clear from the above figures that, in general increase in tilt angle (S) value leads to an expand in the shading. However, the optimum tilt angle is restricted by maximum solar radiation that will be captured.
Conclusion
Estimation of shadow occurring on PV solar fields has been
considered. A number of design parameters that affecting on
shadow behaviour have been analysed. Mathematical relationships
of the shadow have been derived to represent the instantaneous
shadows in stationary-horizontal solar field. Accordingly, the
following conclusions can be outlined:
1. The shadowing area increases as moving north in the
northern hemisphere, and the same thing for the southern
hemisphere the shadowing area increases as moving south.
2. The distance separating the rows plays crucial role in
shadow analysis, increasing distance separating the rows leads
to fast decreases the shading. However, optimization of the
distance separating the rows is a multi-objective optimization
problem involves energetic-economic analysis.
3. Increasing the tilt angle leads to an increase in shading.
However, the optimum tilt angle is restricted by maximum solar
radiation that will be captured
4. For time, the shade is closely related to the solar altitude
angle (α), the higher (α) the smaller shadow (Appendix).
Appendix:A screenshots of the MS-Excel sheet “Shadow on Solar Field”.

References
- Yousif S, Salem A, Nassar Y, Bader I (2006) Investigation of pollutants dispersion from power stations, International journal of energy research 30(15): 1352-1362.
- Nassar Y, Aissa K, Alsadi S (2017) Air Pollution Sources in Libya. Research & Reviews: Journal of Ecology and Environmental Sciences 5: 63-79.
- Nassar Y, Aissa K, Alsadi S (2017) Estimation of environmental damage costs from CO2e emissions in Libya and the revenue from carbon tax implementation. Low Carbon Economy 8: 118-132.
- Amer K, Fakher M, Salem A, Ahmad S, Irhouma M, et al. (2020) Power losses on PV solar fields: sensitivity analysis and a critical review. International Journal of Engineering Research & Technology (IJERT) 9(9): 1000-1007.
- Nassar Y, Amer K, Irhouma M, Ahmad S (2015) Economical and environmental assessment of electrical generators: A case study of southern region of Libya. International Journal of Energy Policy and Management 1(4): 64-71.
- Nassar Y, Alsadi S (2016) Economical and environmental feasibility of the renewable energy as a sustainable solution for the electricity crisis in the Gaza Strip. International Journal of Engineering Research and Development 12(3): 35-44.
- Nassar Y, Alsadi S (2019) Assessment of solar energy potential in Gaza strip-Palestine. Sustainable Energy Technologies and Assessments 31: 318-328.
- Nassar Y, Alsadi S (2018) Wind energy potential in Gaza Strip-Palestine state. Solar Energy and Sustainable Development 7(2): 41-57.
- Amer K, Fakher M, Ahmad S, Irhouma M, Altahbao S, et al. (2020) Performance of domestic solar heating system with thermal storage using phase change materials. International Journal of Engineering Research and Development 16(9): 1-11.
- Yasser FN, Mohammad JA, Mohamed NS, Ahmad AH, Khaled AA, et al. (2021) Dynamic analysis and sizing optimization of a pumped hydroelectric storage-integrated hybrid PV/Wind system: A case study. Energy Conversion and Management 229:
- Salem A, Nassar Y, Yousif S (2004) The Choice of Solar Energy in the Field of Electrical Generation-Photovoltaic or Solar Thermal - For Arabic Region, World Renewable Energy Congress VIII (WREC 2004).
- Nassar Y, Salem A (2007) The reliability of the photovoltaic utilization in southern cities of Libya. Desalination 209: 86-90.
- Nassar Y (2015) Thermodynamics analysis and optimization procedure for domestic solar water heating system, AASCIT. American Journal of Energy and Power Engineering 2(6): 92-99.
- Nassar Y, Yousif S, Salem A (2007) The second generation of solar desalination systems. Desalination 209(1-3): 177-181.
- Nassar Y, El Noaman A, Abutaima A, Yousif S, Salem A (2006) Evaluation of the underground soil thermal storage properties in Libya. Renewable energy 31(5): 593-598.
- Nassar Y, Salem A (2002) Solar energy & energy conservation in buildings, 1st International Congress of Mechanics-Constantine Faculty of Engineering Department of Mechanical Engineering, University of Constantine, Algeria, pp. 14-16.
- Hafez A, Nassar Y, Hammdan M, Alsadi S (2019) Technical and economic feasibility of utility-scale solar energy conversion systems in Saudi Arabia. Iranian Journal of Science and Technology.
- Nassar Y, Salem A, Sergievsky E (2001) A creation of mathematical model for photovoltaic/thermal (PV/T) solar flat-plate collector. International conference on renewable energy for regional development CIGA, Bogor - Indonesia, pp. 28-31.
- Nassar Y, Sergievsky D (2000) Heat transfer in flat-plate solar air heating collector, Heat Transfer 2000 "the sixth international conference on advanced computational methods in heat transfer", Madrid, Spain, pp. 575-584.
- Fathi NY, Alamen SM (2014) Economic and energetic analysis for optimizing the length of flat-plate solar air heating collectors. Applied Mechanics and Materials 446-447: 810-816.
- Nassar Y, Alsadi S, Amer K, Yousef A, Fakher M (2019) Numerical analysis and optimization of area contribution of the PV cells in the PV/T flat-plate solar air heating collector. Solar Energy Research Update 6: 43-50.
- Appelbaum J, Bany J (1979) Shadow effect of adjacent solar collectors in large scale systems. Sol Energy 23(6): 497-507.
- Nassar Y, Hadi H, Salem A (2008) Time tracking of the shadow in the solar fields J Sebha Univ 7(2): 59-73.
- Hadi H (2006) Tracking of shadow path and studying its effect on PV solar fields, M.Sc. thesis. Om-Durman Islamic University, Sudan.
- Alsadi S, Nassar Y (2019) A general expression for the shadow geometry for fixed mode horizontal, step-like structure and inclined solar fields. Solar Energy 181: 53-69.
- Alsadi S, Nassar Y (2017) Estimation of solar irradiance on solar fields: An analytical approach and experimental results. IEEE 1601-1608.
- Nassar Y, Alsadi S (2016) View factors of flat solar collectors’ array in flat, inclined, and step-like solar fields. J Solar Energy Eng ASME Trans 138: 1-8.
- Nassar YF (2020) Analytical-numerical computation of view factor for several arrangements of two rectangular surfaces with non-common edge. International Journal of Heat and Mass Transfer 159: 120-130.
- Alsadi SY, Nassar YF (2017) A Numerical Simulation of a Stationary Solar Field Augmented by Plane Reflectors: Optimum Design Parameters. Smart Grid and Renewable Energy 8(7): 221-239.
- Nassar Y (2006) Solar energy engineering active applications. Sabha University, Libya.
- Alsadi S, Nassar Y (2016) General polynomial for optimizing the tilt angle of flat solar energy harvesters based on ASHRAE clear-sky model in mid and high latitudes. Energy and Power 6(2): 29-38.
- Alsadi S, Nassar Y (2017) Energy demand-based procedure for tilt angle optimization of solar collectors in developing countries. Journal of Fundamentals of Renewable Energy and Applications 7: 225.
- Nassar Y, Hafez A, Alsadi S (2020) Multi-factorial comparison for 24 distinct transposition models for inclined surface solar irradiance computation in the state of Palestine: A Case Study. Front Energy Res 7: 163.
© 2021 Khaled A Amer. This is an open access article distributed under the terms of the Creative Commons Attribution License , which permits unrestricted use, distribution, and build upon your work non-commercially.
Editor In Chief


.jpg)


Signup for Newsletter

Quick Links
 Editorial Board Registrations
 Submit your Article
 Refer a Friend
 Advertise With Us
Our Recent Edition

.jpg)


Top Editors


.jpg)


.bmp)
.jpg)
.png)
.jpg)


.jpg)


.png)

.png)


.png)


Financial Support

Sponsors

Latest e-Books

Latest Video

 a Creative Commons Attribution 4.0 International License. Based on a work at www.crimsonpublishers.com.
Best viewed in
a Creative Commons Attribution 4.0 International License. Based on a work at www.crimsonpublishers.com.
Best viewed in