
- About Us
- Information
-

The Author ensures that the research has been conducted responsibly and ethically with adherence to all relevant regulations. read more..
- For Authors
- For Reviewer
- Manuscript Guidelines
- Membership
- Publication Ethics
-
- Journals
- Reprints
- e-Books
- Videos
- Policies
- Contact Us
 COVID-19
- Submissions


Full Text
Peer Review Journal of Solar & Photoenergy Systems
Technical Feasibility Analysis of the Use of Solar Chimneys in Brazil
Strobel CS1*, Valle PD1, Catapan MF2 and Villas Boas MN2
1 Mechanical Engineering Department, Francisco, Brazil
2Graphical Expression Department, Francisco, Brazil
*Corresponding author: Strobel CS, Mechanical Engineering Department, Francisco, Brazil.
Submission: March 01, 2019;Published: December 18, 2019

Volume1 Issue3 December, 2019
Abstract
Solar chimneys are power generation plants, which use solar radiation to promote a flow of heated air, whose kinetic energy is extracted by turbines located at the base of the chimney. The literature regarding this technology is extensive and many studies have been conducted to verify numerical and mathematical models, as well as analyzes of technical and economic viability. However, none of those studies has considered the potential of the application of this technology in Brazil. Considering that, this work aims to map the energy potential for the use of solar chimneys in Brazil, using a mathematical and numerical model of extreme precision. The results indicate a great potential for the use of this technology in the country, especially in the Northeast, Midwest, and in a state of the Southern region. Considering the annual average solar radiation levels, the city of Cuiabá-MT is the one which has the highest power generation potential, with a daily average of 50MWh and a peak generation of 5.10MW, followed by the city of Propriá-CE, generating 49.53MWh and a peak generation of 5.01MW. The results were promising and, although the overall efficiency of this technology is not very high, around 1.3%, these plants present low operating costs, long service life, and use materials with low emissions rates of CO2 in their manufacturing process.
Introduction
Solar chimneys are power generation plants that use solar energy to heat a mass of air contained in the bottom of a vitreous collector. They also have a chimney installed at their center in order to promote an airflow. This happens by connecting this mass of heated air with great pressure to the exit of the chimney, which is a region of lower pressure. The heated air at the base of the chimney has a lower specific mass, and thus thrust forces promote a flow of this mass of air to the outlet of the chimney. This process produces a continuous airflow, and the created kinetic energy is transformed into mechanical energy by a turbine at the base of the chimney. This energy is then converted into electrical energy through a generator. Figure 1 shows the working principle of a solar chimney.
Figure 1:Solar chimney working principle.

The soil beneath the collector is a convenient means for storing some of the solar energy during the day, allowing an airflow to be maintained even at night, when this energy previously stored by the soil can be released to the air. The speed of the airflow created by the thrust forces is proportional to the increase of temperature promoted by the collector and by the height of the chimney. The power generated by the turbines is proportional to the volumetric airflow rate and the pressure drop in the turbine.
In 1981, an experimental prototype was built in Manzanares,
Spain, with the sponsorship of the German government. This pilot
plant had a capacity of 50kW and a nominal height of 200m, with
a collector measuring 244m in diameter. Haaf et al. [1] presented
the details of the operation, energy balance and a cost analysis
of the plant. Once implemented, the plant was instrumented and
operational data were obtained. Haaf et al. [2] presented the
preliminary results of the operation of the Manzanares plant. This
plant was in operation until 1989 and demonstrated the reliability
and technical feasibility of this concept of renewable energy
generation.
Due to the optimistic scenario related to this type of energy
generation system, and after the experiments conducted in
Manzanares, an extensive literature began to emerge. Studies with
different targets were conducted to determine the influence of
several parameters on energy generation and efficiency, such as
geometry of the plant, turbine arrangement, material quality of the
collector cover, soil roughness and its thermophysical properties,
development and validation of mathematical and numerical
models. Besides that, technical and economic viability analysis
were executed in order to evaluate the implementation of this type
of technology in several regions of the world.
According to Corsini et al. [3], transition towards a fossil
fuel free future is not to be understood as a matter of technoeconomic
innovation but as a process in which the ‘social’ and
the ‘technical’ are inextricably intertwined, and technologies coevolve
with programmes of governing. In this case, future energy
plans for transition towards a fossil future free future are very
important and demands a more participatory idea of smart cities
that emerge from real-world practices. Among the main studies
involving mathematical and numerical modeling, those conducted
by Bernardes et al. [4] stood out, since the model proposed by the
authors is based on the application of discrete Euler equations for
the collector, using the Bossiness approximation to predict the
velocity in the chimney as a function of the temperature increase
in the collector. The model of Bernardes et al. [4] predicts an error
of only 1.6% in power generation when compared to the prototype
of Manzanares.
Koonsrisuk et al. [5] proposed a model based on the sum
of the loss of charge throughout the system and the addition of
temperature promoted by solar radiation to predict the power
generated. Due to great simplifications in the model, there was a
difference of 194.8% in relation to Manzanares, according to a
study by Strobel et al. [6].
Strobel et al. [6] analyzed four models, including the model of
Bernardes et al. [4] and the model of Koonsrisuk et al. [5]. After the
analysis, they proposed changes in both models. The adjustment
proposed in the model of Bernardes et al. [4] was the addition of
the multiple reflections effect that the radiation undergoes on the
cover material. They also added the multiple reflections between
the cover and the ground. With this, the error in relation to
Manzanares was 1.3%; that is, 2.9% more potency than predicted
by Bernardes et al. [4]. As for the modified model of Koonsrisuk et
al. [5], besides the multiple reflections present in the glass cover
and between the collector and the soil, the authors included the
thermal network proposed by Bernardes et al. [4] to predict the
temperature rise in the collector, including thermal storage in the
soil, which was not considered in the original model. In addition
to these modifications, other smaller load losses were included in
the model in order to make it more precise than the original. Some
of those adjustments were the load loss in the collector/chimney
transition, internal reinforcements of the chimney and the collector,
chimney output and non-adiabatic atmosphere, translating into the
model a change in the turbine pressure-drop rate from 0.8 to 0.97.
Thus, the modified model of Koonsrisuk et al. [5] reached a smaller
error percentage than the original one, around 37.5% in relation to
the prototype of Manzanares.
The model of Bernardes et al. [4], modified by Strobel et al.
[6], presents a more complete model, considering solar radiations
and their interference in the semitransparent portion of the cover.
Because of these improvements and the fact that this model has
reached higher accuracy results, it was used as a reference in this
study.
Several studies have been carried out regarding the technical
and economic feasibility of the implantation of electric power
plants, using the concept of solar chimneys, in many regions of
the world. However, none of them has been focused on Brazil and
its regions. An analysis of this magnitude requires a study of the
electrical potential of each region based on climatic conditions,
such as temperature history, relative humidity, open sky conditions,
direct and diffuse radiation over the months, and some other
factors. Therefore, the objective of this work is to evaluate the
energy potential of a solar chimney in Brazil, mapping the energy
generated in the whole territory, for a given geometry. The solar
radiation data were obtained through the Brazilian Solarimetric
Atlas - GPFAE [7].
Mathematical model
The proposed model considers a semi-permanent regime with
prescribed speed conditions, where the working fluid is air. The
velocity field is a function of the thrust forces caused by the air
temperature increase in the collector. However, this analysis must
be carried out with caution, since there is strong influence of the
collector and the soil in the transient conduction in the soil. Figure
2 shows a diagram of the airflow inside the Solar Chimney.
To investigate the air behavior inside the collector and the
chimney, some hypotheses must be considered, including:
A. The collector is treated as a flat surface;
B. The height of the collector relative to the ground is
constant;
C. The collector has only one layer of glass;
D. The airflow is axisymmetric; that is, uneven heat at the
collector surface relative to the chimney can be neglected;
E. The temperature gradient between the soil and the
collector is negligible.
Figure 2:Airflow inside the solar chimney.

The chimney converts the collector heat flow into kinetic and
potential energy. It acts as a connector element between the base
of the chimney, which presents a lower density due to the addition
of temperature, and the output of the chimney, which presents a
higher density. The lighter the air column inside the chimney,
the greater the thrust force. This generates a pressure difference
between the collector outlet and the environment.
The movement of the fluid occurs only by differences in density
as a result of the difference between the temperatures. The equation
that represents the conservation of the intensity of movement
applied to the chimney can be represented as the following:
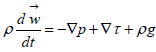
It is appropriate, instead of the mass force ρ.g, to introduce the force of thrust, (ρ-ρ_atm).g. This is obtained by decomposing the pressure term into a static pressure component and another dynamic pressure component:
p = − pest + pdin
For a motionless fluid, the term of the static pressure appears as the following:
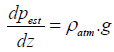
Since the process is not isothermal, ρatm varies with the temperature field, which varies with the z coordinate of height. Thus, one has:
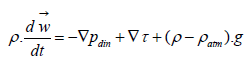
To determine an expression for the velocity of the fluid, considering the equation of conservation of momentum quoted above, it is necessary to use Euler’s equation for the Cartesian component z:
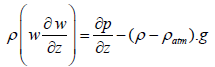
Integrating the new expression with the previous equation, one may have:
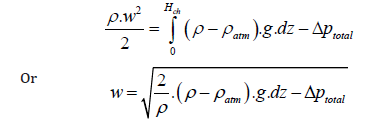
Where Δptotal already considers the overall loss of load in the
system.
The tower (chimney) converts the heated airflow produced by
the collector into kinetic energy (convection current) and potential
energy (pressure drop in the turbine). Thus, the difference in density
caused by the increase in temperature in the collector acts as the
driving force. The less dense column of air in the tower is connected
to the neighbor atmosphere at the base (inside the collector) and at
the top of the tower, thereby gaining thrust. A pressure difference is
produced between the base of the chimney (outlet of the collector)
and the environment, and can be represented as follows:
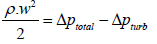
Knowing that the pressure drop in the turbine is a function of the total pressure drop multiplied by a fall factor in the turbine, we have:
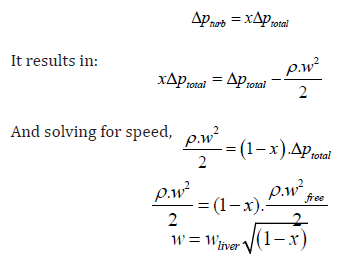
The velocity wfree is the maximum speed that would be obtained
without the presence of the turbine. It is calculated as if there
were no frictional losses. To calculate this problem, we use Euler’s
equation; however, using the Boussinesq approximation method.
The thrust term, due to the density difference, is obtained
considering the Boussinesq approximation method, which
is a linearization of density dependence as a function of the
temperature. The Boussinesq approximation method is widely used
in numerical and mathematical modeling of natural convection
problems. According to Gray and Giorgini [8], this method is
physically consistent, and it facilitates the solution of the problem.
It considers the fluid incompressible throughout the system, except
in the thrust term of the z-direction motion equation. To determine
a mathematical expression for this component, a density ρ_∞ is
considered at a corresponding temperature T∞ . After the proper
algebraic considerations, using the law of ideal gases, we have:
ρ= ρ∞ [1 -β (T -T∞)]
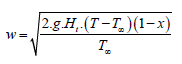
Based on this equation, other important parameters can be proposed, such as maximum speed, maximum power output, heat collected by the air, plant efficiency and pressure drop in the system.
Based on Euler’s equation and using the hypotheses already stablished, one may have:
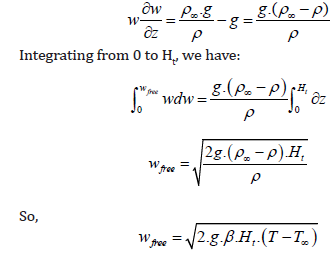
In this way, the actual maximum speed in the plant considering the turbine load loss is expressed by:
Temperature rise in collector
In order to determine the temperature, increase in the collector, it is necessary to balance the energy in a specific section of the same. The energy behavior in the collector can be seen in Figure 3.
Figure 3: Energy behavior inside the solar chimney.

For each intermediate node, an energy balance was performed for a permanent regime, ending with the following equations:
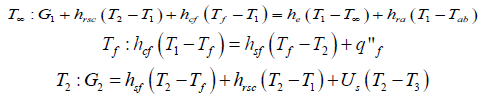
Where T3 = T2,0 ; that is, the surface temperature in the previous time step. To be called:
Us = he + hra
And, rearranging the terms as a function of the temperatures, we end at a matrix 3 x 3:
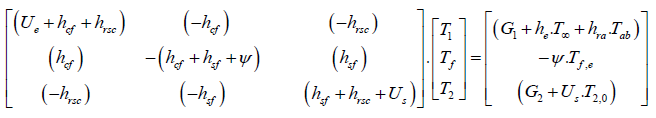
Generically, the above matrix presents the following form:
[A].[T ] = [B]
Where the temperature vector can be determined by matrix inversion:
[T]= [ A]−1.[ B]
All the heat transfer coefficients mentioned in the thermal network of the collector depend on the temperature and the properties of the air and the environment. All these convection coefficients are described in the work conducted by Bernardes et al. [4] and can be easily found in the literature.
Optical collector properties
According to Siegel and Howell [9], the radiation in translucid materials, such as glass, are subject to multiple reflections. Using the series theory, we have, considering only the glass coverage:
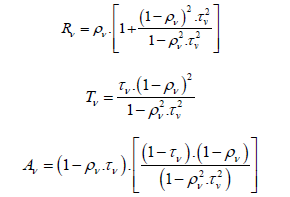
However, the soil also reflects radiation. Besides that, multiple reflections between the soil and the glass cover also occurs. According to Strobel et al. [10], considering multiple reflections of solar radiation in the glass cover and between the glass cover and the soil, using the series theory, we have the following fraction of reflected radiation from the collector:
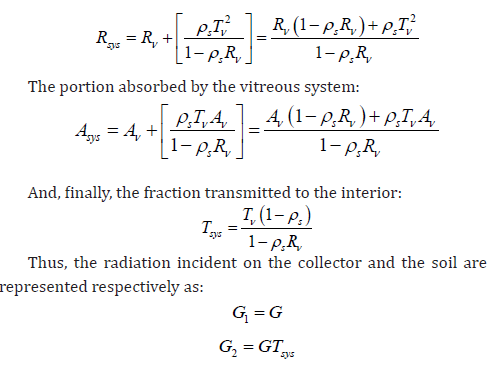
According to Strobel et al. [10], the error induced by not using the appropriate methodology can range from 58% for high reflectance soils and may reach up to 85% depending on glass quality and soil reflectance. Evidently, the difference in power generated does not follow this order of magnitude, since the power generated depends on several other factors besides the transmissibility of the glass.
It is known that the power produced by a flow machine, according to Bird [11], is given by the product of the volumetric flow, pressure drop in the turbine and its efficiency, resulting in:

Numerical Model
The numerical model consists in, primarily, separating the
collector into several circular sections. In this study, 2,000 sections
were proposed. After this, a velocity is set up as an estimative in
the chimney, and, by the conservation of the mass, it is possible to
find the velocity that enters the first section, further away from the
chimney. At first estimate, all nodes are at room temperature.
For this first time, all convection coefficients are calculated,
and the temperature matrix is solved. After convergence, the
input temperature in the new section is updated as the output
temperature of the analyzed section. After that, the same is
applied to the next session. The process is repeated until the last
section was analyzed. By computing the temperature at the base
of the chimney, the velocity is recalculated in the whole chimney
and the velocity is updated at the periphery of the collector. Then
the process is repeated until the velocity convergence. Once the
convergence is reached, the power generated at that time step is
computed, and the time step is advanced in 10 minutes. The whole
process is then repeated for 3 days, to avoid the influence of the
arbitrariness imposed at the beginning of the iterative procedure.
Numerical Results and Discussion
Before starting the simulations for the Brazilian territory, it was necessary to stipulate the dimensions of the proposed plant, as well as the data on the material of the cover and the soil. The height of the plant is set as 500 meters. Many authors in the literature carry out simulations involving very high towers, in the order of 1000 ~ 1500 meters. However, companies that are doing business in this field are reducing the height of their chimneys to around 250 ~ 500 meters, for reasons of construction technology. Very high chimneys can be considered as a risk from the point of view of engineering, since the construction becomes expensive and dangerous. Besides that, it could jeopardize the investment. The results shown on this study also consider a collector diameter (glass surface) of 1000 meters. A variable that will be kept constant is the diameter of the chimney, which dimensions were defined as 5% of the collector diameter, as presented in Manzanares and in several other studies in the literature. Regarding the quality of the vitreous material, it is important to consider that a vitreous material of classification NFRC ID 5003 with 4,673mm of thickness and coefficient of extinction 19.7 was used. The complete parameter data used in the simulation are given in Table 1.
Table 1:arameter data used in simulation.

The incidence of solar radiation is important not only to start
any simulation, but also to define the best geographic location
for the construction of a plant of this type. Thus, it is necessary to
know the solar energy potential that affects the region of the study;
in this case, Brazil and its borders. The GPFAE [7] proposed the
solarimetric atlas that was used in this research. This atlas shows
isoline maps for each month of the year and a map of isolines with
the annual average of the country. The values used for making
these isoline maps were extracted from internal databases that
are fed by numerous actinographic and pyranometric stations
scattered throughout the country. These stations are equipped
with actinographs and pyranometers that measure total, direct
and diffuse solar radiation. This atlas presents a database that
allowed the construction of tables for a more precise analysis of the
incidence of radiation on the surface of the Brazilian territory.
Based on the proposed geometry, Figure 4 shows the obtained
energy potential distribution of solar chimneys in winter throughout
the Brazilian territory. The energy generated is expressed in MWh/
day. There is a greater energy potential in the Northeast region, more
specifically in the state of Sergipe. The city of Propriá presents an
average of 51.4MW.h/day during winter, with a peak of generation
of 5.21MW. The Southern region has lower energy potential during
this season, as well as the shaded regions of the Amazon region. For
the summer condition, the energy potential distribution of solar
chimneys is obtained in the whole Brazilian territory is shown on
Figure 5. The energy generated is expressed in MWh/day.
Figure 4:Energy potential in Brazil during winter.

Figure 5: Energy potential in Brazil during summer

As in winter, there is great energy potential in the Northeast
regions during summer. However, in the Southern region, more
specifically in the Southwest of Rio Grande do Sul, there is a strong
energy potential. The largest amount of energy generation during
summer occurred in the city of Passo Fundo, in the state of Rio
Grande do Sul, with a daily generation of 54.03MWh and an energy
peak of around 5.65MW. Some shaded regions in the North remain
with low energy potential during summer due to the Amazonian
coverage.
To verify the feasibility of a project with these dimensions in
any of these territories, it is necessary to know the daily amount
of energy generated in average annually. Based on the proposed
geometry, the data shown in Figure 6 represents the energy
potential distribution of solar chimneys-annual average-that was
obtained throughout the Brazilian territory. The values acquired
are shown in Table 2, for the main Brazilian regions. The energy
generated is expressed in MWh/day.
Table 2: Energy potential in Brazil annual average.

Figure 6:Energy potential in Brazil annual average

The image shows that there is a great energy potential in the North and Northeast regions. It also shows that the Southern region has a lower potential for energy generation, considering an annual average. Note that, because the scale is constant in all isoline graphs for this parameter, there is a black region on the map that has a daily energy generation of less than 35.5MWh/day. Some shaded regions in the North remain with low energetic potential throughout the year due to the Amazonian coverage. The highest peak of power found by the annual average was concentrated in the Midwest region, more specifically in the city of Cuiabá-MT, with 5.1MW of energy peak and a daily average of 50.01MWh of power generation.
Conclusion
Technologies based on renewable energies, where the fuel
used comes from natural resources such as air, solar radiation
and others, have a great environmental appeal, because is still
very considerable the pressure put on technologies that operate
by fossil fuels due to the impacts related to global warming.
However, renewable energy still has an unfavorable aspect, which
is cost. It is known that building a 500m-high chimney is still a
challenge for engineering. In addition, a collector of 1000 meters in
diameter (785,000 m2) made of vitreous material is very expensive.
However, this technology supports several years of operation at a
very low operating cost. Besides that, there are reports of shortterm
projects that could benefit thousands of people with clean,
renewable energy.
Despite having a low efficiency (~ 1.3% for H = 500m), this
technology has low operating costs, low CO2 emissions in the production of its components, compared to other clean energies,
and has a long service life (>60 years). Regarding the technical
feasibility, the Brazilian territory is broad and with a great
amplitude of solar radiation. The most promising states are the
states located in the Northeast and Midwest regions. However, the
state of Rio Grande do Sul, in the Brazilian southern extreme, was
also promising. The states in Northern region were not as efficient
due to the Amazonian coverage. The states of the Southeast region
and the other states of the Southern region, such as Paraná and
Santa Catarina, were also less efficient due to the low index of solar
radiation when compared to the others States already mentioned.
References
- Haaf W, Friederich K, Mayr G, Schlaich J (1983) Solar chimneys. Part 1: Principle and construction of the pilot plant in Manzanares. International Journal of Solar Energy 2: 3-20.
- Haaf W (1984) Solar chimneys. Part 2: Preliminary test results from the Manzanares pilot plant. International Journal of Solar Energy 2(2): 141-161.
- Corsini F, Certomà C, Dyer M, Frey M (2018) Participatory energy: Research, imaginaries and practices on people’s contribute to energy systems in the smart city. Technological Forecasting & Social Change 142: 322-332.
- Bernardes MAS, Weinrebe G, Vob A (2003) Thermal and technical analyses of solar chimneys. Solar Energy 75(6): 511-524.
- Bejan A, Lorente S, Koonsrisuk A (2010) Constructal solar chimney configuration. International Journal of Heat and Mass Transfer 53(1-3): 327-333.
- Strobel C, Moura LM, Mariani VC (2018) Mathematical methods for solar chimney analysis. Journal of Technology Innovations in Renewable Energy 7: 19-26.
- GPFAE (Grupo de Pesquisa em Fontes Alternativas de Energia) (2003) Atlas Solarimétrico do Brasil. Universidade Federal de Pernambuco, Brazil.
- Gray DD, Giorgini A (1976) The validity of boussinesq approximation for liquids and gases. International Journal of Heat Mass Transfer 19(5): 545-551.
- Siegel R, Howell JR (2002) Thermal radiation heat transfer.
- Strobel C, Moura LM, Mariani VC (2016) Radiative heat transfer considering the effect of multiple reflections in greenhouse structures. Journal of the Brazilian Society of Mechanical Sciences and Engineering 38(4): 1325-1331.
- Bird RB, Stewart WE, Lightfoot EN (2006) In: Transport phenomena 2nd (edn), Wiley, USA.
© 2019 Strobel CS. This is an open access article distributed under the terms of the Creative Commons Attribution License , which permits unrestricted use, distribution, and build upon your work non-commercially.
Editor In Chief


.jpg)


Signup for Newsletter

Quick Links
 Editorial Board Registrations
 Submit your Article
 Refer a Friend
 Advertise With Us
Our Recent Edition

.jpg)


Top Editors


.jpg)


.bmp)
.jpg)
.png)
.jpg)


.jpg)


.png)

.png)


.png)


Financial Support

Sponsors

Latest e-Books

Latest Video

 a Creative Commons Attribution 4.0 International License. Based on a work at www.crimsonpublishers.com.
Best viewed in
a Creative Commons Attribution 4.0 International License. Based on a work at www.crimsonpublishers.com.
Best viewed in