
- About Us
- Information
-

The Author ensures that the research has been conducted responsibly and ethically with adherence to all relevant regulations. read more..
- For Authors
- For Reviewer
- Manuscript Guidelines
- Membership
- Publication Ethics
-
- Journals
- Reprints
- e-Books
- Videos
- Policies
- Contact Us
 COVID-19
- Submissions


Full Text
Peer Review Journal of Solar & Photoenergy Systems
Performance Analysis of BIPV Prototype System Installed in Greece and Main Affecting Parameters
A Peppas*, K Kollias, M Taxiarchou, D Mantelis, Ch Politi and I Paspaliaris
School of Mining and Metallurgical Engineering, National Technical University of Athens, Greece
*Corresponding author: A Peppas, School of Mining and Metallurgical Engineering, National Technical University of Athens, Athens, Greece, Tel: 210 772 2219; Email:peppas@metal.ntua.gr
Submission: September 05, 2018;Published: October 25, 2018
Volume1 Issue2 October 2018
Abstract
The extended use of fossil fuels for power generation resulted in energy crisis and serious environmental problems, such as global warming etc. Nowadays, the deployment of “green” technologies related to renewable resources aspires to change the conventional power flow directions. In this framework, scientific community puts all the efforts to provide a sustainable and efficient solutions in respect with renewable resources and their application. Taking into consideration the fact that 68% of the world population projected to live in urban areas by 2050, the use of renewable energy sources as part of the building envelope could potentially provide a promising solution, transforming buildings from “energy consumers” to “energy producers”. One of the most appealing and easily installed technologies of renewable generation is related to the photovoltaic systems (PVs). However, the challenge is to increase the possible integration of PVs into the building infrastructure. For the successful integration of PVs into the building envelope, aesthetic issues along with technological issues, such as the highest possible energy performance, need to be considered and addressed.
This paper aims to present a new generation of PVs, under the frame of the EU funded research program “Construct PV”. According to the “Construct PV” concept, PV panels are not mere means of harvesting solar energy, but they are customizable, efficient and low-cost building components, integrated in the opaque part of the building skin. Furthermore, the real demonstration BIPV installation, constructed on the roof of the School of Mining and Metallurgical Engineering at NTUA premises will be presented. At the demonstration site, an advanced online monitoring system has been installed providing the ability to gather all the necessary data for the performance evaluation of the BIPV system, such as power and specific energy yield. Additionally, for an in-depth and detailed analysis, several different sensors have also been installed, accumulating data from weather conditions to specific in-plane solar irradiation and module temperature in correlation to different inclinations. In this paper, the performance evaluation as well as the factors affecting the performance (i.e. temperature, shading effect) are discussed and analyzed, quantifying the results for the new BIPV technology.
Introduction
Energy is a key asset for the technological development and the economic prosperity of the society [1,2]. It is estimated that in 2030 energy consumption may increase by 53% with around 80% of the total energy supply being generated from fossil fuels. Notably, the associated CO2 emissions are expected to increase by around 37- 55% [3,4]. This extended dependence on non-renewable resources as well as the global warming have attracted the interest regarding the exploitation of renewable and sustainable resources [5]. Currently, over 18% of the global energy consumption is derived from the renewables [6]. Main advantages of the renewable energy sources include the long-term availability, the accessibility and the environmental benignity [7]. As far as the European Union (EU), new goals have been promoted to be realized by 2020 for the decarbonization of the energy sector towards a “Greener, Energy Efficient and a Resource Efficient Europe”.
Especially for the construction sector, which is responsible for more than 40% of energy consumption within the European Union [8], one of the main challenges is the development of solutions able to induce reduction of total energy consumption and to achieve the higher possible integration of renewable energy systems into the building infrastructure. The use of renewable energy sources as part of the building envelope could potentially provide a promising solution, transforming buildings from “energy consumers” to “energy producers”. For the PV technology in particular, the introduction of a PV panel that is not just the means for producing energy but also a building element with enhanced properties, can become a smart, multifunctional and cost-effective solution not only for new constructions but for the retrofitting of old buildings as well.
Several PV technologies are available; each one of these has other specifications, efficiencies and implementation costs. The majority of the PV applications are based on the installation of the PV panels on top of the building surfaces which cannot be easily integrated in several buildings such as those in traditional districts [9,10]. On the other hand, focusing on the Building Integrated PV (BIPV) technology, there is a wide range of products that can be categorized such as (i) foil, (ii) tile, (iii) module and (iv) solar cell glazing products [11,12]. The first three categories are mainly used for rooftop application while the fourth one is suitable for fenestration. One common obstacle that these technologies are facing, is the relatively low efficiency and the low active area. In order to be able to integrate to the several roof topologies by retaining the aesthetical appearance, they turn to have quite low active area leading to very low efficiencies.
The “Construct PV” European research project aspired to confront all the new challenges of PV technology with a holistic approach of Building Integrated Photovoltaics (BIPV), by installing PVs for energy harvesting in the opaque surfaces of a building [13]. However, one of the biggest challenges for the improvement of PV module efficiency is the increase of the active area. The approach to overcome this technical issue in the framework of “Construct PV” is based on the introduction of the Smart Wire Connection Technology (SWCT). Smart Wire Connection Technology developed by Meyer Burger (MB) is an innovative technology regarding the wire bonding between the cell and the module, also known as cell metallizationinterconnection. Furthermore, the shorter length of the fingers (no busbars needed) as well as the better light in-coupling resulted in less electrical and optical losses. Based on the application of SWCT, the shading losses are reduced by 25%, whereas the modules efficiency is increased by up to 7%. Additionally, the finer finger lines provide a better optical appearance to the module leading to a more elegant optical result. The “Construct PV” panels also deal with PV performance decrease due to temperature by benefiting from the heterojunction technology (HJT): HJT solar cell present an excellent temperature coefficient of -0.21%/K resulting in higher cell efficiencies. The “Construct PV” panels possess also interesting building material properties, such as water tightness, fire proof and a range of framing options, having all the related certification documents. It is foreseen that the industrialization of this modern technology panels will lead to a production cost of 0.60€/Wp, making the “Construct PV” panels competitive products in the building materials market.
An important aspect of the project was the implementation of the developed technologies in real demonstration sites, one of which was the building of Mining and Metallurgical Engineering at NTUA Zografos Campus of Athens (Attica, Greece), showcasing the Construct-PV rooftop applications. The first objective of the NTUA demonstration site was to present the architectural integration of the BIPV system to the existing building: the new system was not simply installed on the rooftop, but the impressive architectural design improved the value of the whole building. The second important objective of the NTUA demo site was the monitoring and the performance evaluation of the novel rooftop BIPV system. For that purpose, the IEC 61724 Standard has been implemented resulting to the measurement and analysis of a significant number of different parameters-from weather conditions to electrical parameters. A common difficulty in such monitoring systems is the large volume of data acquisition and the synchronization of the different monitoring equipment. Therefore, NTUA has developed an advanced real-time and on-line data acquisition monitoring system, where all the different monitoring equipment (weather station, irradiance and temperature sensors, inverters) are connected though MODBUS interface to a common data logger, perfectly synchronized. The gathered data are stored in a database having a 5-min time interval and the user can have access and analyze more than 130 parameters by logging-in to the data base and querying the preferred time period.
Purpose of the present work is to describe the specific details of the demonstration site, the monitoring system as well as the tool developed for the efficient monitoring of the “Construct PV” panels. Moreover, the effect of main parameters (PV cell temperature, partial shading and inclination) on the efficient performance of the PVs is evaluated for a period of 11 months (March 2017-January 2018) in order to provide a detailed quantification of the results for this “Construct PV” BIPV technology.
System Description and Methodology
Site location
The BIPV system installed on top of the roof of the building that hosts the School of Mining & Metallurgical Engineering of the National Technical University of Athens (NTUA) at Zografou campus (Attica, Greece). This building has a clear South orientation with no surrounding obstacles, whereas it is located at a longitude of 23.47”E and latitude 37.58”S. it is noted that the annual energy production in Attica peninsula is approximately 1400kWh/kWp [14,15].
Specifications of solar panels
Figure 1:A close look from the “construct PV” panels.

In the BIPV system, the majority of solar panels were the “Construct PV” panels (Figure 1), which are prototypes developed within the framework of the research program: glass-glass panels coupled with bituminous back cover for waterproofing, having the ability to be used both as building and as roofing material. Meyer Burger (MB) was responsible for the production of the HJT photovoltaic cell having the Smart Wire Cell Technology (SWCT) cell interconnection while TEGOLA was responsible for coupling the bituminous back cover to the PV panel. Commercial thin-film panels were used only in one area of the demo-site (Area 8) due to specific shape requirements of the architectural design. As far as the technical characteristics of the photovoltaic panels are concerned, the “Construct PV” panels consist of monocrystalline solar cells, with power at 48Wp, open circuit voltage (Voc) of 6.5V, short circuit current (Isc) of 9.39A and rated efficiency of 12.3%. Each “Construct PV” panel measures 950mm (Length)x420mm (Width)x10mm (Thickness), resulting to an active area of 884mm (Length)x365mm (Width). It is noted that the electrical characteristic of panels were obtained at STC after lab tests by SUPSI according to IEC standards.
Specification of inverters
Two types of commercial inverters were used in the installed BIPV system: The 1-phase SMA SB 2.5-1VL-40 inverter for the Areas 3 to 8 and the 3-phase inverter for Areas 1 and 2. The 1-phase inverter power rating is 2.5KW, and from the DC side, the maximum input current is 10A and the rated voltage is 360V while from the AC side, the output voltage and current are 230V and 11A. For the 3-phase inverter, the power rating is 8KW and from the DC side, the maximum input current is 15A and 10A and the rated voltage is 580V while from the AC side, the output voltage and current are 230V and 11.6A, respectively. For both inverters, their output is synchronized automatically with same voltage and frequency as that of the utility grid.
Demo rooftop BIPV system layout
The main objective of the roof demonstration BIPV system was to simulate the majority of roof inclinations throughout Europe as well as to demonstrate the effective combination between system’s performance and architectural integration. Therefore, the inclinations and the configuration of the BIPV system were chosen accordingly.
The system’s concept and the architectural approach was performed by UNStudio (UNS), realizing as a first step an extensive analysis of roof topologies within Europe after which the majority of the roof inclinations was identified. According to the findings and with respect to the building’s structural and technical limitations (provided by NTUA), UNS proposed the “dragon tail” design (Figure 2), achieving in this way the proper roof integration combined with an architectural added-value to the existing building. The BIPV system is comprised by eight large areas (Table 1), covering the different European roof inclinations.
Table 1:BIPV system overview.

Figure 2:From the architectural concept (a) to the completed rooftop BIPV system installation (b).

From a technical point of view, the roof demo system targeted the evaluation of the “ease-of-installation”, the identification of possible technical risks, the development of necessary additional installation elements and the inspection of the rigidity and robustness of the whole installation (i.e. construction stability and water tightness). For that purpose, NTUA performed an extensive structural analysis for the metallic substructure that hosted the whole BIPV system. As a result, the metallic substructure in mounted only on the cement structural columns and the walls of the building and was dimensioned accordingly so as to be able to overcome all structural and wind loads. The total nominal rating of the BIPV system is 15kWp and is comprised of 303PV panels (298 “Construct PV” panels and 5 commercial TEGOSOLAR 68i thin-film photovoltaic shingles) with bituminous base, achieving an active area of almost 97.5m2.
Area 8 is a curved area hosting only commercial panels. The rest of the areas accommodate only “Construct PV” panels but are substantially differentiated by the number of panels they host as well as the area inclination. For architectural integration purposes, metal shingles - a common commercial roofing material -covers the rest area of the structure. From the electrical point of view, each area is an individual string. As mentioned previously, from Area 3 to Area 8 there is one dedicated 1-phase inverter per area, whereas Area 1 and 2 are connected to a large 3-phase inverter. The inverters convert the DC current to AC current and provide the renewable energy production to the local utility grid.
Monitoring system equipment
The meteorological conditions in the area are monitored using a Davis Vantage Pro2 Plus cabled weather station, located at the roof of the building, next to the BIPV system, in appropriately selected position, which eliminates the possibility of shading. The weather station includes two components: The Integrated Sensor Suite (ISS), which houses and manages the external sensor array, and the console, which provides the user interface, data display, and calculations. The measured meteorological conditions include (among others) barometric pressure, dew point calculation, heat index, relative humidity, temperature, solar radiation, UV radiation, wind speed and wind direction, rain rate, rain fall etc. The evaluation of a BIPV system requires the recording of the inplane irradiance, therefore pyranometers were installed measuring the in-plane irradiance for each system’s inclination (Figure 3). To accurately measure the temperature of PV system, thermocouples were coupled to the intermediate layer between the PV cells and the bituminous back cover. The thermocouples placed in the middle of the panel (Areas 3 and 7) or in the margins (Areas 1 and 2).
Figure 3:BIPV system overview and positions of the monitoring equipment.

In addition to the abovementioned parameters, electrical characteristics such as current and voltage as well as energy yields are necessary for the performance evaluation of a BIPV system. Figure 4 presents the architecture of the entire monitoring system. From the technical point of view, NTUA database, configured to store each monitoring value with a time interval of 5 minutes, allows the possibility to synchronize all the recorded values according to date and time.
Performance evaluation analysis and monitoring system characteristics
The evaluation analysis of the demo BIPV system is performed in accordance to the International Energy Agency Photovoltaic Power System (IEA PVPS) program and follows the guidelines of IEC standard 61724 [16,17] for the calculation of daily global irradiation, array/final/reference yields, array/system efficiencies, and performance ratio. NTUA, in close collaboration with Fraunhofer ISE, has identified all the necessary monitoring parameters and monitoring procedures needed for the performance evaluation of the BIPV system according to the above standard. These parameters include a variety of data , ranging from meteorological- such as ambient temperature, irradiance, wind speed, etc. -up to electrical and other BIPV-related data - such as module temperature, electrical characteristics, energy yield, etc [18].
A common difficulty for monitoring systems is the synchronization of all monitoring equipment. In order to overcome this technical issue, NTUA, using MODBUS communication protocol, developed a user-friendly monitoring database targeting the desired synchronization. As a result, the user aiming the monitoring and analysis of the BIPV system, has the ability to download all the necessary data for a specific period of time, in a simple calculating application. More information is provided in the section “data acquisition system” Table 2.
Table 2:Performance evaluation parameters according to IEC 61724.

(*) YA: the daily array energy output EA (DC) per KW of installed PV array.
(**) Yf: the daily net energy output EF (AC) per kW of installed PV array.
(***)YR: the ratio of total daily in-plane irradiation by the modules to the reference in-plane irradiance.
(****) PRA: the overall effect of losses on the array’s rated output due to array temperature, incomplete. utilization of the irradiation, and system component inefficiencies or failures and it is defined as the ratio of final yield to the reference yield.
(*****) nA: the mean energy conversion efficiency of the PV array, which is the ratio of daily array energy output EA (DC)to the product of total daily in-plane irradiation and area of the PV array.
Figure 4:Monitoring system architecture.

Data acquisition system
Figure 5:Snapshot from the NTUA online monitoring visualization system.

Four different equipment’s (weather station, pyranometers, thermocouples, inverters) comprise the monitoring system. In total, 136 meteorological and electrical data points are real-time logged into the COMET MS6D data logger and afterwards all the measuring data are stored to the NTUA database (Figure 5). Additionally, online monitoring, alarm signals and value ranges can be defined, and the user can always get informed about the status of the monitoring system, thus the robustness and the reliability of the system is ensured.
NTUA database, configured to store each monitoring value with a time interval of 5 minutes, allows the possibility to synchronize all the recorded values according to date and time. Especially for the case of irradiance, the measurement is performed every minute and then, through integration, the irradiation (Wh/m2) for the 5-min time interval is stored. For the further processing of the monitoring data, the registered user, by using a Username and a Password, has the ability to download the data in csv files and perform the analysis in a simple commercial program.
For facilitating the monitoring process, NTUA has also developed an online, web-based and mobile-friendly visualization of the whole system. The user is able to get informed in real time about all the vital information of the BIPV system (i.e. total or per array energy yield, daily power production, panels’ temperature, etc.) as well as current status of the system (i.e. alarms).
Results and Discussion
The analysis of the results targets to evaluate the concept of the “Construct PV” technology in relation to the main factors that essentially affect the performance of a PV system, such as the weather conditions and module temperature. The collected data for the monitoring period between March 2017 and January 2018 is presented and analyzed in order to evaluate the performance of the whole rooftop BIPV system consists of the “Construct PV” module. To facilitate the evaluation, the results are presented in monthly basis and specific days have also been chosen for emphasizing a behavioral trend of specific parameters that affect the performance of the BIPV system (i.e. to indicate the potential correlation between PRA and partial shading). Special focus is given in the areas being installed with the complete set of monitoring sensors (Area 3, 4 and 7), since concrete comparison results could be extracted regarding the parameters that severely affect the performance of a PV system.
Energy yields (Yf)
Figure 6:Monthly specific energy yields (Yf) in different inclinations, covering both winter and summer period of BIPV system’s operation.

Figure 6 shows that the monthly average yield in respect with the total installation is 122kWh/kWp. Since solar radiation is higher during the summer, compared to the winter, the energy yields seem to follow the same trend. Taking into account both sun path and solar radiation annual variation, the areas having the lowest inclination during the summer period present the higher energy yields and thus the maximum monthly yield is calculated for the Area 6 during July where it produces 170kWh/kWp. In contrast, during the winter period, the areas having higher tilt angles are more exposed to the sun and thus Area 1 and 2 exhibit the highest yield values of up to 85kWh/kWp during December.
Photovoltaic array performance (PRA)
The monthly variation of the array performance ratio in respect with the BIPV system’s different inclinations for a testing period between July 2017 and January 2018 is presented in Figure 7. The overall performance ratio per month for the whole installation is about 0.81 indicating high performance and efficiency of the BIPV system. Area 3 at October and Area 2 at September resulted in the higher and lower performance, i.e. 0.89 and 0.71, respectively. The summer period PRA is reduced by up to 15%, compared to the winter period for the same inclination, indicating that higher ambient temperature leads to higher cell temperature and thus lower PRA values and vice versa. However, due to higher irradiation during summer period, the specific yield is increased during these months.
Effect of PV cell temperature
The operation temperature of the PV modules is a crucial factor that determines the performance [19]. However, in the majority of applications knowing the exact PV cell operation temperature is complicated. Usually this temperature is not measured directly, and only ambient temperature and irradiance are measured. Based on the NOCT of the cell, the operating temperature of a cell could be calculated by the following equation [20,21]
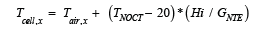
Figure 7:Monthly array performance ratio (PRA).

For measuring directly, the operating temperature of a PV module back surface sensors are used. The main drawback is that there is an inherent difference between the temperature of the back surface and that of the cells inside the module. The electrical performance is primarily influenced by the type of PV used. A typical PV module converts 6-20% of the incident solar radiation into electricity, depending upon the type of solar cells and climatic conditions. The rest of the incident solar radiation is converted into heat, which significantly increases the temperature of the PV module and reduces the PV efficiency of the module.
To compensate this obstacle and be more accurate to the analysis of the BIPV system performance in Athens rooftop demo site, the temperature sensor (thermocouple) has been coupled within the intermediate layer of the PV cell and the back cover. In this way, the measured temperature refers to the PV cell temperature and no further correction is needed, moderating also another uncertainty factor.
The evaluation of the PV cell temperature is performed on the Area 3, as it is not affected by partial shading. Marginal temperature ranges have been selected for 13th of July (summer period) and 8th of December (winter period), whereas the analysis is focused on the monitoring data gathered during the day-hours between 10:00a.m. and 17:00p.m. as after extensive data processing, this is the time frame that presents the highest daily energy harvest.
Figure 8A:Effect of PV cell temperature in PRA within a day.

Τhe correlation between the PV cell temperature and the PRA for the summer period is presented in Figure 8. The highest PRA values are obtained during morning hours, when high irradiance values are present, and the PV cells have not been yet heated up. For the selected summer day (13th of July), the highest PRA value is 0.895, obtained at PV cell temperature of 52.2 °C at 10:10a.m. After 12:00a.m. the temperature of the PV cells is increased up to 78 °C (maximum value), resulting in a significant decrease of the PRA (approximately 15%) (Figure 8a). To better understand how PV cell temperature and PRA are related, the deviation of the optimum daily PRA value in correlation to the PV cell heating during the selected time frame (10:00a.m.-17:00p.m.) is presented in Figure 8b. It is indicated that the higher the PV cell heating the higher the PRA degradation. More precisely, a trend between PRA and PV cell heating can be concluded and a pitch point could be identified; the increase of PV cell temperature above 20oC from the daily optimum operation (i.e. ΔTcell>20 °C) resulted in the PRA decrease by up to 15% (i.e. ΔPRA ≈ 15%)
Figure 8B:%PR reduction due to PV cell heating (Area 3, date : 07/13/2017).

Similar results are presented regarding the correlation between the PV cell temperature and the PRA for the winter period (Figure 9). As shown in Figure 9a, the performance ratio is approximately 0.8 during the day indicating the crucial temperature factor, since daily PV cell temperature does not exceed 53 °C. For the selected winter day (8th of December) the highest PRA value is 0.96 related to PV cell temperature of 35 °C at 10:10a.m. Figure 9b presents the deviation of the optimum daily PRA value in correlation to the PV cell heating during the selected time frame (10:00a.m.-17:00p.m.). It is indicated that the winter low temperatures resulted in respected low PV cell temperatures, compared to the summer period. During the winter period, PV modules present a higher performance ratio leading to the conclusion that the PR’s deviation from the maximum value during daily-hours is up to 10%. However, after 16:00p.m. the PV cell temperature is lower than the one in which the highest daily PRA is reached, but PV performance is decreased. This is because during the winter the amount of irradiance at that day-time is very low leading the entire system to underperform. This is a strong evidence of the multifactorial nature of the PRA, since numerous parameters affect its behavior simultaneously.
Figure 9A:Effect of PV cell temperature in PRA within a day.

Effect of partial shading
As reported in the literature, partial shading is a factor that in some cases is related to more than 10% of losses of the yearly potential in PV systems, which cannot be completely avoided even under optimal modules orientation and inclination conditions [22,23]. To minimize the negative effect of the partial shading, new technologies have been introduced to the “Construct PV” module, such as HJT and SWCT technologies, that according to the manufacturer reduce the shading losses of up to 25% [19,24].
Figure 9B:

To investigate how the partial shading affects the new BIPV module of the NTUA rooftop demo site, the Areas 2 and 4 are chosen. Both these areas are selected, because their performance is affected by shading conditions (Figure 10). Marginal irradiance ranges were also selected, i.e. 21st July 2017 (summer period) and 26th November 2017 (winter period), whereas the analysis is focused on the monitoring data gathered during the day-hours between 10:00a.m. and 17:00p.m., because this is the time frame that presents the highest daily energy harvest resulted by extensive data processing. As it is noted previously, the morphology of the building introduces an inherent partial shading effect to the existing BIPV installation. Since the shading pattern repeatedly occurs within the month, concrete results could be obtained, regarding the negative effect of partial shading to the performance of the BIPV system. Finally, an extensive analysis based on the monthly PRA values is performed to quantify the effect of partial shading on the performance of the BIPV system.
Figure 10:Simulation analysis of shading due to building morphology.

Figure 11a & 11b shows that there is a maximum daily deviation of up to 40% from the daily max PRA for both areas. A daily mean value deviation could be calculated of up to 15%, resulting in a respect monthly under-performance of the shaded areas.
Figure 11A:Effect of partial shading in Area 2 and 4 within, a summer day (07/21/2017)

Figure 11B:Effect of partial shading in Area 2 and 4 within, a winter day (11/26/2017).

Effect of inclination
The inclination of each individual area in respect with the installed rooftop BIPV is a constructive characteristic that remain constant; thus, it introduces an inherent and repeated effect on the system’s performance. As far as the Greece is concerned, the overall optimum orientation and tilt angle PV installations is the South and 30o, respectively [25].
Figure 12 shows the monthly array efficiency for each individual inclination during the monitoring period from July 2017 to January 2018. The total array efficiency of the entire installation is 12%. During October, Area 3 resulted in the maximum value of 13.2%, whereas the minimum system’s efficiency is presented during September by Area 2 (10.5%). Area 3 presents the higher array efficiency, as it is the most unaffected area in regard to the partial shadings. Area 3 has a tilt angle of 22° and thus it is significantly benefited during winter months. During summer period, Area 3 had lower efficiency values by up to 4%, compared to Area 7 (tilt angle: 13°). On the other hand, Area 3 presents up to 12.5% higher efficiency values in comparison to Area 2 (tilt angle: 25° tilt angle), which is affected by the partial shading.
It is expected that the areas 1, 2 and 4 should provide the highest nA particularly during the winter period as it is closer to the optimum angle for Greece. However, these areas present an inherent degradation due to the partial shading effect leading to a nA reduction of more than 4% in comparison to the non-shaded Area 3. Area 3 (22°) has the highest nA as it is non-shaded and the declination from the optimum theoretical angle is up to 25%. This trend can also be detected for the performance ratio of each area, depicting each individual inclination. Figure 13 shows that the lower temperatures (winter period) resulted in higher performance and efficiency and vice versa.
Conclusion
Based on the data resulted by the monitoring of a new generation BIPV’s at a demo-site located at NTUA (Zografos Campus), the following conclusions can be drawn: The new BIPVs, developed within the “Construct PV” project, were successfully integrated at the roof of the School of Mining and Metallurgical engineering. It was showcased that the “Construct PV” modules can replace conventional tiles and other roofing systems while producing energy at the same time. Furthermore, these new building components have proven their functionality and created a waterproof layer on the building.
Figure 12:Monthly array efficiency nA in different inclinations.

Figure 13:Monthly PRA and nA per inclination.

NTUA managed to develop an advanced real-time and online data acquisition monitoring system, where all the different monitoring equipment (weather station, pyranometers, thermocouples, inverters) are connected though MODBUS interface to a common data logger, perfectly synchronized. All the monitoring data are consolidated in a user-friendly web interface, where the installers or the users can easily supervise the system operation and performance.
The photovoltaic array performance, PRA, of summer period is decreased by 15%, compared to the winter period. It is also indicated that the highest values of PRA were obtained during morning hours, when, due to the sunrise there are high values of solar radiation, while the modules have not been yet heated. However, PRA is multifactorial parameter and can be affected by other parameters, such as partial shading, rainfall and soiling, additional to temperature.
The performance of the module seems to be significantly affected by the module temperature. For PV cell temperature increase above 20 °C from the daily optimum operation (ΔTcell>20 °C), the PRA is decreased up to 15% (ΔPRA≈15%). As far as the partial shading is concerned, the tested Areas 2 and 4 showed that there is a maximum daily deviation of up to 40% from the daily max PRA. Taking also into account the inclination, it is indicated that Area 3 (22°) has the highest array efficiency (nA) as it is non-shaded and the declination from the optimum theoretical angle (i.e. Areas 1, 2 and 4) is up to 25%.
Conclusively, in terms of BIPV system productivity during the whole monitoring period, the calculated Annual Specific Energy Yield under all inclinations is more than 1500kWh/kWp which is much higher than the yield of commercial products, even though local high temperatures, system’s inclination and building morphology (partial shading) introduce inherent limitations to the PV system performance.
Supplementary Information
NTUA performed a simulation analysis by using the Sketch- Up commercial program in order to select the proper sensors’ placement and evaluate the effect of shading in the performance of a PV system. In this analysis, the winter and summer solstices were used as reference dates and the marginal hours 10:00a.m. and 16:00p.m. in order to investigate the shadowing effect on our BIPV system due to the morphology of the building. The evaluation of a BIPV system requires the recording of the in-plane irradiance, therefore a total of 6 pyranometers (Figure 3) were installed measuring the in-plane irradiance for each system’s inclination. Additionally, for the evaluation of the partial shading effect a pyranometer has been placed intentionally on Area 4, on which partial shading is caused due to the shape of the building (Figure 10).
Acknowledgment
This research receives funding from the European Union Seventh Framework Programme, project “Construct PV: Constructing building with a customizable size PV module integrated in the opaque part of the building skin”, under the Grant agreement no.: 295981. The authors would also like to thank the anonymous reviewers for their valuable comments.
References
- Blumberga D, Blumberga D, Bazbauers G, Zogla G, Laicane I (2014) Sustainable development modelling for the energy sector. Journal of Cleaner Production 63: 134-142.
- US Energy Information Administration (2016) International Energy Outlook.
- IEA World Energy Outlook (2014) OECD/International Energy Agency, Paris, France.
- García Álvarez MT, Moreno B, Soares I (2016) Analyzing the sustainable energy development in the EU-15 by an aggregated synthetic index. Ecological Indicators 60: 996-1007.
- Khan J, Arsalan MH (2016) Solar power technologies for sustainable electricity generation-A review. Renewable and Sustainable Energy Reviews 55: 414-425.
- British Petroleum (2018) BP statistical review of world energy. (67th edn), London.
- Hussain A, Arif SM, Aslam M (2017) Emerging renewable and sustainable energy technologies: State of the art. Renewable and Sustainable Energy Reviews 71: 12-28.
- (2016) EU Directive of the European Parliament and of the Council, amending Directive 2010/31/EU on the energy performance of buildings.
- Debbarma M, Sudhakar K, Baredar P (2017) Comparison of BIPV and BIPVT: A review. Resource-Efficient Technologies 3(3): 263-271.
- Shukla AK, Sudhakar K, Baredar P (2017) Recent advancement in BIPV product technologies: A review. Energy and Buildings 140: 188-195.
- Biyik E, Araz M, Hepbasli A, Shahrestani M, Yao R, et al. (2017) A key review of building integrated photovoltaic (BIPV) systems. Engineering Science and Technology, an International Journal 20(3): 833-858.
- Jelle BP, Breivik C, Røkenes HD (2012) Building integrated photovoltaic products: A state-of-the-art review and future research opportunities. Solar Energy Materials and Solar Cells 100: 69-96.
- Peppas A, Taxiarchou M, Panagiotopoulou C, Mantelis D, Paspaliaris I (2017) Building integrated photovoltaic systems: integration and performance evaluation in real site application at NTUA premises. In ASHRAE, Energy in Buildings.
- Vokas GA, Lagogiannis KV (2013) PV energy production over greece: comparison of predicted and measured data of medium-scale photovoltaic parks. Int J Eng Res Technol 2(10).
- Protogeropoulos C, Klonaris I, Petrocheilos C, Charitos I, Martinac I (2010) Performance evaluation of different PV module technologies in a grid-connected pilot project in greece. In 25th European Photovoltaic Solar Energy Conference and Exhibition/5th World Conference on Photovoltaic Energy Conversion, pp: 4601-4606.
- IEC (2016) IEC TS 61724-3:2016 Photovoltaic system performance-Part 3: Energy evaluation method.
- IEC (2016) IEC TS 61724-2:2016 Photovoltaic system performance-Part 2: Capacity evaluation method.
- Wittkopf S, Valliappan S, Liu L, Ang KS, Cheng SCJ (2012) Analytical performance monitoring of a 142.5kWp grid-connected rooftop BIPV system in Singapore. Renewable Energy 47: 9-20.
- King DL, Kratochvil JA, Boyson WE (1998) Field experience with a new performance characterization procedure for photovoltaic arrays. In Proceedings of the Second World Conference on PV Solar Energy Conversion, pp. 1947-1950.
- Lungue, Hegebus S (2003) Handbook of Photovoltaic Science and Engineering.
- Bloem JJ (2008) Evaluation of a PV-integrated building application in a well-controlled outdoor test environment. Building and Environment 43(2): 205-216.
- Salam Z, Ramli Z, Ahmed J, Amjad M (2015) Partial shading in building integrated PV system: Causes, effects and mitigating techniques. International Journal of Power Electronics and Drive Systems 6(4): 712- 722.
- Quaschning V (1996) Simulation der Abschattungsverluste bei solarelektrischen Systemen.
- Quaschning V (2005) Understanding Renewable Energy Systems, Earthscan.
- CRES (2009) PV installation guide.
© 2018 A Peppas. This is an open access article distributed under the terms of the Creative Commons Attribution License , which permits unrestricted use, distribution, and build upon your work non-commercially.
Editor In Chief


.jpg)


Signup for Newsletter

Quick Links
 Editorial Board Registrations
 Submit your Article
 Refer a Friend
 Advertise With Us
Our Recent Edition

.jpg)


Top Editors


.jpg)


.bmp)
.jpg)
.png)
.jpg)


.jpg)


.png)

.png)


.png)


Financial Support

Sponsors

Latest e-Books

Latest Video

 a Creative Commons Attribution 4.0 International License. Based on a work at www.crimsonpublishers.com.
Best viewed in
a Creative Commons Attribution 4.0 International License. Based on a work at www.crimsonpublishers.com.
Best viewed in