
- About Us
- Information
-

The Author ensures that the research has been conducted responsibly and ethically with adherence to all relevant regulations. read more..
- For Authors
- For Reviewer
- Manuscript Guidelines
- Membership
- Publication Ethics
-
- Journals
- Reprints
- e-Books
- Videos
- Policies
- Contact Us
 COVID-19
- Submissions


Full Text
Progress in Petrochemical Science
Factorial Design Heat and Mass Transfer of Counter-Current Water Cooling Tower as a Case Study of an Experimental Design Project
Isam Al Zubaidi*, Justin Gwilliam, Kyle Bachelu, Blake Ackerman, Trevor Ficor and Emma Hulbert
Industrial System Engineering at the Faculty of Engineering and Applied Science, University of Regina, Regina S4S 0A2, Saskatchewan/ Canada
*Corresponding author:Isam Al Zubaidi, Industrial System Engineering at the Faculty of Engineering and Applied Science, University of Regina, Regina S4S 0A2, Saskatchewan/ Canada, Email: Isam.Al.Zubaidi@uregina.ca
Submission: May 8, 2023;Published: June 01, 2023

ISSN 2637-8035Volume5 Issue3
Abstract
This work is related to the experimental design project requirement for undergraduate students in the Process Engineering Laboratory/Industrial System Engineering Program at the University of Regina /Saskatchewan-Canada for the Heat Mass and Momentum Transfer. This project is to compare the effectiveness and cooling performance of the standard film fill packing material in a water cooling tower apparatus. The results showed that increasing the air and water flow rates can increase efficiency by approximately 10% and 13%, respectively. The cooling ranges and ideal ranges of the cooling tower were used to calculate efficiencies between 83-97% for the regular packing material. Other calculations were performed, including approach, heat and mass transfer coefficients, the heat emitted, mass and energy balance, factorial design analysis using Minitab, Solid Edge work, etc. Many operating variables were evaluated, such as the effect of packing material, flow rates of air and water, water inlet temperature to study the effect of these variable on the efficiency of water cooling towers, which can be used to optimize cooling tower performance in industrial settings.
Keywords:Water cooling tower; Characteristic; Heat and mass transfer coefficient; Design of experiment
Keywords:A: Heat Transfer Area (𝑚2); Cp: Specific Heat of Fluid (𝑘𝐽/𝑘𝑔∗𝐾); 𝐺: Mass Flowrate of Air (𝑘𝑔/𝑠); ℎ: Enthalpy of Fluid (𝑘𝐽/𝑘𝑔); 𝐿: Mass Flow Rate of Water (𝑘𝑔/𝑠); 𝐿𝑤: Water Level Height (𝑚3); 𝑚̇: Mass Flowrate of Fluid (𝑘𝑔/𝑠); 𝑄: Amount of Heat Transferred (𝑘𝑊); 𝑞: Flow Rate of Fluid (𝐿/𝑚𝑖𝑛); 𝑞𝑚,𝑙𝑜𝑠𝑠: Rate of Water Loss (𝑘𝑔/𝑠); 𝑞𝑣,𝑙𝑜𝑠𝑠: Rate of Water Loss (𝑚3/𝑠); 𝑇𝑎𝑖𝑟: Temperature of Air (℃); 𝑇𝑤: Temperature of Water (℃); 𝑈: Overall Heat Transfer Coefficient (𝑘𝑊/𝑚2.𝐾); Δ𝑇𝑙𝑚: Log mean temperature difference (℃); 𝜌: Density of Fluid (Kg/m3); K: Mass transfer coefficient (Kg/m2.s); NTU: Number of Transfer Unit
Introduction
Water Cooling Towers (WCT) are a very important part of many chemical industries. They are used for cooling large amounts of water in the chemical industry, thermal power plants, nuclear power plants and the petroleum industry [1]. They are also used in HVAC applications, while HVAC systems are typically used in large office buildings, hospitals, and schools. It is an important part of the industrial circulating water system, and its cooling performance directly affects the energy consumption of industrial systems [2]. Their cooling performance directly affects the energy consumption of industrial systems [2]. Many types of WCT are used in applications. Wet types of work using natural flow or mechanical flow. Mechanical cooling towers can either be of the flow pressure or the flow induced type. Air flow and water flow can be in opposing directions (counter current flow), crossflow, or both [3]. Each type of cooling tower has its own characteristics. Based on the type of contact between the hot fluids with the cooling air, the cooling tower can either be a direct contact or an indirect contact type. Many authors have studied the performance of water cooling towers by analyzing the influence of cooling media on the surrounding environment based on experimental techniques [4,5]. Other works have optimized the performance of WCT based on theory [6,7] to reduce energy consumption. Fluent simulation based on a 3D model was used for comparison with the experimental results to analyze the feasibility of the simulation and the reliability of the results [8]. Heat and mass transfer study is achieved by waterair interaction, where hot water is subject to cooler air via forced convection in a counter current tower. The working volume of the tower is filled with packing material to increase the contact between the two phases. Evaporation of the water occurs as a result, which humidifies the air and removes the heat from the water loop.
The cooled water is returned to the initial process and the cycle is repeated. Ultimately, a cooling tower is used to maintain the temperatures of plant processes, prevent overheating of equipment, and maintain efficient plant operation. Cooling tower efficiency is based on the surface area in which the heat transfer is occurring. Hence, cooling towers typically have a packing material which increases the effective area of the tower column. The packing material works on the principle that the hot water is spread across a larger area for a longer amount of time. The packing can spread the water over a thin film across the packing. Splash type packing can be used to distribute the water. An example of the typical packing material for a cooling tower as shown in (Figure 1). The Computer Aided Design (CAD) model of the cooling tower was configured using Solid Edge 2023 is shown in (Figure 2). The major optimization variables for WCT are water to air mass ratio, water mass flow rate, water inlet and outlet temperatures, operational temperature approach, type of packing, height and area of the tower packing, total pressure drop of air flow, fan power consumption, water consumption, outlet air conditions, and number of transfer unit (NTU). The performance of cooling towers is often expressed in terms of range and approach. The cooling range is the difference between the cooling tower water inlet and outlet temperatures.
Figure 1:Typical cooling tower packing materials of two different densities.

Figure 2:Solid edge model of cooling tower.

𝐶𝑜𝑜𝑙𝑖𝑛𝑔 R𝑎𝑛𝑔𝑒 = 𝑇𝑤,𝑖𝑛-𝑇𝑤,𝑜𝑢𝑡 (1)
It is important to understand the wet bulb temperature of
inlet air and how it influences the performance of a cooling tower.
At the same capacity, increasing the range of WCT will reduce the
capital and energy costs of the condenser water system, since less
water would be required for a specific capacity [9]. The Approach
is another important factor used to analyze the performance
of a cooling tower. The Approach is the difference between the
cooling tower outlet cold water temperature and ambient wet bulb
temperature, which is a function of cooling tower capability, and
can be mathematically described as:
𝐴𝑝𝑝𝑟𝑜𝑎𝑐ℎ = 𝑇𝑤,𝑜𝑢𝑡-𝑇𝑎𝑖𝑟,𝑖𝑛 (𝑤𝑒𝑡) (2)
The ideal range is used in finding the cooling tower’s
effectiveness:
𝐼𝑑𝑒𝑎𝑙 𝑅𝑎𝑛𝑔𝑒 = 𝑇𝑤,𝑖𝑛-𝑇𝑎𝑖𝑟, 𝑖𝑛 (𝑤𝑒𝑡) (3)
The effectiveness of a water cooling tower is a measure of its
efficiency, to determine how well the cooling tower is operating.
Calculating the cooling tower’s effectiveness, or in other terms, its
efficiency depends on the range and approach [10]. The cooling
tower’s effectiveness is the ratio of range to the ideal range, i.e., the
difference between cooling water inlet temperature and ambient
wet bulb temperature.
The cooling coefficient or the Effectiveness = Range/ Ideal
range (4)
The cooling coefficient or Effectiveness = Range/ (Range +
Approach).
Effectiveness = 100* (Tw in-Tw out)/(Twin-T air in (wet)) °C
(5)
The schematic plot for Range and Approach is shown in (Figure 3) [11]. The packing density of a cooling tower is the ratio of the surfaces of all levels of the cooling column in relation to the volume of the cooling column VK (m2/m3). The cooling capacity is the heat rejected in KW/hr given as product of mass flow rate of water, specific heat and temperature difference. The Evaporation Loss is the quantity of water evaporated from the tower in creating the cooling duty. Under steady state conditions the evaporation loss will equal to the loss of water from the sump tank, indicated via level sensor Lw. The makeup water is the quantity of pure water which must be added to the water circuit to make good the losses due to evaporation and other causes. The performance of WCT, water outlet temperature, and efficiency is expressed as functions of the water-to-air mass flow rate ratio, L/G. They considered that the tower performance decreases with an increase in the L/G ratio [12]. The ratio can influence the operational costs and sizing of the cooling tower. Increasing the air flow would result in a small ratio and an increase in operational costs, since additional air is drawn from the fan. However, this would also decrease the approach and result in higher effectiveness to some extent. Thermodynamics rules dictate that the heat removed from the water must be equal to the heat absorbed by the surrounding air:
Figure 3:Range and approach [12].


Where:
Tw, in=hot water temperature (°C)
Tw, out=cold water temperature (°C)
h2=Enthalpy of air-water vapor mixture at exhaust wet-bulb
temperature
h1=Enthalpy of air-water vapor mixture at inlet wet-bulb
temperature
The cooling capacity is the amount of heat that the cooling tower
can reject [13]. This varies and plays an important role in designing
a cooling tower. The following equation shows the formula that
can be used to calculate the cooling capacity of a cooling tower,
which depends on the mass flow rate of water, specific heat, and
temperature difference.
𝑄=𝑚̇𝑤𝐶𝑝𝑤(𝑇𝑤,𝑖𝑛-𝑇𝑤,𝑜𝑢𝑡) (7)
The overall heat transfer coefficient of the cooling tower can be
solved after finding the cooling load is:
𝑄𝑤=𝑈𝐴Δ𝑇𝑙𝑚 (8)
The log mean temperature difference is shown in (Figure 4).
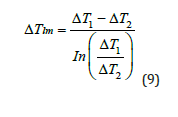
Figure 4:Log mean temperature graph.

The area is calculated as follows: 𝐴𝑟𝑒𝑎=𝐶𝑟𝑜𝑠 𝑠𝑠𝑒𝑐𝑡𝑖𝑜𝑛𝑎𝑙 𝑎𝑟𝑒𝑎∗𝑛𝑢𝑚𝑏𝑒𝑟 𝑜𝑓 𝑙𝑎𝑦𝑒𝑟𝑠 (10)
The rate of water lost by volume and mass. First the crosssectional
area needs to be calculated as follows.
C𝑟𝑜𝑠𝑠 𝑆𝑒𝑐𝑡𝑖𝑜𝑛𝑎𝑙 𝐴𝑟𝑒𝑎 of the sump tank=𝐿𝑒𝑛𝑔𝑡ℎ∗𝑊𝑖𝑑𝑡ℎ (11)
The area of the tank = 0.22 x 0.285=0.0627m2. The volume of
water lost in time can be calculated in 𝑚3 using the level reading
(Lw) from the data collected during the work.
𝑉𝐿 = 𝐿𝑤∗ 𝐶𝑟𝑜𝑠𝑠 𝑆𝑒𝑐𝑡𝑖𝑜𝑛𝑎𝑙 𝐴𝑟𝑒𝑎 of the sump tank x1000(m3)
(12)
Following the volume of water lost, the rate of water loss by
volume in 𝑚3/𝑠 can then be calculated by diving the volume lost in time by the time between trials.
𝑞𝑣,𝑙𝑜𝑠𝑠=(𝐿𝑤∗𝐶𝑟𝑜𝑠𝑠 𝑠𝑒𝑐𝑡𝑖𝑜𝑛𝑎𝑙 𝑎𝑟𝑒𝑎) / 𝑡 𝑖𝑚𝑒=𝑉𝐿/𝑡 (13)
Finally, the rate of water loss by mass can be calculated in kg/s.
𝑞𝑚,𝑙𝑜𝑠𝑠=(𝜌∗𝐿𝑤∗𝐶𝑟𝑜𝑠𝑠 𝑠𝑒𝑐𝑡𝑖𝑜𝑛𝑎𝑙 𝑎𝑟𝑒𝑎)/𝑡𝑖𝑚𝑒=𝜌∗𝑞𝑣,𝑙𝑜𝑠𝑠 (14)
The mass and heat balance calculations are summarized using (Figure 5). The mass of water lost from the sump tank in a given time t (secs) can be determined from the change in water level using the readings from the level sensor Lw (mm). The corresponding volume of water can be calculated using the cross sectional area of the sump tank:
Figure 5:Heat and mass balance scheme plot.

The rate of water loss by volume=(Lw* 0.0627/1000)/t(m3/sec) (15)
The rate of water loss by mass (Make-up rate)=𝜌water x Lw x 0.0627x1000)/t(kg/s) (16)
Evaporation loss is the water quantity evaporated for cooling
duty and, theoretically, for every 10,00,000 kCal heat rejected,
evaporation quantity works out to 1.8 m3. An empirical relation
used often is [14]:
Evaporation Loss (m3/hr)=0.00085 x 1.8xcirculation rate (m3/
hr) x (Tw ,in-Tw, out) (17)
The mass of water gained by air can be determined from the
change in specific humidity (Humidity Ratio) of the air: Considering
a fixed parcel of air, the Specific Humidity SH is the ratio of the Mass
of Water Vapor (mv) in the parcel to the total mass of air (ma+mv)
where ma is the mass of dry air present. In practice, the specific
humidity is approximately equal to the ratio of the mass of Water
Vapor (mv) in the parcel to the Mass of Dry air (md). The mass
of water gained by the air can be determined from the change in
specific humidity (Humidity Ratio) of the air: Considering a fixed
parcel of air, the Specific Humidity SH is the ratio of the mass of
Water Vapor (mv) in the parcel to the total mass of air (ma+mv)
where ma is the mass of dry air present. In practice the Specific
Humidity is approximately equal to the ratio of the mass of Water
Vapor (mv) in the parcel to the Mass of Dry air (md). Therefore, by
using a Psychrometric App or Psychrometric chart to determine the
Specific Humidity, the change in the mass of water vapor between
the inlet and outlet of the tower can be determined. The Mass Flow
of Air (ma) at the inlet and the outlet can be calculated from = Qa*𝜌a from the measurements of the Dry bulb Temperature and Relative
Humidity at the inlet and outlet, the increase in the mass of water
vapor at the outlet can be calculated:
Increase in mass of water vapor=mv (outlet)-mv(inlet) =
= (ma*SH) at outlet-(ma*SH) at inlet (18)
In practice, a small amount of water may be lost from the system via the orifice at the top of the tower in the form of small droplets. For this reason, the loss of water from the sump tank will usually be larger than the calculated loss due to the increase in humidity of the air. The heat balance can be calculated from the following information. Heat input to the system consists of electrical Power Supplied to The Water Heater (PWR) and work done by the Water Pump (P). However, the small size of the DC motor driving the water pump means that heat input to the water via the pump is negligible and can be ignored. In a larger system, heat input via the pump might be significant and should be included. In the system, low humidity air enters at the base of the tower and high humidity air leaves at the top, resulting in a change in enthalpy. The heat load is the amount of heat required to remove from the water which is to be cooled. Heat transfer in cooling towers occurs by two major mechanisms: sensible heat transfer from water to air (convection) and transfer of latent heat by the evaporation of water through the air water boundary layer. The total heat transfer is the sum of these two boundary layer mechanisms. The mass and heat transfer between a falling liquid film along a vertical wall and upward flowing air connected directly with the film is based on the optimization of the passage diameter and passage length and the selection of packing material to provide a high specific surface area [15].
It is shown that 96% of the cooling towers use PVC packing with smooth and cross ribbing. The total heat transfer can also be expressed in terms of change in enthalpy of each bulk phase. The fundamental equation of heat transfer in the cooling tower is given by F. Merkel, which is known as Merkle’s equation.
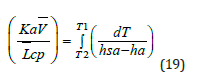
The right-hand side of Merkel’s equation is difficult to calculate as terms (hsa-ha) can’t be expressed in terms of temperature. The alternate method is Simpson’s rule, which is used to evaluate the integral.
The loading factor L- can be calculated (Figure 6) [16]. Mass transfer occurs between atmospheric air and hot inlet water. This phenomenon is purely psychrometric. Two types of heat transfer processes occur simultaneously, the sensible and evaporative heat transfer.
Figure 6:Loading factor calculation-curved lines on graph indicate outlet water temperature [17].

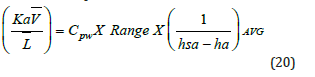
Mw Cpw dT=Ka dV (hsw-ha )=ma dha (21)
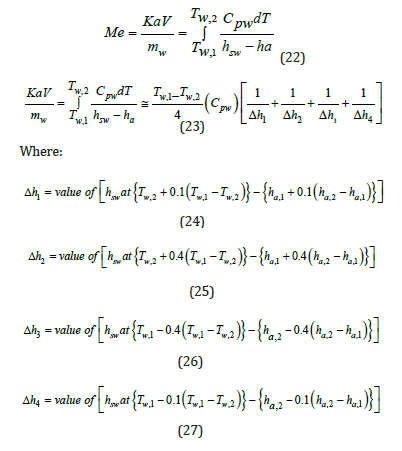
Range= Tw, in-Tw, out R refers to the temperature difference between the inlet water and outlet water of the cooling tower, which is known as the range of cooling water, Me is known as the Merkel number. It is a nondimensional performance coefficient. It is known as NTU (Number of Transfer Unit).
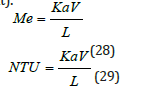
To calculate the mass transfer coefficient Ka, it is required to calculate the Merkel integral from an enthalpy-temperature diagram. The inlet and outlet water temperatures and the enthalpy of air are changing along the packing zone. The value of the enthalpy difference (Δ𝐻) gives an information about the Merkel number. It is shown that if this value decreases, there is an increase in KaV/L and this require to increase airflow for cooling and the L/G ratio depends on KaV/L, as well as air and water conditions and the height of the packing material as shown in (Figure 7) [17]. The wet bulb temperature is the lowest temperature that water theoretically can reach by evaporation. It is an important parameter in WCT selection and design. The wet bulb temperature of the air entering the cooling tower determines operating temperature levels throughout the system. Thermal potential is required to reject heat, so it is not possible to cool water to the entering air wet bulb temperature, when a heat load is applied. The approach is a function of thermal conditions and tower capability.
Figure 7:Performance curve for 1500mm height cooling fill [18].

A small amount of heat will be transferred from the tower and sump tank to the surroundings. For this reason, power supplied to the heater PWR may be slightly larger than the heat transferred into the system. The cooling tower supplier is required to furnish a tower of sufficient capability to absorb the effects of the increased wet bulb temperature. It is very important to have the cold water temperature low enough to exchange heat or to condense vapors at the optimum temperature level. By evaluating the cost and size of heat exchangers versus the cost and size of the cooling tower, the quantity and temperature of the cooling tower water can be selected to get the maximum economy for the particular process.
Experimental Work
The cooling tower is mounted on the top of a heated water reservoir. The cooling tower is manufactured from clear acrylic for visibility and has an easily removable front face to allow different packing materials to be inserted. The packing material is easy to handle and store. Water is pumped from the reservoir to the top of the tower using a variable speed pump. An array of spray nozzles ensures a uniform distribution of the water throughout the packing column. The water is cooled by the air flow from the variable speed fan, which blows air upwards through the tower. Measurements of temperature and RH of the air at the inlet and outlet of the packing allow the change in moisture content of the air to be derived and the mass transfer due to the evaporative cooling to be calculated. The water is heated by an electrical heater in the sump tank. This can be operated in a closed loop mode to control the water at a specific temperature, or it can be operated at any defined power to simulate a fixed load system. All controls and displays are incorporated into the software supplied with the unit. From the software, it is possible to change the pump and fan speeds, to control the heater and to display all the sensor values. Safety is required during the experimental work by checking the water level of the reservoir before starting the work, otherwise the heater will damage when dry and never operate the pump while dry because lack of water to lubricate the pump will damage it. The humidity sensors at the air outlet are protected by a protective tube against water condensation on the measurement cell. If this is disregarded, the unit will display incorrect measured values. If this happens, allow the measurement cell to dry in the air. The standard packing, labeled Packing A, is provided with 500mm X 150mm X 150mm overall dimensions. The flute size is 27mm, with a packing density of 125m2/m3. Each block of packing is skinned with a thin clear PVC casing to avoid damage to the convoluted structure during handling and storage and to ease installation and removal when changing the packing [18]. The equipment set up is shown in (Figure 8). The solid Edge for the design column is shown in (Figure 9). The WCT is connected to a computer to collect the data and to plot the air flow rate; water flow rate, temperature of inlet and outlet of air and water, relative humidity, water level inside the water tank, etc. with sample reading as shown in (Figure 10).
Figure 8:Equipment set-up and packing materials.

Figure 9:Solid edge draft file for apparatus column.

Figure 10:Software output from WCT system.

Result and Discussion
Many packing materials were designed and assembled by students to check the characteristics and the performance of these materials. The packing material needs to have the following features: Light weight with the same dimensions as the manufacturer’s samples; has a high surface area and contact time between the air and hot water stream; not affecting water; and not causing a high pressure to drop. Three student models for WCT designed packing materials are shown in (Figure 11). Two packing models were taken to understand the characteristics and performance of WCT. In this work, many variables affect the performance of the water cooling system; air flow rate; water flow rate; and hot water temperature. Many trials were evaluated by changing one operating variable while keeping the other two variables constant. The wet bulb temperatures of the air inlet must be calculated from the dry bulb temperatures and relative humidity using a psychrometric chart or psychrometric calculator [19]. The main data for regular packing and other packing is shown in (Tables 1 & 2). The wet temperature of the air is equal to 9.6 o C. The efficiency of the cooling tower can also be calculated, using the ranges.
Figure 11:Solid edge models of assembled packing materials.

𝐶𝑜𝑜𝑙𝑖𝑛𝑔 𝑅𝑎𝑛𝑔𝑒 = 𝑇𝑤,𝑖𝑛-𝑇𝑤,𝑜𝑢𝑡 = 42.5-15.2=27.3
𝐼𝑑𝑒𝑎𝑙 𝑅𝑎𝑛𝑔𝑒=𝑇𝑤,𝑖𝑛-𝑇𝑎𝑖𝑟,𝑖𝑛(𝑤𝑒𝑡) = 42.5-9.6 = 32.9
𝐴𝑝𝑝𝑟𝑜𝑎𝑐ℎ = 𝑇𝑤,𝑜𝑢𝑡-𝑇𝑎𝑖𝑟,𝑖𝑛(𝑤𝑒𝑡) = 15.2-9.6 = 5.6
Table 1:Regular fill material - cooling tower efficiency and cooling load.

Table 2:Experimental fill data - cooling tower efficiency and cooling load.

Approach is the most important indicator of cooling tower performance. It dictates the theoretical limit to the leaving coldwater temperature and no matter the size of the cooling tower, range or heat load: it is not possible to cool the water below the wet bulb temperature of air. The effectiveness refers to the thermal efficiency of the cooling tower fill and the evaporative process; do not confuse this with the mechanical efficiency of the cooling tower. Mechanical efficiency refers to the fan power that’s required to circulate ambient air over the cooling tower fill. Different types of cooling towers differ in their mechanical efficiencies.
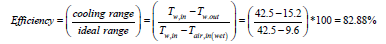
The standard packing was used in experiments to calculate cooling ranges, ideal ranges of the cooling tower, and efficiency. The efficiency is between 82.88-96.53%. The efficiency of the baseline experiment showed the lowest efficiency, with a water flow rate of 1L/s and an air flow rate of 40L/s. Altering either the fan speed, water flow, or both increased the efficiency of the cooling tower. The smaller approach temperature indicates a more effective tower. Selecting the water cooling tower with a close approach will supply the cooler water but the capital cost and energy consumption of the tower will be higher, too. Changing Packing A’s baseline experiment by increasing air flow rate in increments of 15L/s was determined to increase the efficiency approximately 10% upon the first increase in fan speed. Further fan increases of 15L/s increased the efficiency of the cooling tower by about 1-1.5% for each following trial. Increasing air flow rate will also increase the turbulence of the air through the packing material.
Hence, this explains the steady increase in efficiency from
baseline. In terms of changing water flow rate from baseline, an
increase in water flow rate in increments of 0.5L/s was determined
to increase the efficiency approximately 13% upon the first increase
in fan speed. However, further increases to water flow rate only
marginally increased the efficiency of the cooling tower. The
marginal efficiency increase suggests that the relationship between
tower efficiency and water flow is logarithmic in nature. Unlike
air flow, increasing the flow rate likely has minimal effect on its
interaction with the packing material, as water will attempt to flow
along the packing material using the surface tension of the packing
to travel along the surface, with gravity aiding it down the packing
and back to the pump/reservoir. The cooling load of the cooling
tower is equal to the heat emitted by the water and can be calculated
as follows using the properties of water from an engineering
toolbox [20,21].
𝐶𝑜𝑜𝑙𝑖𝑛𝑔 𝐿𝑜𝑎𝑑 = 𝑄= 𝑚̇𝐶𝑝Δ𝑇 = 𝑞𝑤∗𝜌w∗𝐶𝑝∗Δ𝑇𝑤=2.02 𝑘𝑊
The mass flow rate of Water (L) and Air (G) were calculated
from the volumetric flow rate of the inlet water and air and the
density of water and air at inlet temperature of both streams.
L=0.02kg/s and G=0.05kg/𝑠.The ratio of L/G=0.382.
Heat transfer in cooling towers occurs by two major mechanisms: sensible heat transfer from water to air (convection) and transfer of latent heat by the evaporation of water at the air water boundary layer. The total heat transfer is the sum of these two boundary layer mechanisms. The total heat transfer can also be expressed in terms of change in enthalpy of each bulk phase.
The change in energy due to sensible heat absorbed by dry air
is:
𝑄𝑎 = 𝑚̇𝐶𝑝,𝑎 . Δ𝑇𝑎
𝑄𝑎=0.05 Kg/sx1.004(Kj/Kg K) x (13.4-9.6)=0.191KW
The change in energy due to latent heat absorbed by the air is:
𝑄𝑎=𝑚̇ (h2-h1)
The enthalpy of inlet and outlet air to the cooling column was
measured at their relative humidity using a psychrometric chart
calculator [22].
= 0.05x(37.5-27.6 )=0.495 KW
Therefore , the heat absorbed by the air = 0.191+0.495=0.686 KW
This implies that only 27.84% of the heat rejected by the water
is transferred to the air by sensible heat, while latent heat extract
72.16% of the heat rejected. This is in concise with other work who
showed that the major amount heat transfer to the air is through
evaporative cooling while only about 25% of the heat transfer is
through sensible heat [23]. The water evaporated when air and
water came in contact. The rate of evaporation can be calculated
[24].
Mev=ma(ω2-ω1) (29)
Where mev refers to the mass flow rate of the evaporated water
ω2, ω1 is the specific enthalpy of inlet and outlet air to the column
(kg/kg of dry air)
Mev=4.9346x10⁻⁴Kg/s
The convective and evaporative heat transfer along with
water loss through evaporation can be calculated [25].The authors
proposed the following relation to improve Merkel equation to
calculate the heat rejection rate of water.
Qw=mw Cp, w Tw, o-(mw-Mev) Cp, w Tw, in (30)
= 2.0069 Kj/s
height reading (Lw).
𝑉𝐿=𝐿𝑤 x 𝐶𝑟𝑜𝑠𝑠 𝑆𝑒𝑐𝑡𝑖𝑜𝑛𝑎𝑙 𝐴𝑟𝑒𝑎 = 3x0.062 x10-3=1.86 x10⁻⁴ 𝑚3
The rate of water loss by volume = 3.1x10⁻⁷𝑚3/𝑠
The rate of water loss by mass = 3.1𝑥10−4𝑔/𝑠
The overall heat transfer coefficient U can be found using: 𝑄𝑤 =𝑈𝐴Δ𝑇𝑙𝑚
The log mean temperature was calculated using the inlet and
outlet temperatures of the water and wet bulbs.
Δ𝑇𝑙𝑚 = 14.31 𝐾
The heat transfer surface area is equals to ax V (31)
where a is the means area of transfer surface per unit of tower
volume. (m2/m3), and V means an effective tower volume (m3) [26].
Surface area available of packing material=1.406m2
Overall heat transfer coefficient U=0.103𝑘𝑊/𝑚2.𝐾
For the calculation of mass transfer coefficient, the values of
(Δ𝐻1), (Δ𝐻2), (Δ𝐻3), and (Δ𝐻4) from equations (24-27) were calculated at the water and air temperatures, then equation (23)
was applied to calculate KaV/L. It is found that:
KaV/L = 0.55Kg air/Kg water = NTU
From (Figure 6), the loading factor at the setting inlet and outlet
water temperatures can be estimated by extrapolation and it is
equal to 0.23l,w/s.m2 which is equal to 0.23Kg,w/s.m2. The loading
factor is a function of inlet and outlet water temperature [27].
Then K=0.126Kg air/m2.s
This value seems to be concise with (Figure 7). The value of KaV/L which is the number of transfer unit is called tower characteristics which vary with L/G [28]. This work was repeated for all collected data for the regular and the experimental packing of model 1. (Figure 12-17) were plotted for both packing for comparison. Cooling towers are usually specified to cool a certain flow rate from one temperature to another temperature at a certain wet bulb temperature. The performance of water cooling towers is increasing with an increase in air mass flow rates (Figure 12). This is in agreement with many works related to water cooling towers [29], which determine the complete performance parameters for a given inlet and outlet water and air conditions. The cooling tower’s performance increases with increasing air flow rate and decreases with increase in water to air mass ratio. Changing Packing A’s baseline experiment by increasing air flow rate in increments of 15L/s was determined to increase the efficiency by approximately 10% upon the first increase in fan speed. A further increase of 15L/s causes an increase in the efficiency of the cooling tower by about 1-1.5% for each following trial. Increasing air flow rate will also increase the turbulence of the air through the packing material. Hence, this explains the steady increase in efficiency from baseline. The effectiveness was plotted by changing the mass flow rates of water, as shown in (Figure 13), Figure 13 is in agreement with other works [30].
Figure 12:Air flow rate vs efficiency.

Figure 13:Water flow rate vs efficiency.

Figure 14:Water flow rate vs overall heat transfer coefficient.

Figure 15:Air flow rate vs overall heat transfer coefficient.

Figure 16:Water flow rate vs heat emitted from water.

Figure 17:Air flow rate vs heat emitted from water.

The efficiency of WCT is decreasing with thei ncreasing mass flow rate of water. The heat transfer coefficient was plotted with mass flow rate of water (Figure 14) and mass flow rate of air (Figure 15). It is found that there is an increase in the heat transfer coefficient with increasing water mass flow rate as well as the air mass flow rate. It is shown that the water flow rate, air flow rate and water temperature are the most important factors for the characteristics of WCT [31]. They concluded that tower effectiveness was achieved at a lower water flow rate, higher air flow rate and medium water temperature. This work is in agreement with many other works. The heat transfer rate increases with the mass flow rate of air (Figure 17).
Factorial Design with Regular Fill Material
Factorial Design typically uses the maximum and minimum values of a system, with trials taken in randomized order. This is done as the rest of the data points can be interpolated. As only limited data was collected with two factors, water and air speeds, all data was used. Temperature was not varied in any trials, so it was not considered as a factor. A future recommendation for the process would be to vary three factors at their maximum and minimum r anges, and more trials should be done in order to better prove statistical significance. All collected data that was used for the factorial design is shown in (Table 3) and a design of experiment analysis was performed with Minitab. The coded coefficients and model summary are shown in (Table 4). The coded coefficient and analysis of variants are shown in (Table 3). As expected, the data shows a p-value less than 0.05 for both air and water flow speeds showing both factors are statistically significant in the process. These results can be shown in (Figure 18 & 19). The factorial design conducted on the regular packing material supports the above. (Figure 19) shows the standardized effect of fan/air speed is greater than that of water flow rate. While both show a statistical p-value less than 0.05, indicating both parameters are of statistical importance to the experiment. A lower p-value is generally considered better, as it indicates stronger evidence against the null hypothesis (ho). Altering either the fan speed, water flow, or both increased the efficiency of the cooling tower, and was also proven as such using a factorial design of experiment.
Table 3:Factorial design data.

Table 4:Factorial design results.

Figure 18:Pareto chart.

Figure 19:Plots graph.

Conclusion
The results indicate that changing the baseline experiment of Packing A by increasing the air flow rate in increments of 15L/s, can increase efficiency by approximately 10%, while increasing water flow rate in increments of 0.5L/s can increase efficiency by approximately 13%. However, continuously increasing the water flow rate only marginally increases efficiency, indicating a logarithmic relationship occurs between the two. The custommade experimental fill of compacted aluminum foil showed significantly lower efficiency than the material in Packing A. The initial conceptualized idea behind using tinfoil balls as a packing alternative was due it its unique thermal properties, despite having a high thermal conductivity, the results yielded to be less than half the efficiency of Packing A. The increase in water flow rate showed a significant decrease in tower efficiency, while the increase in air flow rate over experimental trials showed a noticeable increase in tower efficiency. Overall, the study provides insight into the effect of packing material and flow rates on the efficiency of cooling towers and can be used to optimize cooling tower performance in industrial settings (Table 5).
Table 5:Coded coefficients and analysis of variance summary.

Acknowledgement
The authors would like the thank Industrial System Engineering Program in the Faculty of Engineering and Applied Science at the University of Regina/Saskatchewan-Canada for providing the required laboratory equipment for the process engineering laboratory.
References
- Agrawal R, Kaushik SC, Bhatti TS (2015) ASHRAE Handbook-2008 HVAC systems and equipment (SI), American society of heating, refrigeration and air conditioning Open Journal of Applied Sciences 5(7):
- Ruiz J, Kaiser AS, Lucas M (2017) Experimental determination of drift and PM10 cooling tower emissions: Influence of components and operating conditions. Journal Environmental Pollution 230: 422-43.
- Edmondson C (2018) How to Pick a cooling tower: Crossflow versus counterflow.
- Qi X, Liu Y, Guo Q, Yu J, Yu S (2016) Performance prediction of seawater shower cooling towers. Journal of Energy 97: 435-443.
- Zhao L, Ge Y, Kareem A (2017) Fluctuating wind pressure distribution around full-scale cooling towers. Journal of Wind Engineering and Industrial Aerodynamic 165: 34-45.
- Ghazani MA, Hosseini AH, Emami MD (2017) A comprehensive analysis of a laboratory scale counter flow wet cooling tower using the first and the second laws of thermodynamics. Journal of Applied Thermal Engineering 125: 1389-1401.
- Rao RV, More KC (2017) Optimal design and analysis of mechanical draft cooling tower using improved Jaya International Journal of Refrigeration 82: 312-324.
- Yang B, Sun Y, Song J, Zhao Z (2019) Analysis of factors affecting cooling performance of cooling tower, IOP Conf. Series. Earth and Environmental Science
- Abboud R (2022) Improving cooling tower water and energy efficiencies based on a new analytical method, MSc Thesis. Department of Energy Technology KTH . Royal Institute of Technology. Stockholm, Sweden.
- (2020) Cooling Tower Efficiency Chemical Engineering Site.
- Chapter (7) Cooling tower. Bureau of Energy Efficiency, pp. 135-151.
- Bedekar SV, Nithiarasu P and Seetharamu KN (1998) Experimental investigation of the performance of a counter flow, packed-bed mechanical cooling Energy 23(11): 943-947.
- Vishwakarma KS, Bhoyar AS, Larokar SK, Hote VV, Bhudhbaware S (2015) Study the factors on which efficiency of cooling tower can be critically acclaimed (a case study). International Journal of Engineering Research and Applications 5(4): 73-79.
- Green DW, Southard MZ Perry’s (2019) Chemical engineers handbook, 9th (edn), McGraw-Hill Education, New York, USA.
- Goshayshi H How to design compact mass transfer packing for maximum Advanced Computational Methods in Heat Transfer, p. 53.
- Anjarlekar SD, Ayare AA, Bakshi D, Bhosale ST, Goilkar SS (2018) Study and design of cooling tower. International Journal of Engineering Science and Computing, pp. 18244-18247.
- Zengin G, Onat A (2020) Experimental and theoretical analysis of mechanical draft counterflow wet cooling towers. Science and Technology for the Built Environment 27(1): 14-27.
- Armfield (2015) Basic water-cooling tower instruction manual model UOP6-MKII Armfield
- Knight J (2020) Psychrometric calculator. Kwangu.
- (2003) Air-thermophysical Engineering Toolbox.
- (2003) Water -thermophysical Engineering Toolbox.
- Psychrometric
- Hooman K, Gurgenci H, Guan Z, Lu Y, Lucas M (2015) Proceedings of the 17th IAHR international conference on cooling tower and heat exchanger. Gold Coast, QLD,
- Kroger DG (2004) Air-cooled heat exchangers and cooling towers; thermal-flow performance evaluation and design, volume 1. PennWell Books, Oklahoma, USA.
- Kloppers JC (2003) A critical evaluation and refinement of the performance prediction of wet-cooling towers. University of Stellenbosch, Stellenbosch, South Africa.
- Grover DS, Hadgekar P (2019) Thermal and numerical analysis of wet cooling tower for shore based naval marine boiler, International Journal of Engineering Research & Technology (IJERT) 8(4): 325-346.
- Restrepo ML, Reyes RM (2017) Modeling and simulation of counterflow wet-cooling towers and the accurate calculation and correlation of mass transfer coefficients for thermal performance prediction. International journal of refrigeration 74: 47-
- Chitale PR, Gamare RK, Chavan SK, Chavan SR, Yekane AS (2018) Design and analysis of cooling tower. Journal of Engineering Research and Application 8(4): 79-84.
- Pushpa BS, Vaze V, Nimbalkar PT (2014) Performance evaluation of cooling tower in thermal power plant-A case study of RTPS Karnataka. International Journal of Engineering and Advanced Technology (IJEAT) 4(2): 110-114.
- Ramakrishnan R, Arumugam R (2014) Experimental study and performance analysis of ceramic packing cooling tower using Taguchi Method. Int. J. of Thermal & Environmental Engineering 8(1): 45-53.
- Singla RK, Singh K, Das R (2016) Tower characteristics correlation and parameter retrieval in wet cooling tower with expanded wire mesh packing, Applied Thermal Engineering 96: 240-249.
© 2023 Isam Al Zubaidi. This is an open access article distributed under the terms of the Creative Commons Attribution License , which permits unrestricted use, distribution, and build upon your work non-commercially.
Editor In Chief


.jpg)


Signup for Newsletter

Quick Links
 Editorial Board Registrations
 Submit your Article
 Refer a Friend
 Advertise With Us
Our Recent Edition

.jpg)


Top Editors


.jpg)


.bmp)
.jpg)
.png)
.jpg)


.jpg)


.png)

.png)


.png)


Financial Support

Sponsors

Latest e-Books

Latest Video

 a Creative Commons Attribution 4.0 International License. Based on a work at www.crimsonpublishers.com.
Best viewed in
a Creative Commons Attribution 4.0 International License. Based on a work at www.crimsonpublishers.com.
Best viewed in